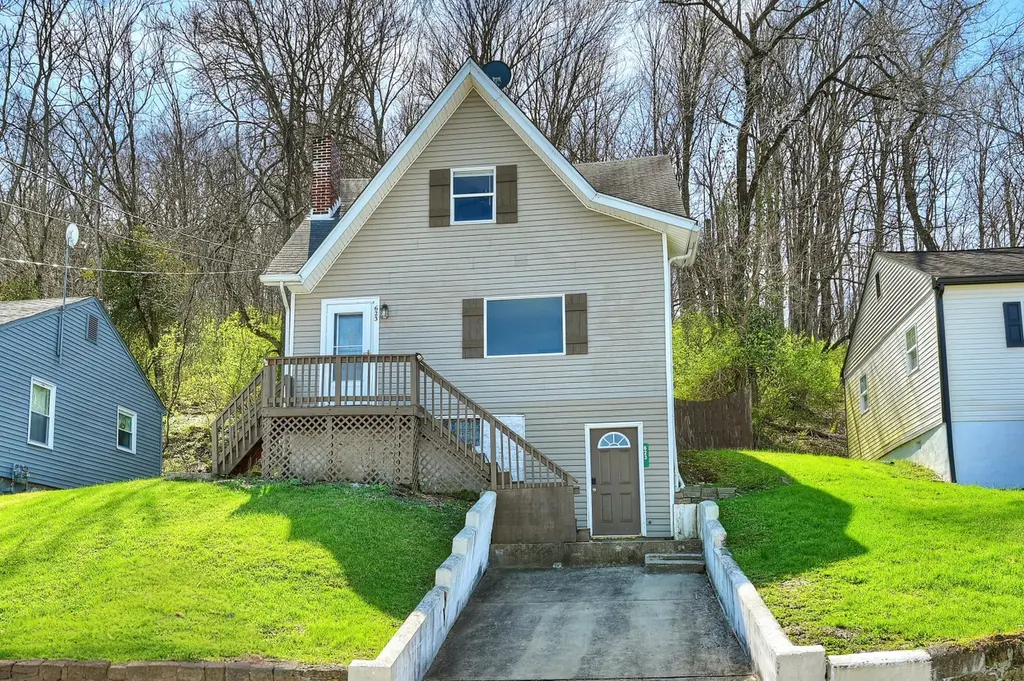
623 Cleveland Ave · Taylor Mill, KY
Flood risk 1/10 · Minimal
- FEMA flood zone
- X (unshaded)
- Chance of flooding over 30 yrs
- 0.0%
- Est. flood insurance / yr
- $507 – $1,088
Fire risk 1/10 · Minimal
- Est. fire insurance / yr
- $839 – $1,559
Heat risk 4/10 · Minor
- Hot days now (above 102°F)
- 7 days/yr
- Hot days in 30 yrs
- 19 days/yr
Wind risk 2/10 · Minimal
- Chance of severe wind over 30 yrs
- 1.0%
Air-quality risk 3/10 · Minor
- Unhealthy air days now
- 2 days/yr
- Unhealthy air days in 30 yrs
- 3 days/yr
Risk factors via First Street. Map © Google.
Why this score? — see what drove the C grade
The composite is a weighted blend of 9 inputs, each scored 0–100. Each bar is that input's sub-score; the figure is the points it added to the 100-point composite (weight × sub-score).
- Cash flow +18.4/30.0
- ARV discount +15.0/15.0
- DSCR +5.8/10.0
- 1% rule +4.5/10.0
- Livability +4.1/5.0
- Schools +4.0/10.0
- Rent growth +2.5/5.0
- Condition / age +2.5/5.0
- Appreciation +0.0/10.0
$160,000
🖨 Deal sheet 📄 Offer letter ✓ Due diligence
Listing remarks MLS
Welcome to 623 Cleveland Ave in Taylor Mill! This well-located home offers the perfect blend of convenience and comfort, just minutes from I-275 for an easy commute. Featuring 3 bedrooms, 1 full bath, and 1 half bath, this property provides a functional layout with plenty of potential. Enjoy a private, fully fenced backyard--ideal for relaxing, entertaining, or pets. A great opportunity!
Key facts
- Minutes from i-275
- 7,405 sq ft lot
- Parking
Tags
Neighborhood map
What this means for you Summary
Snapshot
- This is a 3-bed/1.0-bath single-family listed at $160k.
Deal economics
- At list price, monthly cash flow is $149 ($2k/yr) — positive.
- The deal already cash-flows at list — no discount required.
- To meet the 1% rule (rent ≥ 1% of price), the offer needs to be $152k (5.1% below list).
- Recommended offer: $152k (5.1% below list) — sets the bar for 1% rule.
Location & tenants
- Location reads 82/100 on livability (#63 in KY, #1,246 nationally) — a professional / high-income tenant draw. Strengths: crime A+, commute A+, employment A+; Watch: amenities F.
- Kenton County (suburban): math 42% / reading 48% proficiency, ranked #14 of 165 in KY (top 8%) — families likely to look elsewhere, expect single-tenant / working-renter base with shorter leases.
- Market conditions: 158 active listings in the ZIP; 6 comparable units currently listed for rent nearby; rentals at typical pace (median 24d on market — plan ~3-4 weeks tenant-placement turnaround); 699 units permitted in Kenton County in 2024 (287 in 5+ unit buildings).
Forward outlook
- Local home prices are declining (-3.0%/yr); year-one equity from $1k of loan paydown is wiped out by about $5k of value loss. Plan a longer hold.
- Kenton County population projected at +5% by 2050 — modest demand growth; plan on rents tracking national, not racing it.
Negotiation context
- It's been on market 54 days — a 3% lower offer ($155k) is reasonable based on typical stale-listing flexibility.
- 11 sale attempts since 23y ago; this cycle's ask has dropped $9k (5%) from the opening price — seller is motivated, your offer sets the floor, not the list.
- Current owner paid $116k; 37% above their basis — modest negotiation headroom, anchor on the comps not their cost.
Questions for the listing agent
- It's been on market 54 days. Have you received any prior offers? Is the seller open to a 5% concession, seller financing, or rate buy-down credit?
- Is there a deadline driving the sale (1031 exchange, divorce, estate, relocation)? That informs how much negotiation room exists.
- What's the average days-on-market for RENTAL listings here right now (not sales)? A rising rental-DOM trend means longer vacancies and softer asking-rent achievability than the comps imply.
- What's the recent tenant-quality profile in this submarket — average credit score on applications, eviction rate, late-payment / NSF rate, and stable-employment percentage? A property-management company in the area should have these aggregated.
- How much new for-sale + rental construction is in the pipeline within 1–3 miles? Heavy new supply typically softens prices + rents 12–24 months out; constrained supply supports both.
Investment metrics
- 1% rule
- 0.95% ✗
- Cap rate
- 7.41%
- Cash-on-cash
- 4.00%
- DSCR
- 1.18
- GRM
- 8.8
CMA / ARV
- ARV (median comp)
- $230,877
- List price
- $160,000
- Delta
- -30.70%
- Verdict
- UNDERPRICED
- Comps
- 20 within 1.0 mi
Show comp detail 12 sales within ~0.75 mi
| Address | Dist | Beds/Ba | Sqft | Sold | Price | $/sf | Match |
|---|---|---|---|---|---|---|---|
| 303 Grand Ave | 0.35mi | 3/1.0 | 1,504 (-1%) | 10mo | $165,000 | $110 | 74 |
| 733 W Grand Ave | 0.36mi | 3/1.5 | 1,493 (-2%) | 15mo | $275,000 | $184 | 66 |
| 4904 Church St | 0.21mi | 3/2.0 | 1,400 (-8%) | 9mo | $250,000 | $179 | 66 |
| 12 N Sunset Pl | 0.52mi | 3/1.5 | 1,494 (-2%) | 9mo | $229,000 | $153 | 64 |
| 18 Doris Dr | 0.49mi | 3/1.5 | 1,440 (-5%) | 5mo | $242,000 | $168 | 63 |
| 4312 Church St | 0.56mi | 3/2.0 | 1,615 (+6%) | 0mo | $226,600 | $140 | 59 |
| 26 Janet Dr | 0.40mi | 3/1.5 | 1,412 (-7%) | 17mo | $220,000 | $156 | 53 |
| 209 Rosedale Ct | 0.58mi | 3/1.0 | 1,630 (+7%) | 13mo | $130,000 | $80 | 50 |
| 4610 Huntington Ave | 0.73mi | 3/1.0 | 1,339 (-12%) | 6mo | $115,000 | $86 | 41 |
| 141 E 42nd St | 0.69mi | 3/2.0 | 1,730 (+14%) | 3mo | $80,000 | $46 | 38 |
| 4344 Decoursey Ave | 0.74mi | 4/2.0 (+1) | 1,700 (+12%) | 4mo | $239,000 | $141 | 33 |
| 569 Mason Rd | 0.74mi | 4/3.0 (+1) | 1,322 (-13%) | 7mo | $247,000 | $187 | 25 |
Match score weights: distance 35% · size 25% · config 20% · recency 20%. Top-matched comps best support the ARV.
Projected returns pro-forma
-3.0% appreciation · 3.0% rent growth · sell at horizon
- IRR
- -10.1%
- Equity multiple
- 0.63×
- Total profit
- $-16,435
- Equity at exit
- $23,857
- IRR
- -0.7%
- Equity multiple
- 0.95×
- Total profit
- $-2,120
- Equity at exit
- $13,834
Cash invested: $44,800 (down + closing). Projections, not guarantees.
Landlord ↔ Tenant lean methodology
- Overall (STATE)
- 83 Strongly Landlord-Friendly
- State Kentucky
- 83 Strongly Landlord-Friendly · R+16
- County
- — inherits STATE
- City
- — inherits STATE
ZIP-level market 41015
- Active inventory
- 158
- Price-to-rent
- 8.8×
Monthly cashflow live
- Estimated rent
- $1,518 high interval (Pro) →
- Mortgage (P&I)
- −$839
- Tax from tax record
- −$144 /mo · $1,730/yr
- Insurance
- −$67
- HOA
- −$0
- Vacancy / Maint / Mgmt
- −$319
- Net cashflow
- $149
Break-even live
UW: 25.0% down · 7.5% · 30yr · 1.5% tax · 5.0% vac · 8.0% maint · 8.0% mgmt
Financing live
Cash to close
- Down payment
- $40,000
- Closing costs
- $4,800
- Reserves months
- —
- Total cash needed
- —
Loan-product check · same deal, 3 products live
Conventional
25% down · 7.5% · 30yr
- Down + closing
- —
- Monthly P&I
- —
- Monthly cashflow
- —
- DSCR
- —
- Eligible?
- —
Personal DTI + credit; lowest rate.
DSCR
20% down · 8.5% · 30yr
- Down + closing
- —
- Monthly P&I
- —
- Monthly cashflow
- —
- DSCR
- —
- Eligible?
- —
No personal income docs; deal must DSCR.
Hard money
10% down · 12.0% · 12mo
- Down + closing
- —
- Monthly P&I
- —
- Monthly cashflow
- —
- DSCR
- —
- Eligible?
- —
Short-term bridge; refi at stabilization.
Rent comps 6 comps
| Address | Beds | Baths | Sqft | Rent | $/sqft | DOM | Units | Dist |
|---|---|---|---|---|---|---|---|---|
| 3918 Glenn Ave Unit 1 Covington, KY | 2.0 | 1.0 | 1350 | $1,449 | $1.07 | 20d | 1 | 0.94mi |
| 5061 Sandman Dr Unit TMA-107 Taylor Mill, KY | 2.0 | 2.0 | 1112 | $1,610 | $1.45 | 43d | 1 | 1.13mi |
| 5061 Old Taylor Mill Rd Unit TMA-013 Taylor Mill, KY | 2.0 | 2.0 | 1112 | $1,400 | $1.26 | 19d | 1 | 1.18mi |
| 5061 Old Taylor Mill Rd Unit TMA-193 Taylor Mill, KY | 2.0 | 2.0 | 1112 | $1,555 | $1.40 | 23d | 1 | 1.18mi |
| 5061 Old Taylor Mill Rd Unit TMA-235 Taylor Mill, KY | 2.0 | 2.0 | 1112 | $1,500 | $1.35 | 23d | 1 | 1.18mi |
| 5061 Old Taylor Mill Rd Unit TMA-064 Taylor Mill, KY | 2.0 | 2.0 | 1112 | $1,625 | $1.46 | 21d | 1 | 1.18mi |
Listing history 35 events
-
2026-06-16status $160,000 Pending 54 DOM
-
2026-06-15days on market $160,000 Active 54 DOM
-
2026-06-13days on market $160,000 Active 52 DOM
-
2026-06-09days on market $160,000 Active 48 DOM
-
2026-06-08days on market $160,000 Active 47 DOM
-
2026-06-07pricedays on market $160,000 Active 46 DOM
-
2026-06-03days on market $169,000 Active 42 DOM
-
2026-06-02days on market $169,000 Active 41 DOM
-
2026-06-01days on market $169,000 Active 40 DOM
-
2026-05-31days on market $169,000 Active 39 DOM
-
2026-04-21$169,000 Active 390-char remark
Show marketing remark (390 chars)
Welcome to 623 Cleveland Ave in Taylor Mill! This well-located home offers the perfect blend of convenience and comfort, just minutes from I-275 for an easy commute. Featuring 3 bedrooms, 1 full bath, and 1 half bath, this property provides a functional layout with plenty of potential. Enjoy a private, fully fenced backyard--ideal for relaxing, entertaining, or pets. A great opportunity!
-
2026-04-21historical
Show marketing remark (390 chars)
Welcome to 623 Cleveland Ave in Taylor Mill! This well-located home offers the perfect blend of convenience and comfort, just minutes from I-275 for an easy commute. Featuring 3 bedrooms, 1 full bath, and 1 half bath, this property provides a functional layout with plenty of potential. Enjoy a private, fully fenced backyard--ideal for relaxing, entertaining, or pets. A great opportunity!
-
2026-03-26$179,000 Active
-
2018-08-06soldstatus $116,500
-
2018-06-25$116,500
-
2015-09-01soldstatus $56,000
-
2015-08-31soldstatus $56,000
-
2015-07-06$69,900
-
2014-11-21soldstatus $15,900
-
2014-06-10$16,000
-
2014-03-31historical
-
2013-12-16$40,000
-
2010-04-06historical
-
2010-01-29$60,000
-
2006-08-10soldstatus $82,500
-
2006-07-31soldstatus $82,500
-
2006-06-14$89,900
-
2005-03-07historical
-
2004-10-20$74,900
-
2004-07-27soldstatus $35,000
-
2004-07-26historical
-
2004-04-02$45,900
-
2003-07-26$72,900
-
1994-02-03soldstatus $51,500
-
1992-05-13soldstatus $15,800
ⓘ Source: listings_history table (triggers on properties + properties_extension) + one-shot
backfill from property_details.listing_events for pre-trigger history.
Tax reassessment forecast KY · Resets to sale price
- Current annual tax
- $1,730 · $144/mo
- Projected year-2 tax
- $1,730 · $144/mo
- Expected delta
- $0/yr ($0/mo · -0.0%)
ⓘ Screening estimate from a state-policy table — verify with the county assessor before closing.
Climate risk First Street
- Flood 1/10 Low FEMA zone X (unshaded) · 0% chance over 30 yrs
- Wildfire 1/10 Low
- Heat 4/10 Moderate 7 d/yr ≥102°F today · 19 d/yr by 30 yrs out
- Wind 2/10 Low 100% chance of damaging wind over 30 yrs
- Air quality 3/10 Moderate 2 unhealthy d/yr today · 3 by 30 yrs out
Nearby sold comps map
Loading sold comps map…
Walkable amenities ~0.75 mi
Loading nearby amenities…
Taxation est. · year 1
- Rental income
- $18,214
- − Mortgage interest
- −$8,962
- − Property taxes
- −$1,730
- − Insurance
- −$800
- − Repairs & maintenance
- −$1,457
- − Management
- −$1,457
- − Depreciation
- −$4,655
- Taxable loss
- −$847
- Est. tax savings @ 24.0%
- +$203
- After-tax cash flow
- $1,994/yr
For passive investors: Depreciation is non-cash, so a rental often shows a tax loss while cash-flowing — sheltering income. Rental losses are passive: they offset passive income freely, and up to $25,000/yr can offset ordinary (W-2) income if you actively participate and your MAGI is under $100k (phasing out to $0 by $150k); unused losses carry forward. On sale, claimed depreciation is recaptured at up to 25%, and gains may owe capital-gains tax (a 1031 exchange can defer both). Figures are a year-1 estimate at your 24.0% rate — not tax advice; consult a CPA.
Schools (NCES district)
- District
- Kenton County
- NCES district ID
- 2103090
- Math proficiency
- 42% ▼ -13.00%
- Reading proficiency
- 48% ▼ -14.00%
- Median HH income
- $66,183
- Composite
- 40.17/100
- National rank
- #3789
- State rank
- #14 of 165 in KY
Livability — Taylor Mill
- Score
- 82/100
- State rank
- #63
- US rank
- #1246
Category grades
Schools grade is shown separately in the Schools card above.
Census & demographics
- Census place
- Taylor Mill, KY
- Population (ZIP)
- 20,396
Population outlook (Kenton County) Hauer SSP2
- Today (2025)
- 174,205 people
- By 2030
- 177,897 · +2.1%
- By 2040
- 182,671 · +4.9%
- By 2050
- 183,543 · +5.4%
- By 2075
- 178,977 · +2.7%
- By 2100
- 159,920 · -8.2%
Race, ethnicity, and origin ACS 2023
- Neighborhood character
- Predominantly White (90%)
- Race & ethnicity
- White 90% Two or more races 6% Black 3% Hispanic / Latino 2%
- Common ancestry
- Lithuanian 2% Romanian 2% Slovak 2%
- Foreign-born
- 2% · Canada
- Languages at home
- 97% English-only · Arabic 1% French/Haitian/Cajun 1%
Political lean MEDSL · Kenton
- 2024 margin
- Strong R (+21.7) · D 38.2% · R 59.9% · Other 1.9%
- 2008→2024 swing
- -0.9pp no change · 2008: -20.9pp · 2024: -21.7pp
- All cycles
- 2024: R+21.7 2020: R+19.3 2016: R+26.1 2012: R+24.3 2008: R+20.9
Not yet ingested
- Civics
- —
Market trends
- HPI YoY
- ▼ -110.37%
- Current HPI
- 203.7263
- Rent YoY
- —
- Metro
- —
- State GDP YoY
- ▲ 1.81%
- F500 in state
- 4
Industry mix (Fortune 500 HQ in KY)
| Industry | F500 HQs | Revenue |
|---|---|---|
| Healthcare | 1 | $118B |
|
||
| Food / Beverage | 1 | $7B |
|
||
Price history
+969.6% since first listed25 events — show timeline
- 2026-04-21 Listing Removed — NKMLS
- 2026-04-21 Listed $169,000 NKMLS
- 2026-03-26 Listed $179,000 NKMLS
- 2018-08-06 Sold (MLS) $116,500 NKMLS
- 2018-06-25 Listed $116,500 NKMLS
- 2015-09-01 Sold (Public Records) $56,000 Public Records
- 2015-08-31 Sold (MLS) $56,000 NKMLS
- 2015-07-06 Listed $69,900 NKMLS
- 2014-11-21 Sold (MLS) $15,900 NKMLS
- 2014-06-10 Listed $16,000 NKMLS
- 2014-03-31 Listing Removed — NKMLS
- 2013-12-16 Listed $40,000 NKMLS
- 2010-04-06 Listing Removed — NKMLS
- 2010-01-29 Listed $60,000 NKMLS
- 2006-08-10 Sold (Public Records) $82,500 Public Records
- 2006-07-31 Sold (MLS) $82,500 NKMLS
- 2006-06-14 Listed $89,900 NKMLS
- 2005-03-07 Listing Removed — NKMLS
- 2004-10-20 Listed $74,900 NKMLS
- 2004-07-27 Sold (MLS) $35,000 NKMLS
- 2004-07-26 Listing Removed — NKMLS
- 2004-04-02 Listed $45,900 NKMLS
- 2003-07-26 Listed $72,900 NKMLS
- 1994-02-03 Sold (Public Records) $51,500 Public Records
- 1992-05-13 Sold (Public Records) $15,800 Public Records
Property tax history
+6.0%/yrLatest (2025): $1,730 · -3.2% YoY. Source: county tax records.
Cash-flow waterfall
monthlySold comps — $/sqft
last 12 mo · ≤1 miLoading sold comps…