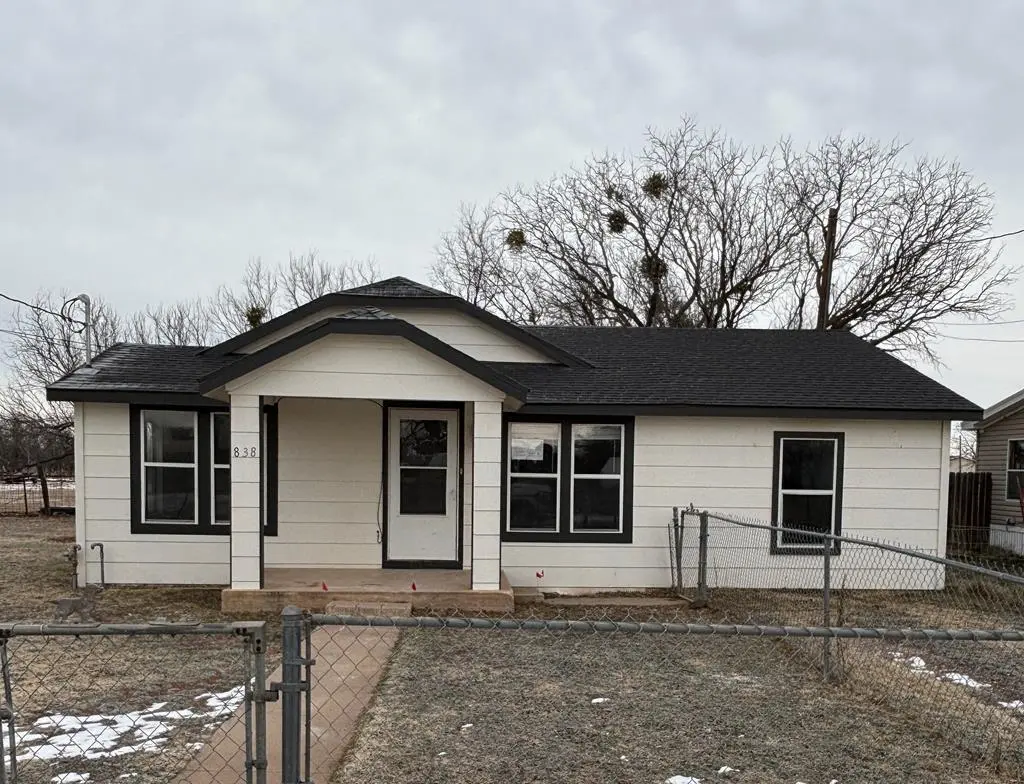
838 Cactus Ln · San Angelo, TX
Flood risk 3/10 · Minor
- FEMA flood zone
- AE
- Chance of flooding over 30 yrs
- 0.12%
- Est. flood insurance / yr
- $1,737 – $8,500
Fire risk 7/10 · Major
- Est. fire insurance / yr
- $1,222 – $2,270
Heat risk 7/10 · Major
- Hot days now (above 104°F)
- 7 days/yr
- Hot days in 30 yrs
- 23 days/yr
Wind risk 4/10 · Minor
- Chance of severe wind over 30 yrs
- 18.0%
Air-quality risk 1/10 · Minimal
- Unhealthy air days now
- 0 days/yr
- Unhealthy air days in 30 yrs
- 0 days/yr
Risk factors via First Street. Map © Google.
Why this score? — see what drove the B grade
The composite is a weighted blend of 9 inputs, each scored 0–100. Each bar is that input's sub-score; the figure is the points it added to the 100-point composite (weight × sub-score).
- Cash flow +30.0/30.0
- DSCR +10.0/10.0
- 1% rule +9.9/10.0
- ARV discount +7.5/15.0
- Rent growth +4.6/5.0
- Livability +3.7/5.0
- Schools +2.6/10.0
- Condition / age +2.5/5.0
- Appreciation +0.0/10.0
$97,500
🖨 Deal sheet 📄 Offer letter ✓ Due diligence
Listing remarks MLS
This HUD Home is in a quiet neighborhood just outside city limits. Roof Flooring and HVAC were updated in 2024. This home has a comfortable and inviting atmosphere. For more information, please see HUD Homestore. gov Current Disposition: IE Repair Escrow: $1.00
Key facts
- Hvac updated
- 8,929 sq ft lot
- Built 1973
Tags
Neighborhood map
What this means for you Summary
Snapshot
- This is a 3-bed/2.0-bath single-family listed at $98k.
Deal economics
- At list price, monthly cash flow is $22 ($269/yr) — positive.
- The deal already cash-flows at list — no discount required.
- Meets the 1% rule at list price ($1k rent vs $98k).
- Recommended offer: $89k (9.0% below list) — sets the bar for market timing.
- Cap rate 11.8% vs local median 3.8% in San Angelo — top-decile yield for the area; either an underpriced asset or a hidden risk that comps aren't pricing in. Stress-test before assuming the spread holds.
Location & tenants
- Location reads 73/100 on livability (#199 in TX) — a middle-class / working-renter tenant base. Strengths: cost of living A+, housing A+, health & safety A+; Watch: employment C-, schools F, amenities F.
- San Angelo ISD (urban): math 27% / reading 33% proficiency, ranked #627 of 826 in TX (top 76%) — families likely to look elsewhere, expect single-tenant / working-renter base with shorter leases.
- Market conditions: Rents rising fast (+8.5%/yr); 227 active listings in the ZIP; 1 comparable units currently listed for rent nearby; 233 units permitted in Tom Green County in 2024 (0 in 5+ unit buildings).
- This rent runs 35% of the median local income ($49k/yr) — at the standard rent-burdened threshold; future hikes will face affordability resistance.
Forward outlook
- Local home prices are declining (-3.0%/yr); year-one equity from $674 of loan paydown is wiped out by about $3k of value loss. Plan a longer hold.
- Tom Green County population projected at +35% by 2050 — long-run rental-demand tailwind backs the buy-and-hold thesis.
- At projected returns (-3.0% appreciation + 8.0% rent growth), your $27k cash investment doubles in ~9 years — after that, you're playing with house money.
Negotiation context
- It's been on market 120 days — a 9% lower offer ($89k) is reasonable based on typical stale-listing flexibility.
- 2 sale attempts since 3y ago; this cycle's ask has dropped $66k (40%) from the opening price — seller is motivated, your offer sets the floor, not the list.
Risks & watch-outs
- Watch-outs: flood insurance adds $427/mo.
- Climate carrying-cost: in FEMA flood zone AE (mandatory federal flood insurance); major wildfire risk; extreme-heat days projected 7→23/yr by 2055 (HVAC capex compounding) — expect insurance premiums to compound above CPI over the hold.
Questions for the listing agent
- It's been on market 120 days. Have you received any prior offers? Is the seller open to a 9% concession, seller financing, or rate buy-down credit?
- Built in 1973 — when were the roof, HVAC, electrical panel, plumbing, and water heater last replaced?
- What's the actual annual flood-insurance premium (NFIP or private), and is the property in a SFHA with mandatory coverage?
- Why hasn't it sold? Are there any deal-killer items the seller is aware of (foundation, flood, title, zoning, code violations)?
- Is there a deadline driving the sale (1031 exchange, divorce, estate, relocation)? That informs how much negotiation room exists.
- Schools are F-rated, which usually means shorter tenancies and higher turnover. Who's the typical renter profile here, and what's been the actual vacancy rate?
- What's the average days-on-market for RENTAL listings here right now (not sales)? A rising rental-DOM trend means longer vacancies and softer asking-rent achievability than the comps imply.
- What's the recent tenant-quality profile in this submarket — average credit score on applications, eviction rate, late-payment / NSF rate, and stable-employment percentage? A property-management company in the area should have these aggregated.
- How much new for-sale + rental construction is in the pipeline within 1–3 miles? Heavy new supply typically softens prices + rents 12–24 months out; constrained supply supports both.
Investment metrics
- 1% rule
- 1.49% ✓
- Cap rate
- 11.82%
- Cash-on-cash
- 19.73%
- DSCR
- 1.88
- GRM
- 5.6
CMA / ARV
- ARV (median comp)
- $238,491
- List price
- $97,500
- Delta
- -59.12%
- Verdict
- UNDERPRICED
- Comps
- 20 within 1.0 mi
Projected returns pro-forma
-3.0% appreciation · 8.0% rent growth · sell at horizon
- IRR
- -5.8%
- Equity multiple
- 0.77×
- Total profit
- $-6,393
- Equity at exit
- $14,538
- IRR
- 11.3%
- Equity multiple
- 2.19×
- Total profit
- $32,438
- Equity at exit
- $8,430
Cash invested: $27,300 (down + closing). Projections, not guarantees.
Landlord ↔ Tenant lean methodology
- Overall (STATE)
- 87 Strongly Landlord-Friendly
- State Texas
- 87 Strongly Landlord-Friendly · R+5
- County
- — inherits STATE
- City
- — inherits STATE
ZIP-level market 76903
- Rents YoY
- 8.5%
- Active inventory
- 227
- Price-to-rent
- 5.6×
Monthly cashflow live
- Estimated rent
- $1,453 medium interval (Pro) →
- Mortgage (P&I)
- −$511
- Tax from tax record
- −$147 /mo · $1,764/yr
- Insurance
- −$41
- Flood insurance flood zone
- −$427 /mo · $5,118/yr
- HOA
- −$0
- Vacancy / Maint / Mgmt
- −$305
- Net cashflow
- $22
Break-even live
UW: 25.0% down · 7.5% · 30yr · 1.5% tax · 5.0% vac · 8.0% maint · 8.0% mgmt
Financing live
Cash to close
- Down payment
- $24,375
- Closing costs
- $2,925
- Reserves months
- —
- Total cash needed
- —
Loan-product check · same deal, 3 products live
Conventional
25% down · 7.5% · 30yr
- Down + closing
- —
- Monthly P&I
- —
- Monthly cashflow
- —
- DSCR
- —
- Eligible?
- —
Personal DTI + credit; lowest rate.
DSCR
20% down · 8.5% · 30yr
- Down + closing
- —
- Monthly P&I
- —
- Monthly cashflow
- —
- DSCR
- —
- Eligible?
- —
No personal income docs; deal must DSCR.
Hard money
10% down · 12.0% · 12mo
- Down + closing
- —
- Monthly P&I
- —
- Monthly cashflow
- —
- DSCR
- —
- Eligible?
- —
Short-term bridge; refi at stabilization.
Rent comps 1 comps
| Address | Beds | Baths | Sqft | Rent | $/sqft | DOM | Units | Dist |
|---|---|---|---|---|---|---|---|---|
| 31 Cinnamon Ln San Angelo, TX | 3.0 | 2.0 | 1056 | $1,275 | $1.21 | 43d | 1 | 1.30mi |
Listing history 9 events
-
2026-05-01price $97,500 261-char remark
Show marketing remark (261 chars)
This HUD Home is in a quiet neighborhood just outside city limits. Roof Flooring and HVAC were updated in 2024. This home has a comfortable and inviting atmosphere. For more information, please see HUD Homestore. gov Current Disposition: IE Repair Escrow: $1.00
-
2026-04-03price $107,000 261-char remark
Show marketing remark (261 chars)
This HUD Home is in a quiet neighborhood just outside city limits. Roof Flooring and HVAC were updated in 2024. This home has a comfortable and inviting atmosphere. For more information, please see HUD Homestore. gov Current Disposition: IE Repair Escrow: $1.00
-
2026-03-21price $118,000 261-char remark
Show marketing remark (261 chars)
This HUD Home is in a quiet neighborhood just outside city limits. Roof Flooring and HVAC were updated in 2024. This home has a comfortable and inviting atmosphere. For more information, please see HUD Homestore. gov Current Disposition: IE Repair Escrow: $1.00
-
2026-03-17price $130,400 261-char remark
Show marketing remark (261 chars)
This HUD Home is in a quiet neighborhood just outside city limits. Roof Flooring and HVAC were updated in 2024. This home has a comfortable and inviting atmosphere. For more information, please see HUD Homestore. gov Current Disposition: IE Repair Escrow: $1.00
-
2026-01-29$163,000 Active 261-char remark
Show marketing remark (261 chars)
This HUD Home is in a quiet neighborhood just outside city limits. Roof Flooring and HVAC were updated in 2024. This home has a comfortable and inviting atmosphere. For more information, please see HUD Homestore. gov Current Disposition: IE Repair Escrow: $1.00
-
2024-02-29soldstatus
-
2024-02-28soldstatus Closed 509-char remark
Show marketing remark (509 chars)
Ready to find your new home sweet home? This 3 bedroom 2 bath home combines modern sophistication with classic charm beautifully updated with fresh paint, new roof, flooring, fixtures, HVAC, and updated bathrooms. As you step into this home, you will be greeted by a comfortable fresh & inviting atmosphere. The split bedroom design adds privacy to the master suite. This home is nestled in a quiet charming neighborhood just outside the city limits. It is move-in ready. Contact us for a showing today!
-
2023-12-08$168,500 Active 509-char remark
Show marketing remark (509 chars)
Ready to find your new home sweet home? This 3 bedroom 2 bath home combines modern sophistication with classic charm beautifully updated with fresh paint, new roof, flooring, fixtures, HVAC, and updated bathrooms. As you step into this home, you will be greeted by a comfortable fresh & inviting atmosphere. The split bedroom design adds privacy to the master suite. This home is nestled in a quiet charming neighborhood just outside the city limits. It is move-in ready. Contact us for a showing today!
-
2023-08-09soldstatus
ⓘ Source: listings_history table (triggers on properties + properties_extension) + one-shot
backfill from property_details.listing_events for pre-trigger history.
Tax reassessment forecast TX · Resets to sale price
- Current annual tax
- $1,764 · $147/mo
- Projected year-2 tax
- $1,784 · $149/mo
- Expected delta
- +$20/yr (+$2/mo · 1.2%)
ⓘ Screening estimate from a state-policy table — verify with the county assessor before closing.
Climate risk First Street
- Flood 3/10 Moderate FEMA zone AE · 12% chance over 30 yrs
- Wildfire 7/10 Severe
- Heat 7/10 Severe 7 d/yr ≥104°F today · 23 d/yr by 30 yrs out
- Wind 4/10 Moderate 18% chance of damaging wind over 30 yrs
- Air quality 1/10 Low 0 unhealthy d/yr today · 0 by 30 yrs out
Nearby sold comps map
Loading sold comps map…
Walkable amenities ~0.75 mi
Loading nearby amenities…
Taxation est. · year 1
- Rental income
- $17,436
- − Mortgage interest
- −$5,462
- − Property taxes
- −$1,764
- − Insurance
- −$5,606
- − Repairs & maintenance
- −$1,395
- − Management
- −$1,395
- − Depreciation
- −$2,836
- Taxable loss
- −$1,021
- Est. tax savings @ 24.0%
- +$245
- After-tax cash flow
- $514/yr
For passive investors: Depreciation is non-cash, so a rental often shows a tax loss while cash-flowing — sheltering income. Rental losses are passive: they offset passive income freely, and up to $25,000/yr can offset ordinary (W-2) income if you actively participate and your MAGI is under $100k (phasing out to $0 by $150k); unused losses carry forward. On sale, claimed depreciation is recaptured at up to 25%, and gains may owe capital-gains tax (a 1031 exchange can defer both). Figures are a year-1 estimate at your 24.0% rate — not tax advice; consult a CPA.
Schools (NCES district)
- District
- San Angelo ISD
- NCES district ID
- 4838700
- Math proficiency
- 27% ▼ -9.00%
- Reading proficiency
- 33% ▼ -3.00%
- Median HH income
- $43,501
- Composite
- 25.56/100
- National rank
- #7427
- State rank
- #627 of 826 in TX
Livability — San Angelo
- Score
- 73/100
- State rank
- #199
- US rank
- #5030
Category grades
Schools grade is shown separately in the Schools card above.
Census & demographics
- County
- Tom Green County · 113,188 people
- City population
- 81,357
- Metro
- San Angelo, TX
- Population (ZIP)
- 29,947
- Household income
- $49,498
- Rent vs Own
- Severe rent burden
- 1255.0
Population outlook (Tom Green County) Hauer SSP2
- Today (2025)
- 135,110 people
- By 2030
- 144,090 · +6.6%
- By 2040
- 162,561 · +20.3%
- By 2050
- 182,158 · +34.8%
- By 2075
- 232,274 · +71.9%
- By 2100
- 268,218 · +98.5%
Race, ethnicity, and origin ACS 2023
- Neighborhood character
- Diverse neighborhood (Simpson 0.56)
- Race & ethnicity
- Hispanic / Latino 56% White 36% Two or more races 26% Black 5%
- Hispanic origin (detail)
- Mexican 49% Puerto Rican 1%
- Common ancestry
- Italian 1% Serbian 1% Slovak 1%
- Foreign-born
- 10% · Canada
- Languages at home
- 66% English-only · Spanish 33%
Political lean MEDSL · Tom Green
- 2024 margin
- Solid R (+48.0) · D 25.5% · R 73.5% · Other 1.0%
- 2008→2024 swing
- -6.3pp toward R · 2008: -41.7pp · 2024: -48.0pp
- All cycles
- 2024: R+48.0 2020: R+44.4 2016: R+47.9 2012: R+47.9 2008: R+41.7
Not yet ingested
- Civics
- —
Market trends
- HPI YoY
- ▼ -164.90%
- Current HPI
- 217.0406
- Rent YoY
- ▲ 8.46%
- Metro
- San Angelo, TX
- State GDP YoY
- ▲ 3.95%
- F500 in state
- 110
Industry mix (Fortune 500 HQ in TX)
| Industry | F500 HQs | Revenue |
|---|---|---|
| Energy | 16 | $1,198B |
|
||
| Technology | 5 | $198B |
|
||
| Engineering / Construction | 4 | $72B |
|
||
| Energy Services | 3 | $60B |
|
||
| Utilities | 3 | $41B |
|
||
| Healthcare | 2 | $330B |
|
||
Price history
-42.1% since first listed9 events — show timeline
- 2026-05-01 Price Changed $97,500 SAAR TX
- 2026-04-03 Price Changed $107,000 SAAR TX
- 2026-03-21 Price Changed $118,000 SAAR TX
- 2026-03-17 Price Changed $130,400 SAAR TX
- 2026-01-29 Listed $163,000 SAAR TX
- 2024-02-29 Sold (Public Records) — Public Records
- 2024-02-28 Sold (MLS) — SAAR TX
- 2023-12-08 Listed $168,500 SAAR TX
- 2023-08-09 Sold (Public Records) — Public Records
Property tax history
+13.3%/yrLatest (2025): $1,764 · +38.4% YoY. Source: county tax records.
Cash-flow waterfall
monthlySold comps — $/sqft
last 12 mo · ≤1 miLoading sold comps…