244 CR 5331 · Marietta, MS
Flood risk 1/10 · Minimal
- FEMA flood zone
- X (unshaded)
- Chance of flooding over 30 yrs
- 0.0%
- Est. flood insurance / yr
- $507 – $1,088
Fire risk 6/10 · Moderate
- Est. fire insurance / yr
- $1,241 – $2,305
Heat risk 6/10 · Moderate
- Hot days now (above 108°F)
- 7 days/yr
- Hot days in 30 yrs
- 20 days/yr
Wind risk 5/10 · Moderate
- Chance of severe wind over 30 yrs
- 23.0%
Air-quality risk 1/10 · Minimal
- Unhealthy air days now
- 0 days/yr
- Unhealthy air days in 30 yrs
- 0 days/yr
Risk factors via First Street. Map © Google.
Why this score? — see what drove the D grade
The composite is a weighted blend of 9 inputs, each scored 0–100. Each bar is that input's sub-score; the figure is the points it added to the 100-point composite (weight × sub-score).
- Cash flow +10.6/30.0
- ARV discount +7.5/15.0
- Appreciation +6.9/10.0
- Schools +3.2/10.0
- Livability +3.2/5.0
- DSCR +3.1/10.0
- Rent growth +2.5/5.0
- Condition / age +2.5/5.0
- 1% rule +1.9/10.0
$155,000
🖨 Deal sheet (PDF) 📄 Offer letter ✓ Due diligence
Listing remarks MLS
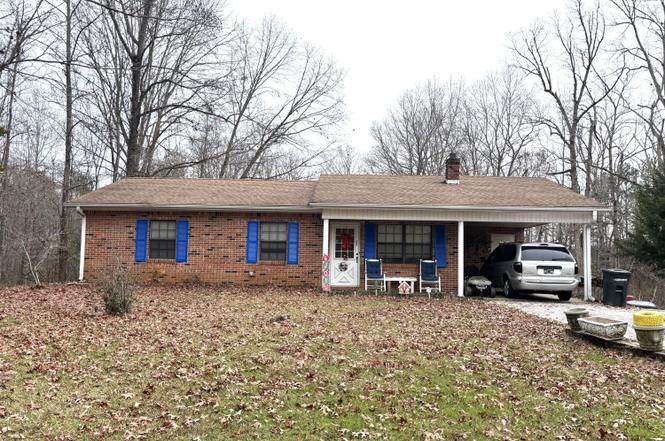
3 bedrooms, 1 bathroom in Prentiss County! Situated on 2.4 +/- acres, this is your chance to own your slice of paradise! Love to garden or spend time fishing? This property is the one for YOU! Featuring a mature garden and a pond as well as a storage shed AND a covered outdoor space! All information deemed reliable but subject to verification. Call for your appointment today!
Key facts
- Country living
- Large yard
- 2.4 acres
Tags
Property features AI
Exterior
- Home design: Single-family residence; Traditional style; Single-story
- Construction: Brick construction; Slab foundation
- Exterior features: 2.4-acre lot
Interior
- Kitchen: Range; Refrigerator
- Bathrooms: 1 full bathroom
- Heating & cooling: Central heating (natural gas); Central air conditioning
- Interior features: Range; Refrigerator; Electric water heater; Total of 5 rooms
- Laundry & utility: Electric water heater
Neighborhood map
What this means for you Summary
Snapshot
- This is a 3-bed/1.0-bath single-family listed at $155k.
Deal economics
- At list price, monthly cash flow is $-76 ($-915/yr) — negative.
- To cash-flow at today's rent, offer at most $142k (8.7% below list).
- To meet the 1% rule (rent ≥ 1% of price), the offer needs to be $106k (31.5% below list).
- Recommended offer: $106k (31.5% below list) — sets the bar for 1% rule.
Location & tenants
- Location reads 65/100 on livability (#108 in MS) — a middle-class / working-renter tenant base. Strengths: cost of living A+, housing A+; Watch: employment D+, amenities F, commute F.
- Prentiss County School District (rural): math 38% / reading 39% proficiency, ranked #44 of 130 in MS (top 34%) — families likely to look elsewhere, expect single-tenant / working-renter base with shorter leases.
- Zoned schools: Hills Chapel School (math 33% / reading 44%, grade F, #130 of 375 statewide, top 35%, 424 students, 99% FRL); New Site High School (math 57% / reading 52%, grade C-, #10 of 197 statewide, top 5%, 254 students, 99% FRL) — zoned schools average 99% FRL vs 59% district-wide (40 pts higher); higher-poverty schools than district average — tighter screening recommended.
- Market conditions: 60 active listings in the ZIP; 11 units permitted in Prentiss County in 2024 (0 in 5+ unit buildings).
Forward outlook
- In year one you build about $7k of equity ($1k loan paydown + $6k appreciation (3.8% local appreciation)).
- Prentiss County population projected to shrink 6% by 2050 — rents likely to lag national; underwrite the cash flow, not the appreciation.
- At projected returns (3.8% appreciation + 3.0% rent growth), your $43k cash investment doubles in ~6 years — after that, you're playing with house money.
- By year 6, paydown + projected appreciation supports a ~$37k cash-out refi (75% LTV) — recoverable capital for the next deal without selling this one.
Negotiation context
- It's been on market 142 days — a 12% lower offer ($136k) is reasonable based on typical stale-listing flexibility.
- 2 sale attempts since 3y ago with the ask held roughly flat each time — persistent listings suggest the price (not the market) is what's stuck; bring a comps-based counter.
Risks & watch-outs
- Climate carrying-cost: moderate wind risk, 23% chance of damaging wind over 30y; major wildfire risk; extreme-heat days projected 7→20/yr by 2055 (HVAC capex compounding) — expect insurance premiums to compound above CPI over the hold.
Questions for the listing agent
- What do current leases actually rent for vs. the listed asking? Can we see a recent rent roll and the last 12 months of T-12 income?
- It's been on market 142 days. Have you received any prior offers? Is the seller open to a 31% concession, seller financing, or rate buy-down credit?
- Built in 1979 — when were the roof, HVAC, electrical panel, plumbing, and water heater last replaced?
- Why hasn't it sold? Are there any deal-killer items the seller is aware of (foundation, flood, title, zoning, code violations)?
- Is there a deadline driving the sale (1031 exchange, divorce, estate, relocation)? That informs how much negotiation room exists.
- Schools are B-rated — typically a magnet for longer-tenancy family renters. What's the average tenant stay here, and is there a school-zone premium baked into asking?
- The area grade is low — what's the realistic commute time and amenity access for the typical tenant pool here? Any planned neighborhood developments (good or bad) we should know about?
- What's the average days-on-market for RENTAL listings here right now (not sales)? A rising rental-DOM trend means longer vacancies and softer asking-rent achievability than the comps imply.
- What's the recent tenant-quality profile in this submarket — average credit score on applications, eviction rate, late-payment / NSF rate, and stable-employment percentage? A property-management company in the area should have these aggregated.
- How much new for-sale + rental construction is in the pipeline within 1–3 miles? Heavy new supply typically softens prices + rents 12–24 months out; constrained supply supports both.
Investment metrics
- 1% rule
- 0.69% ✗
- Cap rate
- 5.70%
- Cash-on-cash
- -2.11%
- DSCR
- 0.91
- GRM
- 12.2
CMA / ARV
No comps found within radius.
Projected returns pro-forma
3.75% appreciation · 3.0% rent growth · sell at horizon
- IRR
- 7.7%
- Equity multiple
- 1.46×
- Total profit
- $19,948
- Equity at exit
- $76,300
- IRR
- 10.0%
- Equity multiple
- 2.62×
- Total profit
- $70,286
- Equity at exit
- $123,005
Cash invested: $43,400 (down + closing). Projections, not guarantees.
Landlord ↔ Tenant lean methodology
- Overall (STATE)
- 90 Strongly Landlord-Friendly
- State Mississippi
- 90 Strongly Landlord-Friendly · R+11
- County
- — inherits STATE
- City
- — inherits STATE
ZIP-level market 38824
- Home prices YoY
- 2.4%
- Active inventory
- 60
- Price-to-rent
- 12.2×
Monthly cashflow live
- Estimated rent
- $1,062 medium interval (Pro) →
- Mortgage (P&I)
- −$813
- Tax from tax record
- −$38 /mo · $457/yr
- Insurance
- −$65
- HOA
- −$0
- Vacancy / Maint / Mgmt
- −$223
- Net cashflow
- $-76
Break-even live
Sensitivity live
| Price | -10% $12 | -5% $-32 | +0% $-76 | +5% $-120 | +10% $-164 |
|---|---|---|---|---|---|
| Rent | -10% $-160 | -5% $-118 | +0% $-76 | +5% $-34 | +10% $8 |
| Rate | -1.0pp $2 | -0.5pp $-37 | base $-76 | +0.5pp $-116 | +1.0pp $-157 |
UW: 25.0% down · 7.5% · 30yr · 1.5% tax · 5.0% vac · 8.0% maint · 8.0% mgmt
Financing live
Cash to close
- Down payment
- $38,750
- Closing costs
- $4,650
- Reserves months
- —
- Total cash needed
- —
Loan-product check · same deal, 3 products live
Conventional
25% down · 7.5% · 30yr
- Down + closing
- —
- Monthly P&I
- —
- Monthly cashflow
- —
- DSCR
- —
- Eligible?
- —
Personal DTI + credit; lowest rate.
DSCR
20% down · 8.5% · 30yr
- Down + closing
- —
- Monthly P&I
- —
- Monthly cashflow
- —
- DSCR
- —
- Eligible?
- —
No personal income docs; deal must DSCR.
Hard money
10% down · 12.0% · 12mo
- Down + closing
- —
- Monthly P&I
- —
- Monthly cashflow
- —
- DSCR
- —
- Eligible?
- —
Short-term bridge; refi at stabilization.
Listing history 2 events
-
2026-06-01remarks 452-char remark
-
2026-06-01$155,000 Pending 142 DOM
ⓘ Source: listings_history table (triggers on properties + properties_extension) + one-shot
backfill from property_details.listing_events for pre-trigger history.
Tax reassessment forecast MS · Resets to sale price
- Current annual tax
- $457 · $38/mo
- Projected year-2 tax
- $1,225 · $102/mo
- Expected delta
- +$767/yr (+$64/mo · 167.7%)
ⓘ Screening estimate from a state-policy table — verify with the county assessor before closing.
Climate risk First Street
- Flood 1/10 Low FEMA zone X (unshaded) · 0% chance over 30 yrs
- Wildfire 6/10 Major
- Heat 6/10 Major 7 d/yr ≥108°F today · 20 d/yr by 30 yrs out
- Wind 5/10 Major 23% chance of damaging wind over 30 yrs
- Air quality 1/10 Low 0 unhealthy d/yr today · 0 by 30 yrs out
Nearby sold comps map
Loading sold comps map…
Walkable amenities ~0.75 mi
Loading nearby amenities…
Taxation est. · year 1
- Rental income
- $12,749
- − Mortgage interest
- −$8,682
- − Property taxes
- −$457
- − Insurance
- −$775
- − Repairs & maintenance
- −$1,020
- − Management
- −$1,020
- − Depreciation
- −$4,509
- Taxable loss
- −$3,715
- Est. tax savings @ 24.0%
- +$891
- After-tax cash flow
- $-23/yr
For passive investors: Depreciation is non-cash, so a rental often shows a tax loss while cash-flowing — sheltering income. Rental losses are passive: they offset passive income freely, and up to $25,000/yr can offset ordinary (W-2) income if you actively participate and your MAGI is under $100k (phasing out to $0 by $150k); unused losses carry forward. On sale, claimed depreciation is recaptured at up to 25%, and gains may owe capital-gains tax (a 1031 exchange can defer both). Figures are a year-1 estimate at your 24.0% rate — not tax advice; consult a CPA.
Schools (NCES district)
- District
- Prentiss County School District
- NCES district ID
- 2803750
- Math proficiency
- 38% ▼ -19.00%
- Reading proficiency
- 39% ▼ -14.00%
- Median HH income
- $36,980
- Composite
- 32.01/100
- National rank
- #5829
- State rank
- #44 of 130 in MS
Livability — Marietta
- Score
- 65/100
- State rank
- #108
- US rank
- #12598
Category grades
Schools grade is shown separately in the Schools card above.
Census & demographics
- Population (ZIP)
- 7,900
Population outlook (Prentiss County) Hauer SSP2
- Today (2025)
- 25,348 people
- By 2030
- 25,247 · -0.4%
- By 2040
- 24,786 · -2.2%
- By 2050
- 23,851 · -5.9%
- By 2075
- 20,434 · -19.4%
- By 2100
- 15,359 · -39.4%
Race, ethnicity, and origin ACS 2023
- Neighborhood character
- Predominantly White (70%)
- Race & ethnicity
- White 70% Black 20% Two or more races 6% Hispanic / Latino 2% Asian 1%
- Common ancestry
- Iranian 1% Slovak 1%
- Foreign-born
- 2% · China
- Languages at home
- 94% English-only · Chinese 3% Other Indo-European 1% German/W. Germanic 1%
Political lean MEDSL · Prentiss
- 2024 margin
- Solid R (+66.0) · D 16.6% · R 82.7%
- 2008→2024 swing
- -23.2pp toward R · 2008: -42.8pp · 2024: -66.0pp
- All cycles
- 2024: R+66.0 2020: R+58.3 2016: R+56.5 2012: R+42.4 2008: R+42.8
Not yet ingested
- Civics
- —
Market trends
- HPI YoY
- ▲ 3.75%
- Current HPI
- 159.5191
- Rent YoY
- —
- Metro
- —
- State GDP YoY
- —
- F500 in state
- 0
Price history
+3.3% since first listed5 events — show timeline
- 2026-06-01 Pending — NEMSBD
- 2025-12-29 Price Changed $155,000 NEMSBD
- 2025-12-10 Listed $160,000 NEMSBD
- 2023-10-05 Sold (MLS) — NEMSBD
- 2023-07-13 Listed $150,000 NEMSBD
Property tax history
+0.0%/yrLatest (2025): $457 · +0.0% YoY. Source: county tax records.
Cash-flow waterfall
monthlySold comps — $/sqft
last 12 mo · ≤1 miLoading sold comps…