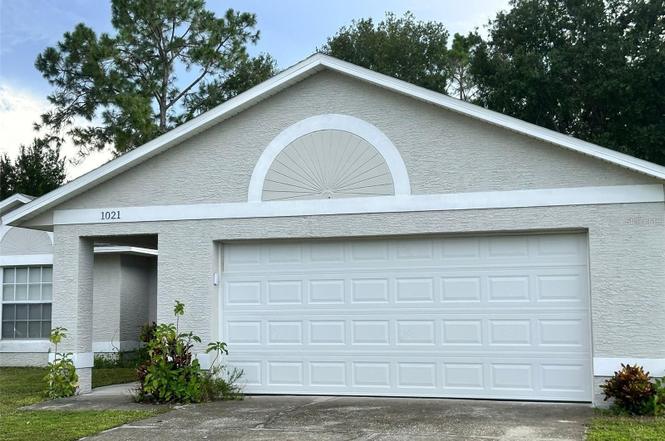
1021 Embrun Ct · Poinciana, FL
Flood risk 1/10 · Minimal
- FEMA flood zone
- AE
- Chance of flooding over 30 yrs
- 0.0%
- Est. flood insurance / yr
- $1,737 – $8,500
Fire risk 4/10 · Minor
- Est. fire insurance / yr
- $947 – $1,759
Heat risk 8/10 · Major
- Hot days now (above 108°F)
- 7 days/yr
- Hot days in 30 yrs
- 23 days/yr
Wind risk 9/10 · Severe
- Chance of severe wind over 30 yrs
- 99.0%
Air-quality risk 1/10 · Minimal
- Unhealthy air days now
- 0 days/yr
- Unhealthy air days in 30 yrs
- 0 days/yr
Risk factors via First Street. Map © Google.
Why this score? — see what drove the D+ grade
The composite is a weighted blend of 9 inputs, each scored 0–100. Each bar is that input's sub-score; the figure is the points it added to the 100-point composite (weight × sub-score).
- ARV discount +15.0/15.0
- Cash flow +11.2/30.0
- Appreciation +4.3/10.0
- 1% rule +3.7/10.0
- Schools +3.6/10.0
- DSCR +3.3/10.0
- Livability +2.9/5.0
- Rent growth +2.8/5.0
- Condition / age +2.5/5.0
$220,000
🖨 Deal sheet 📄 Offer letter ✓ Due diligence
Listing remarks MLS
One or more photo(s) has been virtually staged. Come see this charming home now on the market! This kitchen is ready for cooking with ample counter space and cabinets for storage. Entertaining is a breeze with this great floor plan complete with light fixtures and windows for natural lighting. The main bedroom and bathroom give you the perfect space for everyday living. Relax with your favorite drink in the backyard with a patio perfect for barbecues, and lush grass that surrounds the home. Don't miss this incredible opportunity.
Key facts
- Large windows
- Spacious lot
- Expansive backyard
Tags
Property features AI
Finance
- Other: Homestead exempt; Zoned OPUD
- Financial info: Lease restrictions apply
- HOA & community: Poinciana Association; Monthly HOA fee of $100 (required); Pets allowed
Exterior
- Parking: Attached garage; 2-car garage
- Utilities: Public water; Public sewer; Public utilities; Asphalt road access
- Home design: Single-family residence; One story; Faces north
- Construction: Block, concrete and stucco construction; Shingle roof; Block foundation; Built on 1/4 to less than 1/2 acre lot
- Exterior features: Other exterior features
Interior
- Kitchen: Range; Refrigerator
- Bedrooms: 3 bedrooms
- Flooring: Carpet; Ceramic tile
- Bathrooms: 2 full bathrooms
- Heating & cooling: Central heating; Central air conditioning
- Interior features: Ceiling fans
- Laundry & utility: Washer; Dryer; Laundry area in garage
Neighborhood map
What this means for you Summary
Snapshot
- This is a 3-bed/2.0-bath single-family listed at $220k.
Deal economics
- At list price, monthly cash flow is $-511 ($-6k/yr) — negative.
- To cash-flow at today's rent, offer at most $130k (41.0% below list).
- To meet the 1% rule (rent ≥ 1% of price), the offer needs to be $191k (13.2% below list).
- Recommended offer: $130k (41.0% below list) — sets the bar for cash-flow.
- Cap rate 5.8% vs local median 4.3% in Poinciana — top-decile yield for the area; either an underpriced asset or a hidden risk that comps aren't pricing in. Stress-test before assuming the spread holds.
Location & tenants
- Location reads 57/100 on livability (#859 in FL) — a working-class tenant base; expect higher turnover. Strengths: cost of living A+, housing A+; Watch: employment D+, amenities F, commute F.
- Osceola (suburban): math 39% / reading 45% proficiency, ranked #60 of 73 in FL (top 82%) — families likely to look elsewhere, expect single-tenant / working-renter base with shorter leases; 60% free/reduced lunch — lower-income household profile, screen leases tightly.
- Zoned schools: Chestnut Elementary School For Science And Engineering (math 35% / reading 41%, grade F, #1,587 of 2,144 statewide, top 74%, 736 students, 62% FRL); Liberty High School (math 15% / reading 25%, grade F, #554 of 667 statewide, top 84%, 1,613 students, 52% FRL) — zoned schools at 57% FRL track the district average.
- Zoned-school proficiency averages 29% at this address vs 42% district-wide (-13 pts) — the specific schools serving this property underperform the Osceola average; the district grade overstates school quality for this exact location.
- Market conditions: Rents rising (+1.1%/yr); 1151 active listings in the ZIP; 40 comparable units currently listed for rent nearby; rentals at typical pace (median 22d on market — plan ~3-4 weeks tenant-placement turnaround); 8,813 units permitted in Osceola County in 2024 (3,072 in 5+ unit buildings).
- This rent runs 33% of the median local income ($69k/yr) — at the standard rent-burdened threshold; future hikes will face affordability resistance.
Forward outlook
- Local home prices are declining (-1.5%/yr); year-one equity from $2k of loan paydown is wiped out by about $3k of value loss. Plan a longer hold.
- Osceola County population projected at +73% by 2050 — long-run rental-demand tailwind backs the buy-and-hold thesis.
Negotiation context
- Only 1 days on market — expect competitive offers; lowballing is unlikely to land.
- 5 sale attempts since 4y ago with the ask held roughly flat each time — persistent listings suggest the price (not the market) is what's stuck; bring a comps-based counter.
Risks & watch-outs
- Watch-outs: flood insurance adds $427/mo.
- Climate carrying-cost: in FEMA flood zone AE (mandatory federal flood insurance); severe wind risk, 99% chance of damaging wind over 30y; extreme-heat days projected 7→23/yr by 2055 (HVAC capex compounding) — expect insurance premiums to compound above CPI over the hold.
Questions for the listing agent
- What do current leases actually rent for vs. the listed asking? Can we see a recent rent roll and the last 12 months of T-12 income?
- What's the actual annual flood-insurance premium (NFIP or private), and is the property in a SFHA with mandatory coverage?
- What does the HOA fee cover, when was the last increase, and are there any pending special assessments or reserve-fund shortfalls?
- Is there a deadline driving the sale (1031 exchange, divorce, estate, relocation)? That informs how much negotiation room exists.
- Schools are F-rated, which usually means shorter tenancies and higher turnover. Who's the typical renter profile here, and what's been the actual vacancy rate?
- The area grade is low — what's the realistic commute time and amenity access for the typical tenant pool here? Any planned neighborhood developments (good or bad) we should know about?
- What's the average days-on-market for RENTAL listings here right now (not sales)? A rising rental-DOM trend means longer vacancies and softer asking-rent achievability than the comps imply.
- What's the recent tenant-quality profile in this submarket — average credit score on applications, eviction rate, late-payment / NSF rate, and stable-employment percentage? A property-management company in the area should have these aggregated.
- How much new for-sale + rental construction is in the pipeline within 1–3 miles? Heavy new supply typically softens prices + rents 12–24 months out; constrained supply supports both.
Investment metrics
- 1% rule
- 0.87% ✗
- Cap rate
- 5.83%
- Cash-on-cash
- -1.65%
- DSCR
- 0.93
- GRM
- 9.6
CMA / ARV
- ARV (on-the-fly)
- $280,130
- Comps found
- 12
Show comp detail 12 sales within ~0.75 mi
| Address | Dist | Beds/Ba | Sqft | Sold | Price | $/sf | Match |
|---|---|---|---|---|---|---|---|
| 405 Martigues Dr | 0.22mi | 3/2.0 | 1,224 (-5%) | 21mo | $295,000 | $241 | 64 |
| 814 Cabaret Ct | 0.44mi | 3/2.0 | 1,283 (-0%) | 20mo | $316,350 | $247 | 63 |
| 306 Clermont Dr | 0.25mi | 3/2.0 | 1,153 (-10%) | 11mo | $255,000 | $221 | 62 |
| 811 Albi Ct | 0.29mi | 3/2.0 | 1,465 (+14%) | 4mo | $239,900 | $164 | 60 |
| 335 Clermont Dr | 0.36mi | 3/2.0 | 1,204 (-6%) | 19mo | $266,000 | $221 | 57 |
| 812 Adour Dr | 0.49mi | 3/2.0 | 1,442 (+12%) | 10mo | $298,920 | $207 | 48 |
| 803 Marquis Ct | 0.40mi | 3/2.0 | 1,465 (+14%) | 12mo | $320,000 | $218 | 48 |
| 910 Nancy Ct | 0.59mi | 3/2.0 | 1,453 (+13%) | 10mo | $270,000 | $186 | 42 |
| 611 Jura Ln | 0.69mi | 3/2.0 | 1,444 (+12%) | 10mo | $290,000 | $201 | 39 |
| 859 Ognon Ct | 0.75mi | 3/2.0 | 1,400 (+9%) | 17mo | $275,000 | $196 | 36 |
| 754 Palaiseau Ct | 0.64mi | 3/2.0 | 1,440 (+12%) | 19mo | $264,900 | $184 | 34 |
| 724 Pincon Ln | 0.65mi | 3/2.0 | 1,476 (+15%) | 15mo | $329,000 | $223 | 33 |
Match score weights: distance 35% · size 25% · config 20% · recency 20%. Top-matched comps best support the ARV.
Projected returns pro-forma
-1.48% appreciation · 1.14% rent growth · sell at horizon
- IRR
- -23.5%
- Equity multiple
- 0.07×
- Total profit
- $-57,006
- Equity at exit
- $48,097
- IRR
- -20.5%
- Equity multiple
- -0.48×
- Total profit
- $-90,903
- Equity at exit
- $46,352
Cash invested: $61,600 (down + closing). Projections, not guarantees.
Landlord ↔ Tenant lean methodology
- Overall (STATE)
- 87 Strongly Landlord-Friendly
- State Florida
- 87 Strongly Landlord-Friendly · R+3
- County
- — inherits STATE
- City
- — inherits STATE
ZIP-level market 34759
- Home prices YoY
- -0.5%
- Rents YoY
- 1.1%
- Active inventory
- 1151
- Price-to-rent
- 9.6×
Monthly cashflow live
- Estimated rent
- $1,910 high interval (Pro) →
- Mortgage (P&I)
- −$1,154
- Tax from tax record
- −$249 /mo · $2,983/yr
- Insurance
- −$92
- Flood insurance flood zone
- −$427 /mo · $5,118/yr
- HOA
- −$100
- Vacancy / Maint / Mgmt
- −$401
- Net cashflow
- $-511
Break-even live
UW: 25.0% down · 7.5% · 30yr · 1.5% tax · 5.0% vac · 8.0% maint · 8.0% mgmt
Financing live
Cash to close
- Down payment
- $55,000
- Closing costs
- $6,600
- Reserves months
- —
- Total cash needed
- —
Loan-product check · same deal, 3 products live
Conventional
25% down · 7.5% · 30yr
- Down + closing
- —
- Monthly P&I
- —
- Monthly cashflow
- —
- DSCR
- —
- Eligible?
- —
Personal DTI + credit; lowest rate.
DSCR
20% down · 8.5% · 30yr
- Down + closing
- —
- Monthly P&I
- —
- Monthly cashflow
- —
- DSCR
- —
- Eligible?
- —
No personal income docs; deal must DSCR.
Hard money
10% down · 12.0% · 12mo
- Down + closing
- —
- Monthly P&I
- —
- Monthly cashflow
- —
- DSCR
- —
- Eligible?
- —
Short-term bridge; refi at stabilization.
Rent comps 40 comps
| Address | Beds | Baths | Sqft | Rent | $/sqft | DOM | Units | Dist |
|---|---|---|---|---|---|---|---|---|
| 319 Baccarat Ct Unit A Kissimmee, FL | 2.0 | 2.0 | 1092 | $1,375 | $1.26 | 23d | 1 | 0.13mi |
| 309 Clermont Dr Unit B Kissimmee, FL | 3.0 | 2.0 | 1400 | $1,800 | $1.29 | 23d | 1 | 0.25mi |
| 857 Blanc Ct Kissimmee, FL | 3.0 | 2.0 | 1788 | $1,800 | $1.01 | 7d | 1 | 0.28mi |
| 473 Martigues Dr Kissimmee, FL | 3.0 | 2.0 | 1664 | $1,760 | $1.06 | 17d | 1 | 0.28mi |
| 925 Albertville Ct Kissimmee, FL | 4.0 | 3.0 | 1800 | $2,209 | $1.23 | 7d | 1 | 0.30mi |
| 485 Martigues Dr Kissimmee, FL | 4.0 | 2.0 | 1535 | $1,900 | $1.24 | 23d | 1 | 0.30mi |
| 853 Blanc Ct Kissimmee, FL | 3.0 | 2.0 | 1266 | $1,795 | $1.42 | 7d | 1 | 0.31mi |
| 865 Adour Dr Kissimmee, FL | 3.0 | 2.0 | 1504 | $1,750 | $1.16 | 21d | 1 | 0.37mi |
| 927 Cannes Dr Kissimmee, FL | 3.0 | 2.0 | 1609 | $1,604 | $1.00 | 7d | 1 | 0.38mi |
| 829 Blanc Ct Kissimmee, FL | 3.0 | 2.0 | 1533 | $1,700 | $1.11 | 23d | 1 | 0.44mi |
| 828 Cabaret Ct Kissimmee, FL | 3.0 | 2.0 | 1600 | $1,850 | $1.16 | 17d | 1 | 0.52mi |
| 819 Jarnac Dr Kissimmee, FL | 4.0 | 2.0 | 1711 | $1,750 | $1.02 | 23d | 1 | 0.61mi |
| 729 Pincon Ln Kissimmee, FL | 3.0 | 2.0 | 1652 | $1,864 | $1.13 | 7d | 1 | 0.69mi |
| 714 Caribou Dr Kissimmee, FL | 3.0 | 2.0 | 1534 | $1,975 | $1.29 | 23d | 1 | 0.71mi |
| 873 Jarnac Dr Kissimmee, FL | 3.0 | 2.0 | 1636 | $1,704 | $1.04 | 13d | 1 | 0.71mi |
| 870 Jarnac Dr Kissimmee, FL | 3.0 | 2.0 | 1356 | $1,710 | $1.26 | 7d | 1 | 0.72mi |
| 810 Ognon Ct Kissimmee, FL | 4.0 | 2.0 | 1730 | $1,799 | $1.04 | 3d | 1 | 0.75mi |
| 827 Massy Ct Kissimmee, FL | 3.0 | 2.0 | 1480 | $1,639 | $1.11 | 21d | 1 | 0.76mi |
| 657 Koala Ct Kissimmee, FL | 3.0 | 2.0 | 1246 | $1,870 | $1.50 | 3d | 1 | 0.78mi |
| 657 Koala Ct Kissimmee, FL | 3.0 | 2.0 | 1246 | $2,020 | $1.62 | 2d | 1 | 0.78mi |
| 653 Koala Ct Kissimmee, FL | 3.0 | 2.0 | 1246 | $2,000 | $1.61 | 13d | 1 | 0.80mi |
| 1001 Puget Ln Kissimmee, FL | 4.0 | 2.0 | 1758 | $2,450 | $1.39 | 23d | 1 | 0.83mi |
| 601 Fisher Ct Poinciana, FL | 3.0 | 2.0 | 1250 | $1,525 | $1.22 | 23d | 1 | 0.84mi |
| 658 Caribou Ct Kissimmee, FL | 3.0 | 2.0 | 1300 | $1,800 | $1.38 | 3d | 1 | 0.84mi |
| 613 Antelope Ln Kissimmee, FL | 3.0 | 2.0 | 1515 | $2,300 | $1.52 | 2d | 1 | 0.87mi |
| 659 Gazelle Dr Kissimmee, FL | 3.0 | 2.0 | 1495 | $1,875 | $1.25 | 23d | 1 | 0.90mi |
| 609 Tamarin Ln Kissimmee, FL | 3.0 | 2.0 | 1250 | $1,725 | $1.38 | 14d | 1 | 1.08mi |
| 721 Bittern Ln Unit A Kissimmee, FL | 3.0 | 2.0 | 1350 | $1,750 | $1.30 | 23d | 1 | 1.14mi |
| 709 Versailles Ln Kissimmee, FL | 4.0 | 2.0 | 1872 | $1,999 | $1.07 | 23d | 1 | 1.15mi |
| 662 Yak Ct Kissimmee, FL | 4.0 | 2.0 | 1600 | $1,675 | $1.05 | 23d | 1 | 1.17mi |
| 731 Toulon Dr Kissimmee, FL | 3.0 | 2.0 | 1500 | $2,000 | $1.33 | 23d | 1 | 1.18mi |
| 796 Squirrel Ct Kissimmee, FL | 4.0 | 2.0 | 1661 | $1,675 | $1.01 | 23d | 1 | 1.20mi |
| 796 Squirrel Ct Kissimmee, FL | 4.0 | 2.0 | 1661 | $1,675 | $1.01 | 21d | 1 | 1.20mi |
| 619 Reindeer Dr Kissimmee, FL | 4.0 | 2.0 | 1714 | $1,950 | $1.14 | 23d | 1 | 1.21mi |
| 736 Bittern Ln Kissimmee, FL | 3.0 | 2.0 | 1200 | $1,775 | $1.48 | 23d | 1 | 1.22mi |
| 724 Versailles Ln Kissimmee, FL | 3.0 | 2.0 | 1368 | $1,795 | $1.31 | 21d | 1 | 1.23mi |
| 774 Squirrel Ct Kissimmee, FL | 3.0 | 2.0 | 1000 | $1,750 | $1.75 | 23d | 1 | 1.24mi |
| 641 Yak Ct Unit B Kissimmee, FL | 3.0 | 2.0 | 1162 | $1,650 | $1.42 | 23d | 1 | 1.25mi |
| 822 E Flag Ln Kissimmee, FL | 3.0 | 2.0 | 1218 | $2,500 | $2.05 | 2d | 1 | 1.25mi |
| 783 Squirrel Ct Unit B Kissimmee, FL | 2.0 | 2.0 | 1100 | $1,300 | $1.18 | 23d | 1 | 1.25mi |
HOA detail
- Monthly dues
- $100 · $1,200/yr
Listing history 2 events
-
2026-06-19remarks 699-char remark
-
2026-06-19$220,000 Active 1 DOM
ⓘ Source: listings_history table (triggers on properties + properties_extension) + one-shot
backfill from property_details.listing_events for pre-trigger history.
Tax reassessment forecast FL · Resets to sale price
- Current annual tax
- $2,983 · $249/mo
- Projected year-2 tax
- $2,983 · $249/mo
- Expected delta
- $0/yr ($0/mo · 0.0%)
ⓘ Screening estimate from a state-policy table — verify with the county assessor before closing.
Climate risk First Street
- Flood 1/10 Low FEMA zone AE · 0% chance over 30 yrs
- Wildfire 4/10 Moderate
- Heat 8/10 Severe 7 d/yr ≥108°F today · 23 d/yr by 30 yrs out
- Wind 9/10 Extreme 99% chance of damaging wind over 30 yrs
- Air quality 1/10 Low 0 unhealthy d/yr today · 0 by 30 yrs out
Nearby sold comps map
Loading sold comps map…
Walkable amenities ~0.75 mi
Loading nearby amenities…
Taxation est. · year 1
- Rental income
- $22,926
- − Mortgage interest
- −$12,323
- − Property taxes
- −$2,983
- − Insurance
- −$6,218
- − Repairs & maintenance
- −$1,834
- − Management
- −$1,834
- − HOA
- −$1,200
- − Depreciation
- −$6,400
- Taxable loss
- −$9,867
- Est. tax savings @ 24.0%
- +$2,368
- After-tax cash flow
- $-3,766/yr
For passive investors: Depreciation is non-cash, so a rental often shows a tax loss while cash-flowing — sheltering income. Rental losses are passive: they offset passive income freely, and up to $25,000/yr can offset ordinary (W-2) income if you actively participate and your MAGI is under $100k (phasing out to $0 by $150k); unused losses carry forward. On sale, claimed depreciation is recaptured at up to 25%, and gains may owe capital-gains tax (a 1031 exchange can defer both). Figures are a year-1 estimate at your 24.0% rate — not tax advice; consult a CPA.
Schools (NCES district)
- District
- Osceola
- NCES district ID
- 1201470
- Math proficiency
- 39% ▼ -9.00%
- Reading proficiency
- 45% ▼ -4.00%
- Median HH income
- $45,528
- Composite
- 35.7/100
- National rank
- #4865
- State rank
- #60 of 73 in FL
Livability — Poinciana
- Score
- 57/100
- State rank
- #859
- US rank
- #21760
Category grades
Schools grade is shown separately in the Schools card above.
Census & demographics
- Census place
- Poinciana, FL
- County
- Polk County · 740,051 people
- City population
- 91,336
- Metro
- Lakeland-Winter Haven, FL
- Population (ZIP)
- 44,568
- Household income
- $69,373
- Rent vs Own
- Severe rent burden
- 1186.0
Population outlook (Osceola County) Hauer SSP2
- Today (2025)
- 447,624 people
- By 2030
- 511,823 · +14.3%
- By 2040
- 642,986 · +43.6%
- By 2050
- 774,552 · +73.0%
- By 2075
- 1,078,144 · +140.9%
- By 2100
- 1,269,660 · +183.6%
Race, ethnicity, and origin ACS 2023
- Neighborhood character
- Diverse neighborhood (Simpson 0.62)
- Race & ethnicity
- Hispanic / Latino 55% White 21% Two or more races 20% Black 19%
- Hispanic origin (detail)
- Mexican 2% Puerto Rican 38% Cuban 6% Dominican 3%
- Common ancestry
- Hispanic 3% Romanian 2% Scotch-Irish 1%
- Foreign-born
- 17% · Canada, Jamaica
- Languages at home
- 49% English-only · Spanish 48% French/Haitian/Cajun 2%
Political lean MEDSL · Osceola
- 2024 margin
- Toss-up / Even · D 48.7% · R 50.2% · Other 1.1%
- 2008→2024 swing
- -21.2pp toward R · 2008: 19.7pp · 2024: -1.4pp
- All cycles
- 2024: R+1.4 2020: D+13.8 2016: D+25.0 2012: D+24.5 2008: D+19.7
Not yet ingested
- Civics
- —
Market trends
- HPI YoY
- ▼ -1.48%
- Current HPI
- 276.6861
- Rent YoY
- ▲ 1.14%
- Metro
- Lakeland-Winter Haven, FL
- State GDP YoY
- ▲ 3.28%
- F500 in state
- 36
Industry mix (Fortune 500 HQ in FL)
| Industry | F500 HQs | Revenue |
|---|---|---|
| Industrial Technology | 2 | $29B |
|
||
| Insurance | 2 | $17B |
|
||
| Retail | 1 | $60B |
|
||
| Technology Distribution | 1 | $58B |
|
||
| Homebuilding | 1 | $35B |
|
||
| Technology Manufacturing | 1 | $35B |
|
||
Price history
+2720.5% since first listed17 events — show timeline
- 2026-06-18 Listed $220,000 Stellar MLS as Distributed by MLS Grid
- 2025-11-08 Rental Removed $1,600 STELLARMLS
- 2025-10-24 Price Changed $1,600 STELLARMLS
- 2025-08-11 Listed for Rent $1,650 STELLARMLS
- 2025-03-26 Listing Removed — Stellar MLS as Distributed by MLS Grid
- 2024-10-18 Price Changed $270,000 Stellar MLS as Distributed by MLS Grid
- 2024-10-08 Listed $275,000 Stellar MLS as Distributed by MLS Grid
- 2023-02-02 Sold (Public Records) $260,000 Public Records
- 2023-01-30 Sold (MLS) $260,000 Stellar MLS as Distributed by MLS Grid
- 2023-01-08 Pending — Stellar MLS as Distributed by MLS Grid
- 2023-01-04 Relisted — Stellar MLS as Distributed by MLS Grid
- 2022-12-28 Pending — Stellar MLS as Distributed by MLS Grid
- 2022-12-08 Price Changed $254,000 Stellar MLS as Distributed by MLS Grid
- 2022-12-01 Price Changed $276,000 Stellar MLS as Distributed by MLS Grid
- 2022-10-20 Listed $277,000 Stellar MLS as Distributed by MLS Grid
- 2022-09-07 Sold (Public Records) $234,300 Public Records
- 1986-11-01 Sold (Public Records) $7,800 Public Records
Property tax history
+11.4%/yrLatest (2025): $2,983 · +3.0% YoY. Source: county tax records.
Cash-flow waterfall
monthlySold comps — $/sqft
last 12 mo · ≤1 miLoading sold comps…