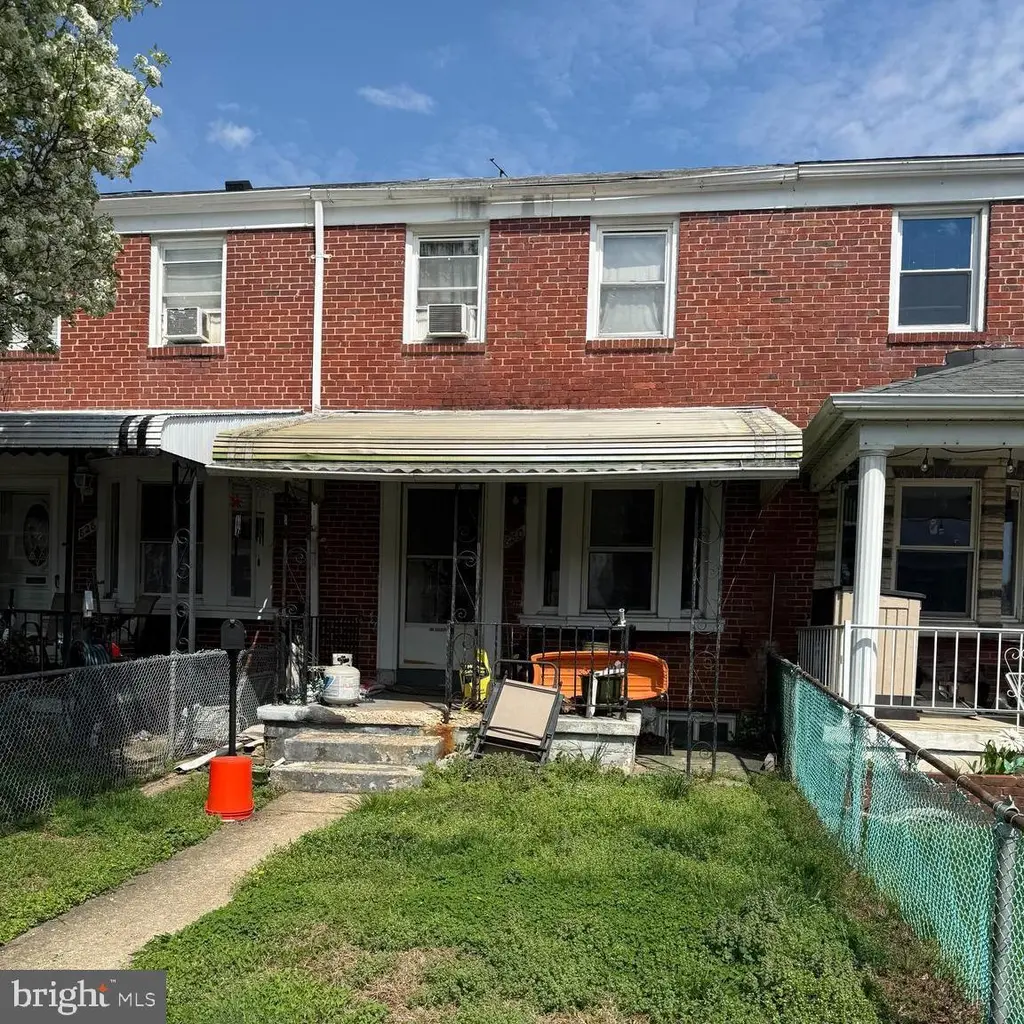
830 Middlesex Rd · Essex, MD
Flood risk 1/10 · Minimal
- FEMA flood zone
- X (unshaded)
- Chance of flooding over 30 yrs
- 0.0%
- Est. flood insurance / yr
- $473 – $860
Fire risk 1/10 · Minimal
- Est. fire insurance / yr
- $755 – $1,403
Heat risk 8/10 · Major
- Hot days now (above 104°F)
- 7 days/yr
- Hot days in 30 yrs
- 15 days/yr
Wind risk 6/10 · Moderate
- Chance of severe wind over 30 yrs
- 27.0%
Air-quality risk 5/10 · Moderate
- Unhealthy air days now
- 6 days/yr
- Unhealthy air days in 30 yrs
- 8 days/yr
Risk factors via First Street. Map © Google.
Why this score? — see what drove the B+ grade
The composite is a weighted blend of 9 inputs, each scored 0–100. Each bar is that input's sub-score; the figure is the points it added to the 100-point composite (weight × sub-score).
- Cash flow +30.0/30.0
- ARV discount +15.0/15.0
- DSCR +10.0/10.0
- 1% rule +9.1/10.0
- Livability +4.0/5.0
- Rent growth +2.8/5.0
- Condition / age +2.5/5.0
- Schools +2.3/10.0
- Appreciation +0.0/10.0
$140,000
🖨 Deal sheet (PDF) 📄 Offer letter ✓ Due diligence
Listing remarks
Investor opportunity in Essex! This 2-bedroom, 1-bath brick townhome offers strong potential as a fix-and-flip, buy-and-hold rental, or affordable renovation project. Features include a traditional floor plan, brick construction, unfinished basement, and convenient Baltimore County location with easy access to shopping, dining, major commuter routes, and public transportation. Property is vacant and ready for immediate access. Sold strictly AS-IS. Seller will make no repairs. Cash offers preferred; conventional financing may be considered. Excellent opportunity to add value and build equity. Schedule your showing today!
Key facts
- Brick townhome
- Unfinished basement
- Built 1939
Tags
Property features AI
Finance
- Other: Above-grade finished area recorded as 896 (assessor); Below-grade finished area recorded as 200 and unfinished area as 248 (assessor); Total below-grade area recorded as 448
- Financial info: Ground rent: $87 paid semi-annually
Exterior
- Parking: On-street parking
- Utilities: Natural gas hot water; Natural gas heating fuel; Electric cooling fuel; Public water; Public sewer
- Home design: Interior townhouse / rowhouse; Ground rent ownership
- Construction: Brick construction; Block foundation; Built year recorded by assessor
- Exterior features: Above-grade and below-grade structures; Public water and public sewer
Interior
- Bedrooms: Two bedrooms on the first upper level
- Bathrooms: One full bathroom (all upper levels)
- Heating & cooling: Heat pump heating; Window air conditioning units (electric)
- Interior features: Partially finished basement
Neighborhood map
What this means for you Summary
Snapshot
- This is a 2-bed/1.0-bath townhouse listed at $140k.
Deal economics
- At list price, monthly cash flow is $549 ($7k/yr) — positive.
- The deal already cash-flows at list — no discount required.
- Meets the 1% rule at list price ($2k rent vs $140k).
- Cap rate 11.0% vs local median 4.8% in Essex — top-decile yield for the area; either an underpriced asset or a hidden risk that comps aren't pricing in. Stress-test before assuming the spread holds.
Location & tenants
- Location reads 79/100 on livability (#60 in MD, #2,277 nationally) — a middle-class / working-renter tenant base. Strengths: commute A+, housing A+, health & safety A; Watch: amenities D+, schools D, crime F.
- Baltimore County Public Schools (suburban): math 15% / reading 34% proficiency, ranked #11 of 24 in MD (top 46%) — low school quality limits family demand, transient renter base, plan for 1-2y turnover.
- Market conditions: Rents rising (+1.1%/yr); 138 active listings in the ZIP; 26 comparable units currently listed for rent nearby; rentals at typical pace (median 25d on market — plan ~3-4 weeks tenant-placement turnaround); 1,511 units permitted in Baltimore County in 2024 (643 in 5+ unit buildings).
- This rent runs 35% of the median local income ($67k/yr) — at the standard rent-burdened threshold; future hikes will face affordability resistance.
Forward outlook
- Local home prices are declining (-3.0%/yr); year-one equity from $968 of loan paydown is wiped out by about $4k of value loss. Plan a longer hold.
- Baltimore County population projected at +12% by 2050 — modest demand growth; plan on rents tracking national, not racing it.
- At projected returns (-3.0% appreciation + 1.1% rent growth), your $39k cash investment doubles in ~9 years — after that, you're playing with house money.
Negotiation context
- Only 1 days on market — expect competitive offers; lowballing is unlikely to land.
- Current owner paid $40k; list at $140k implies a 250% gain — meaningful room to come down on a strong offer.
Risks & watch-outs
- Watch-outs: built in 1939 — expect roof / HVAC / electrical / plumbing capex.
- Climate carrying-cost: major wind risk, 27% chance of damaging wind over 30y; extreme-heat days projected 7→15/yr by 2055 (HVAC capex compounding) — expect insurance premiums to compound above CPI over the hold.
Questions for the listing agent
- Built in 1939 — when were the roof, HVAC, electrical panel, plumbing, and water heater last replaced?
- Is there a deadline driving the sale (1031 exchange, divorce, estate, relocation)? That informs how much negotiation room exists.
- Schools are D-rated, which usually means shorter tenancies and higher turnover. Who's the typical renter profile here, and what's been the actual vacancy rate?
- Crime grade is F in this area — have there been break-ins, vandalism, or insurance claims at this property in the last 3 years? What carrier currently insures it and at what premium?
- What's the average days-on-market for RENTAL listings here right now (not sales)? A rising rental-DOM trend means longer vacancies and softer asking-rent achievability than the comps imply.
- What's the recent tenant-quality profile in this submarket — average credit score on applications, eviction rate, late-payment / NSF rate, and stable-employment percentage? A property-management company in the area should have these aggregated.
- How much new for-sale + rental construction is in the pipeline within 1–3 miles? Heavy new supply typically softens prices + rents 12–24 months out; constrained supply supports both.
Investment metrics
- 1% rule
- 1.41% ✓
- Cap rate
- 11.00%
- Cash-on-cash
- 16.79%
- DSCR
- 1.75
- GRM
- 5.9
CMA / ARV
- ARV (on-the-fly)
- $195,088
- Comps found
- 12
Show comp detail 12 sales within ~0.75 mi
| Address | Dist | Beds/Ba | Sqft | Sold | Price | $/sf | Match |
|---|---|---|---|---|---|---|---|
| 922 Middlesex Rd | 0.10mi | 2/1.0 | 1,046 (-5%) | 11mo | $190,000 | $182 | 79 |
| 732 Arncliffe Rd | 0.12mi | 3/1.0 (+1) | 1,169 (+7%) | 1mo | $200,000 | $171 | 77 |
| 417 Torner Rd | 0.19mi | 3/1.0 (+1) | 1,144 (+4%) | 3mo | $207,000 | $181 | 77 |
| 738 Arncliffe Rd | 0.11mi | 2/1.0 | 1,016 (-7%) | 8mo | $180,000 | $177 | 76 |
| 724 Middlesex | 0.10mi | 2/1.5 | 1,016 (-7%) | 7mo | $170,000 | $167 | 75 |
| 647 Dunwich Way | 0.17mi | 3/1.5 (+1) | 1,024 (-7%) | 2mo | $147,000 | $144 | 73 |
| 559 Welbrook Rd | 0.36mi | 3/1.0 (+1) | 1,124 (+3%) | 4mo | $175,000 | $156 | 71 |
| 1100 N Marlyn Ave | 0.31mi | 3/1.5 (+1) | 1,144 (+4%) | 2mo | $215,000 | $188 | 69 |
| 606 Middlesex Rd | 0.27mi | 3/2.0 (+1) | 1,152 (+5%) | 1mo | $252,000 | $219 | 69 |
| 624 Dunwich Way | 0.21mi | 3/1.0 (+1) | 1,152 (+5%) | 10mo | $200,000 | $174 | 68 |
| 329 Leeanne Rd | 0.66mi | 3/1.5 (+1) | 1,152 (+5%) | 2mo | $206,000 | $179 | 52 |
| 303 Leeanne Rd | 0.71mi | 3/1.0 (+1) | 1,024 (-7%) | 5mo | $182,000 | $178 | 47 |
Match score weights: distance 35% · size 25% · config 20% · recency 20%. Top-matched comps best support the ARV.
Projected returns pro-forma
-3.0% appreciation · 1.08% rent growth · sell at horizon
- IRR
- 5.8%
- Equity multiple
- 1.22×
- Total profit
- $8,574
- Equity at exit
- $20,874
- IRR
- 13.3%
- Equity multiple
- 1.97×
- Total profit
- $37,931
- Equity at exit
- $12,105
Cash invested: $39,200 (down + closing). Projections, not guarantees.
Landlord ↔ Tenant lean methodology
- Overall (STATE)
- 27 Tenant-Leaning
- State Maryland
- 27 Tenant-Leaning · D+14
- County
- — inherits STATE
- City
- — inherits STATE
ZIP-level market 21221
- Rents YoY
- 1.1%
- Active inventory
- 138
- Price-to-rent
- 5.9×
Monthly cashflow live
- Estimated rent
- $1,971 high interval (Pro) →
- Mortgage (P&I)
- −$734
- Tax from tax record
- −$216 /mo · $2,592/yr
- Insurance
- −$58
- HOA
- −$0
- Vacancy / Maint / Mgmt
- −$414
- Net cashflow
- $549
Break-even live
Sensitivity live
| Price | -10% $628 | -5% $588 | +0% $549 | +5% $509 | +10% $469 |
|---|---|---|---|---|---|
| Rent | -10% $393 | -5% $471 | +0% $549 | +5% $626 | +10% $704 |
| Rate | -1.0pp $619 | -0.5pp $584 | base $549 | +0.5pp $512 | +1.0pp $475 |
UW: 25.0% down · 7.5% · 30yr · 1.5% tax · 5.0% vac · 8.0% maint · 8.0% mgmt
Financing live
Cash to close
- Down payment
- $35,000
- Closing costs
- $4,200
- Reserves months
- —
- Total cash needed
- —
Loan-product check · same deal, 3 products live
Conventional
25% down · 7.5% · 30yr
- Down + closing
- —
- Monthly P&I
- —
- Monthly cashflow
- —
- DSCR
- —
- Eligible?
- —
Personal DTI + credit; lowest rate.
DSCR
20% down · 8.5% · 30yr
- Down + closing
- —
- Monthly P&I
- —
- Monthly cashflow
- —
- DSCR
- —
- Eligible?
- —
No personal income docs; deal must DSCR.
Hard money
10% down · 12.0% · 12mo
- Down + closing
- —
- Monthly P&I
- —
- Monthly cashflow
- —
- DSCR
- —
- Eligible?
- —
Short-term bridge; refi at stabilization.
Rent comps 26 comps
| Address | Beds | Baths | Sqft | Rent | $/sqft | DOM | Units | Dist |
|---|---|---|---|---|---|---|---|---|
| 832 N Marlyn Ave Essex, MD | 3.0 | 2.0 | 1416 | $2,300 | $1.62 | 44d | 1 | 0.12mi |
| 421 Torner Rd Essex, MD | 3.0 | 2.0 | 1024 | $2,050 | $2.00 | 22d | 1 | 0.21mi |
| 233 Orville Rd Essex, MD | 3.0 | 2.0 | 1144 | $1,850 | $1.62 | 44d | 1 | 0.28mi |
| 153 Bennett Rd Unit Labs Essex, MD | 2.0 | 2.0 | 1196 | $1,800 | $1.51 | 5d | 1 | 0.31mi |
| 201 Middleway Rd Middle River, MD | 1.0–2.0 | 1.0 | 750 | $1,571 | $2.09 | 2d | 24 | 0.56mi |
| 54 Stemmers Run Rd Essex, MD | 3.0 | 2.5 | 1260 | $1,950 | $1.55 | 44d | 1 | 0.74mi |
| 42 Holcumb Ct Middle River, MD | 3.0 | 1.5 | 1452 | $2,200 | $1.52 | 44d | 1 | 0.88mi |
| 47 S Hawthorne Rd Middle River, MD | 3.0 | 1.0 | 1024 | $1,900 | $1.86 | 24d | 1 | 0.89mi |
| 60 S Hawthorne Rd Middle River, MD | 3.0 | 1.0 | 1234 | $2,250 | $1.82 | 44d | 1 | 0.89mi |
| 4 Essex Ave Unit A Essex, MD | 2.0 | 1.0 | 800 | $1,250 | $1.56 | 24d | 1 | 0.92mi |
| 1516 Becklow Ave Middle River, MD | 3.0 | 1.0 | 1144 | $2,100 | $1.84 | 22d | 1 | 0.96mi |
| 2125 Hawthorne Rd Middle River, MD | 3.0 | 2.0 | 1299 | $2,100 | $1.62 | 44d | 1 | 0.96mi |
| 120 Kingston Rd Middle River, MD | 3.0 | 2.0 | 1024 | $1,950 | $1.90 | 24d | 1 | 1.01mi |
| 303 Endsleigh Ave Middle River, MD | 3.0 | 2.0 | 1144 | $1,950 | $1.70 | 22d | 1 | 1.01mi |
| 439 Hopkins Landing Dr Essex, MD | 2.0 | 2.0 | 1485 | $1,795 | $1.21 | 11d | 1 | 1.09mi |
| 2202 Firethorn Rd Middle River, MD | 3.0 | 2.5 | 1324 | $2,300 | $1.74 | 44d | 1 | 1.16mi |
| 22 Nakota Ct Middle River, MD | 3.0 | 1.5 | 1194 | $2,000 | $1.68 | 44d | 1 | 1.19mi |
| 2 Chelmsford Ct Middle River, MD | 3.0 | 1.5 | 1122 | $2,100 | $1.87 | 2d | 1 | 1.20mi |
| 303 Holly Dr Middle River, MD | 1.0–2.0 | 1.0 | 740 | $1,510 | $2.04 | 3d | 9 | 1.21mi |
| 433 Grovethorn Rd Middle River, MD | 3.0 | 2.0 | 1024 | $2,000 | $1.95 | 22d | 1 | 1.22mi |
| 2203 Redthorn Rd Middle River, MD | 3.0 | 2.0 | 1144 | $2,200 | $1.92 | 11d | 1 | 1.22mi |
| 2167 Graythorn Rd Middle River, MD | 3.0 | 1.5 | 1324 | $1,900 | $1.44 | 24d | 1 | 1.29mi |
| 28 Ebbing Ct Essex, MD | 3.0 | 2.5 | 1464 | $2,195 | $1.50 | 11d | 1 | 1.31mi |
| 2242 Graythorn Rd Middle River, MD | 3.0 | 1.5 | 1024 | $2,195 | $2.14 | 44d | 1 | 1.37mi |
| 2128 Cockspur Rd Middle River, MD | 3.0 | 1.5 | 1272 | $2,100 | $1.65 | 24d | 1 | 1.44mi |
| 706 Seawall Rd Essex, MD | 3.0 | 1.0 | 1114 | $1,900 | $1.71 | 5d | 1 | 1.48mi |
Listing history 4 events
-
2026-06-17remarks 627-char remark
-
2026-06-17pricedays on market $140,000 Active 1 DOM
-
2026-05-22$135,000 Active
-
1986-06-18soldstatus $40,000
ⓘ Source: listings_history table (triggers on properties + properties_extension) + one-shot
backfill from property_details.listing_events for pre-trigger history.
Tax reassessment forecast MD · Partial reset (capped growth)
- Current annual tax
- $2,592 · $216/mo
- Projected year-2 tax
- $2,592 · $216/mo
- Expected delta
- $0/yr ($0/mo · 0.0%)
ⓘ Screening estimate from a state-policy table — verify with the county assessor before closing.
Climate risk First Street
- Flood 1/10 Low FEMA zone X (unshaded) · 0% chance over 30 yrs
- Wildfire 1/10 Low
- Heat 8/10 Severe 7 d/yr ≥104°F today · 15 d/yr by 30 yrs out
- Wind 6/10 Major 27% chance of damaging wind over 30 yrs
- Air quality 5/10 Major 6 unhealthy d/yr today · 8 by 30 yrs out
Nearby sold comps map
Loading sold comps map…
Walkable amenities ~0.75 mi
Loading nearby amenities…
Taxation est. · year 1
- Rental income
- $23,652
- − Mortgage interest
- −$7,842
- − Property taxes
- −$2,592
- − Insurance
- −$700
- − Repairs & maintenance
- −$1,892
- − Management
- −$1,892
- − Depreciation
- −$4,073
- Taxable income
- $4,661
- Est. tax owed @ 24.0%
- −$1,119
- After-tax cash flow
- $5,465/yr
For passive investors: Depreciation is non-cash, so a rental often shows a tax loss while cash-flowing — sheltering income. Rental losses are passive: they offset passive income freely, and up to $25,000/yr can offset ordinary (W-2) income if you actively participate and your MAGI is under $100k (phasing out to $0 by $150k); unused losses carry forward. On sale, claimed depreciation is recaptured at up to 25%, and gains may owe capital-gains tax (a 1031 exchange can defer both). Figures are a year-1 estimate at your 24.0% rate — not tax advice; consult a CPA.
Schools (NCES district)
- District
- Baltimore County Public Schools
- NCES district ID
- 2400120
- Math proficiency
- 15% ▼ -16.00%
- Reading proficiency
- 34% ▼ -5.00%
- Median HH income
- $66,746
- Composite
- 23.17/100
- National rank
- #7948
- State rank
- #11 of 24 in MD
Livability — Essex
- Score
- 79/100
- State rank
- #60
- US rank
- #2277
Category grades
Schools grade is shown separately in the Schools card above.
Census & demographics
- Census place
- Essex, MD
- County
- Baltimore County · 769,527 people
- City population
- 43,487
- Metro
- Baltimore-Columbia-Towson, MD
- Population (ZIP)
- 43,487
- Household income
- $67,340
- Rent vs Own
- Severe rent burden
- 1757.0
Population outlook (Baltimore County) Hauer SSP2
- Today (2025)
- 885,518 people
- By 2030
- 909,272 · +2.7%
- By 2040
- 951,547 · +7.5%
- By 2050
- 990,955 · +11.9%
- By 2075
- 1,086,411 · +22.7%
- By 2100
- 1,135,078 · +28.2%
Race, ethnicity, and origin ACS 2023
- Neighborhood character
- Diverse neighborhood (Simpson 0.60)
- Race & ethnicity
- White 54% Black 32% Two or more races 7% Hispanic / Latino 7% Asian 1%
- Hispanic origin (detail)
- Mexican 2% Puerto Rican 1% Dominican 1%
- Common ancestry
- Romanian 5% Lithuanian 1% Slovak 1%
- Foreign-born
- 8% · Canada, China
- Languages at home
- 89% English-only · Spanish 6% French/Haitian/Cajun 1%
Political lean MEDSL · Baltimore
- 2024 margin
- Strong D (+24.5) · D 61.0% · R 36.5% · Other 2.5%
- 2008→2024 swing
- +9.9pp toward D · 2008: 14.6pp · 2024: 24.5pp
- All cycles
- 2024: D+24.5 2020: D+27.0 2016: D+17.4 2012: D+16.4 2008: D+14.6
Not yet ingested
- Civics
- —
Market trends
- HPI YoY
- ▼ -232.14%
- Current HPI
- 237.1069
- Rent YoY
- ▲ 1.08%
- Metro
- Baltimore-Columbia-Towson, MD
- State GDP YoY
- ▲ 2.97%
- F500 in state
- 12
Industry mix (Fortune 500 HQ in MD)
| Industry | F500 HQs | Revenue |
|---|---|---|
| Aerospace / Defense | 1 | $71B |
|
||
| Utilities | 1 | $25B |
|
||
| Hotels | 1 | $24B |
|
||
| Consumer Goods | 1 | $7B |
|
||
| Real Estate | 1 | $6B |
|
||
| Chemicals | 1 | $2B |
|
||
Price history
+237.5% since first listed2 events — show timeline
- 2026-05-22 Listed $135,000 BRIGHT MLS
- 1986-06-18 Sold (Public Records) $40,000 Public Records
Property tax history
+3.2%/yrLatest (2025): $2,592 · +7.0% YoY. Source: county tax records.
Cash-flow waterfall
monthlySold comps — $/sqft
last 12 mo · ≤1 miLoading sold comps…