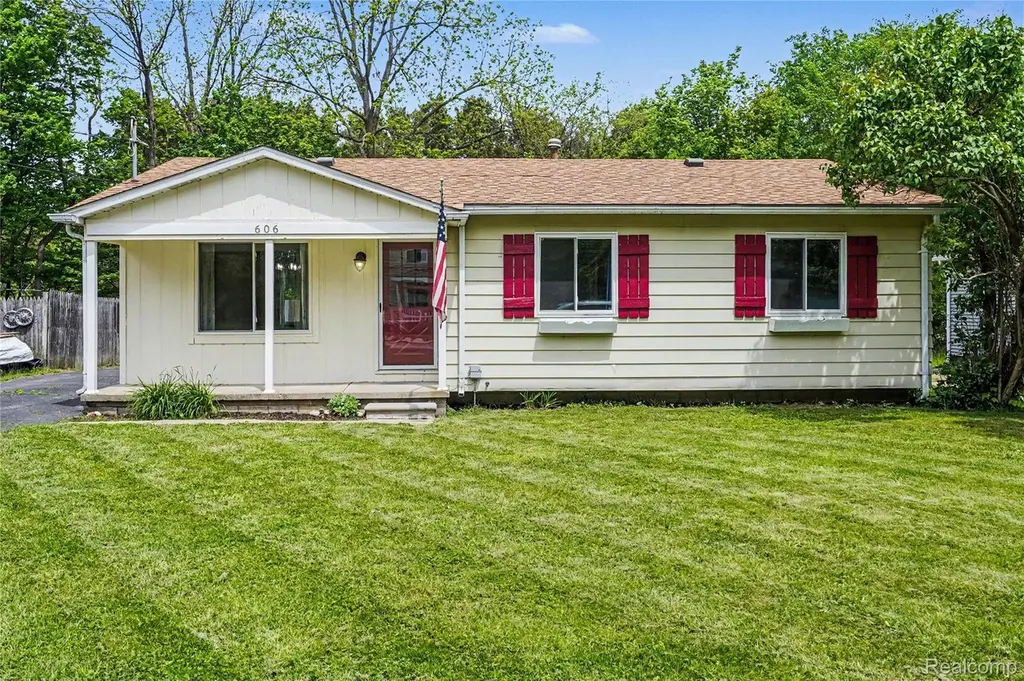
606 Hickory St · Fenton, MI
Flood risk 1/10 · Minimal
- FEMA flood zone
- X (unshaded)
- Chance of flooding over 30 yrs
- 0.0%
- Est. flood insurance / yr
- $507 – $1,088
Fire risk 1/10 · Minimal
- Est. fire insurance / yr
- $784 – $1,456
Heat risk 2/10 · Minimal
- Hot days now (above 95°F)
- 7 days/yr
- Hot days in 30 yrs
- 15 days/yr
Wind risk 2/10 · Minimal
- Chance of severe wind over 30 yrs
- —
Air-quality risk 2/10 · Minimal
- Unhealthy air days now
- 1 days/yr
- Unhealthy air days in 30 yrs
- 3 days/yr
Risk factors via First Street. Map © Google.
Why this score? — see what drove the D+ grade
The composite is a weighted blend of 9 inputs, each scored 0–100. Each bar is that input's sub-score; the figure is the points it added to the 100-point composite (weight × sub-score).
- ARV discount +14.0/15.0
- Cash flow +13.5/30.0
- Schools +4.2/10.0
- DSCR +4.1/10.0
- Livability +3.9/5.0
- 1% rule +3.5/10.0
- Rent growth +3.1/5.0
- Condition / age +2.5/5.0
- Appreciation +0.0/10.0
$199,999
🖨 Deal sheet (PDF) 📄 Offer letter ✓ Due diligence
Listing remarks MLS
Move-in ready and beautifully updated, this charming ranch in Fenton offers the perfect blend of comfort, style, and functionality. Featuring 3 bedrooms, 1 full bath, and 1,008 square feet of living space, this home has been thoughtfully refreshed with major updates already completed for peace of mind. Step inside to an inviting open-concept layout filled with natural light that brightens the main living areas and creates a warm, welcoming atmosphere. The clean, modern feel shines through with fresh paint, new carpet, updated kitchen flooring, and a beautifully remodeled bathroom. Recent updates include a new roof (2022), bathroom remodel (2022), fresh paint (2022), new A/C (2023), new windows (2023), new carpet (2024), kitchen flooring (2024), and a brand-new Lennox furnace installed in August 2025. Outside, enjoy a large fenced-in backyard perfect for entertaining, pets, or relaxing evenings around the fire pit. The paved patio just off the back of the home provides the ideal space for outdoor dining and gatherings. With all the big-ticket updates already done, this home offers true move-in readiness in a desirable Fenton location.
Key facts
- Remodeled bathroom
- New a/c
- New roof
Tags
Property features AI
Finance
- Other: Located in the Thompsons Add subdivision; Directions: Heading north on Adelaide, turn left on Hickory; home is on the right
Exterior
- Parking: No garage
- Utilities: Public water; Public sewer
- Home design: Single-family residence; One story; Ground-level entry; Aluminum and wood siding
- Construction: Block foundation
- Exterior features: Paved road access; Lot dimensions approximately 61 x 116 x 68 x 136; Lot size about 0.19 acres; No pool
Interior
- Kitchen: Free‑standing electric oven/range; Free‑standing refrigerator; Microwave; Dishwasher not listed
- Bathrooms: One full bathroom
- Heating & cooling: Central air conditioning; Forced air heating; Natural gas heating
- Interior features: Crawl space basement; Seven total rooms
- Laundry & utility: Washer and dryer included
Neighborhood map
What this means for you Summary
Snapshot
- This is a 3-bed/1.0-bath single-family listed at $200k.
Deal economics
- At list price, monthly cash flow is $6 ($76/yr) — positive.
- The deal already cash-flows at list — no discount required.
- To meet the 1% rule (rent ≥ 1% of price), the offer needs to be $169k (15.5% below list).
- Recommended offer: $169k (15.5% below list) — sets the bar for 1% rule.
- Cap rate 6.3% vs local median 2.8% in Fenton — top-decile yield for the area; either an underpriced asset or a hidden risk that comps aren't pricing in. Stress-test before assuming the spread holds.
Location & tenants
- Location reads 77/100 on livability (#130 in MI, #3,197 nationally) — a middle-class / working-renter tenant base. Strengths: cost of living A+, housing A+, health & safety A-; Watch: amenities F, commute F.
- Fenton Area Public Schools (suburban): math 38% / reading 57% proficiency, ranked #112 of 540 in MI (top 21%) — families likely to look elsewhere, expect single-tenant / working-renter base with shorter leases.
- Zoned schools: State Road Elementary School (math 47% / reading 57%, grade C-, #328 of 1,397 statewide, top 26%, 425 students, 28% FRL); Andrew G Schmidt Middle School (math 31% / reading 53%, grade D-, #186 of 493 statewide, top 39%, 717 students, 36% FRL); Fenton Senior High School (math 35% / reading 72%, grade C-, #125 of 713 statewide, top 18%, 1,102 students, 30% FRL).
- Market conditions: Rents rising (+2.6%/yr); 315 active listings in the ZIP; 9 comparable units currently listed for rent nearby; rentals leasing fast (median 0d on market — plan ~1-2 weeks tenant-placement turnaround); solid renter incomes; 419 units permitted in Genesee County in 2024 (68 in 5+ unit buildings).
Forward outlook
- Local home prices are declining (-3.0%/yr); year-one equity from $1k of loan paydown is wiped out by about $6k of value loss. Plan a longer hold.
- Genesee County population projected at -27% by 2050 — secular population decline; favor cash flow + early exit over multi-decade hold.
Negotiation context
- Only 6 days on market — expect competitive offers; lowballing is unlikely to land.
- 2 sale attempts with the ask held roughly flat each time — persistent listings suggest the price (not the market) is what's stuck; bring a comps-based counter.
Questions for the listing agent
- Built in 1977 — when were the roof, HVAC, electrical panel, plumbing, and water heater last replaced?
- Is there a deadline driving the sale (1031 exchange, divorce, estate, relocation)? That informs how much negotiation room exists.
- Schools are B-rated — typically a magnet for longer-tenancy family renters. What's the average tenant stay here, and is there a school-zone premium baked into asking?
- The area grade is low — what's the realistic commute time and amenity access for the typical tenant pool here? Any planned neighborhood developments (good or bad) we should know about?
- What's the average days-on-market for RENTAL listings here right now (not sales)? A rising rental-DOM trend means longer vacancies and softer asking-rent achievability than the comps imply.
- What's the recent tenant-quality profile in this submarket — average credit score on applications, eviction rate, late-payment / NSF rate, and stable-employment percentage? A property-management company in the area should have these aggregated.
- How much new for-sale + rental construction is in the pipeline within 1–3 miles? Heavy new supply typically softens prices + rents 12–24 months out; constrained supply supports both.
Investment metrics
- 1% rule
- 0.85% ✗
- Cap rate
- 6.33%
- Cash-on-cash
- 0.14%
- DSCR
- 1.01
- GRM
- 9.9
CMA / ARV
- ARV (on-the-fly)
- $233,856
- Comps found
- 12
Show comp detail 12 sales within ~0.75 mi
| Address | Dist | Beds/Ba | Sqft | Sold | Price | $/sf | Match |
|---|---|---|---|---|---|---|---|
| 606 Hickory St | 0.00mi | 3/1.0 | 1,008 (0%) | 0mo | $220,000 | $218 | 100 |
| 215 3rd St | 0.43mi | 3/1.0 | 1,040 (+3%) | 1mo | $235,000 | $226 | 74 |
| 845 N East St | 0.54mi | 3/1.0 | 1,012 (+0%) | 4mo | $185,000 | $183 | 71 |
| 735 Elmwood Dr | 0.63mi | 3/1.0 | 1,008 (0%) | 7mo | $168,000 | $167 | 65 |
| 912 W Silver Lake Rd | 0.43mi | 2/1.0 (-1) | 1,064 (+6%) | 2mo | $252,000 | $237 | 64 |
| 608 S Adelaide St | 0.56mi | 2/1.0 (-1) | 981 (-3%) | 3mo | $262,525 | $268 | 62 |
| 823 Southwood Dr | 0.63mi | 3/2.0 | 1,036 (+3%) | 4mo | $235,000 | $227 | 59 |
| 214 W Rockwell St | 0.57mi | 3/2.0 | 1,091 (+8%) | 6mo | $230,000 | $211 | 50 |
| 507 Main St | 0.65mi | 3/2.0 | 1,082 (+7%) | 7mo | $263,900 | $244 | 48 |
| 717 Oak Park Dr | 0.53mi | 2/1.0 (-1) | 864 (-14%) | 1mo | $225,000 | $260 | 46 |
| 838 Westwood Dr | 0.73mi | 3/1.0 | 905 (-10%) | 7mo | $210,000 | $232 | 43 |
| 1009 N Lemen St | 0.71mi | 2/1.0 (-1) | 900 (-11%) | 2mo | $227,750 | $253 | 42 |
Match score weights: distance 35% · size 25% · config 20% · recency 20%. Top-matched comps best support the ARV.
Projected returns pro-forma
-3.0% appreciation · 2.59% rent growth · sell at horizon
- IRR
- -16.5%
- Equity multiple
- 0.42×
- Total profit
- $-32,707
- Equity at exit
- $29,821
- IRR
- -9.0%
- Equity multiple
- 0.45×
- Total profit
- $-30,817
- Equity at exit
- $17,292
Cash invested: $56,000 (down + closing). Projections, not guarantees.
Landlord ↔ Tenant lean methodology
- Overall (STATE)
- 62 Landlord-Friendly
- State Michigan
- 62 Landlord-Friendly · EVEN
- County
- — inherits STATE
- City
- — inherits STATE
ZIP-level market 48430
- Rents YoY
- 2.6%
- Active inventory
- 315
- Price-to-rent
- 9.9×
Monthly cashflow live
- Estimated rent
- $1,690 high interval (Pro) →
- Mortgage (P&I)
- −$1,049
- Tax from tax record
- −$197 /mo · $2,361/yr
- Insurance
- −$83
- HOA
- −$0
- Vacancy / Maint / Mgmt
- −$355
- Net cashflow
- $6
Break-even live
Sensitivity live
| Price | -10% $120 | -5% $63 | +0% $6 | +5% $-50 | +10% $-107 |
|---|---|---|---|---|---|
| Rent | -10% $-127 | -5% $-60 | +0% $6 | +5% $73 | +10% $140 |
| Rate | -1.0pp $107 | -0.5pp $57 | base $6 | +0.5pp $-45 | +1.0pp $-98 |
UW: 25.0% down · 7.5% · 30yr · 1.5% tax · 5.0% vac · 8.0% maint · 8.0% mgmt
Financing live
Cash to close
- Down payment
- $50,000
- Closing costs
- $6,000
- Reserves months
- —
- Total cash needed
- —
Loan-product check · same deal, 3 products live
Conventional
25% down · 7.5% · 30yr
- Down + closing
- —
- Monthly P&I
- —
- Monthly cashflow
- —
- DSCR
- —
- Eligible?
- —
Personal DTI + credit; lowest rate.
DSCR
20% down · 8.5% · 30yr
- Down + closing
- —
- Monthly P&I
- —
- Monthly cashflow
- —
- DSCR
- —
- Eligible?
- —
No personal income docs; deal must DSCR.
Hard money
10% down · 12.0% · 12mo
- Down + closing
- —
- Monthly P&I
- —
- Monthly cashflow
- —
- DSCR
- —
- Eligible?
- —
Short-term bridge; refi at stabilization.
Rent comps 9 comps
| Address | Beds | Baths | Sqft | Rent | $/sqft | DOM | Units | Dist |
|---|---|---|---|---|---|---|---|---|
| 714 Grant St Fenton, MI | 3.0 | 1.0 | 750 | $1,750 | $2.33 | 45d | 1 | 0.47mi |
| 722 N East St Fenton, MI | 2.0 | 1.0 | 800 | $1,400 | $1.75 | 12d | 1 | 0.52mi |
| 407 1st St Fenton, MI | 3.0 | 2.0 | 1242 | $2,200 | $1.77 | 0d | 1 | 0.54mi |
| 1107 Oak St Fenton, MI | 2.0 | 1.0 | 1200 | $1,420 | $1.18 | 0d | 1 | 0.68mi |
| 1024 North Rd Fenton, MI | 1.0–2.0 | 1.0–2.0 | 815 | $1,400 | $1.72 | 0d | 1 | 0.69mi |
| 1024 North Rd Fenton, MI | 1.0–2.0 | 1.0–2.0 | 815 | $1,400 | $1.72 | 45d | 3 | 0.69mi |
| 2100 Georgetown Pkwy Fenton, MI | 2.0 | 2.0 | 1130 | $1,348 | $1.19 | 0d | 26 | 0.89mi |
| 3200 Foley Glen Dr Fenton, MI | 1.0–2.0 | 1.0–2.0 | 1087 | $1,978 | $1.82 | 0d | 7 | 1.25mi |
| 3800 Arbor Dr Fenton, MI | 2.0 | 1.0–2.0 | 762 | $1,749 | $2.29 | 0d | 1 | 1.41mi |
Listing history 6 events
-
2026-06-04statusdays on market $199,999 Pending 6 DOM
-
2026-06-02days on market $199,999 Active 5 DOM
-
2026-06-01days on market $199,999 Active 4 DOM
-
2026-05-31days on market $199,999 Active 3 DOM
-
2026-05-28$199,999 Active
Show marketing remark (1151 chars)
Move-in ready and beautifully updated, this charming ranch in Fenton offers the perfect blend of comfort, style, and functionality. Featuring 3 bedrooms, 1 full bath, and 1,008 square feet of living space, this home has been thoughtfully refreshed with major updates already completed for peace of mind. Step inside to an inviting open-concept layout filled with natural light that brightens the main living areas and creates a warm, welcoming atmosphere. The clean, modern feel shines through with fresh paint, new carpet, updated kitchen flooring, and a beautifully remodeled bathroom. Recent updates include a new roof (2022), bathroom remodel (2022), fresh paint (2022), new A/C (2023), new windows (2023), new carpet (2024), kitchen flooring (2024), and a brand-new Lennox furnace installed in August 2025. Outside, enjoy a large fenced-in backyard perfect for entertaining, pets, or relaxing evenings around the fire pit. The paved patio just off the back of the home provides the ideal space for outdoor dining and gatherings. With all the big-ticket updates already done, this home offers true move-in readiness in a desirable Fenton location.
-
2026-05-28$199,999 Active 1151-char remark
Show marketing remark (1151 chars)
Move-in ready and beautifully updated, this charming ranch in Fenton offers the perfect blend of comfort, style, and functionality. Featuring 3 bedrooms, 1 full bath, and 1,008 square feet of living space, this home has been thoughtfully refreshed with major updates already completed for peace of mind. Step inside to an inviting open-concept layout filled with natural light that brightens the main living areas and creates a warm, welcoming atmosphere. The clean, modern feel shines through with fresh paint, new carpet, updated kitchen flooring, and a beautifully remodeled bathroom. Recent updates include a new roof (2022), bathroom remodel (2022), fresh paint (2022), new A/C (2023), new windows (2023), new carpet (2024), kitchen flooring (2024), and a brand-new Lennox furnace installed in August 2025. Outside, enjoy a large fenced-in backyard perfect for entertaining, pets, or relaxing evenings around the fire pit. The paved patio just off the back of the home provides the ideal space for outdoor dining and gatherings. With all the big-ticket updates already done, this home offers true move-in readiness in a desirable Fenton location.
ⓘ Source: listings_history table (triggers on properties + properties_extension) + one-shot
backfill from property_details.listing_events for pre-trigger history.
Tax reassessment forecast MI · Partial reset (capped growth)
- Current annual tax
- $2,361 · $197/mo
- Projected year-2 tax
- $2,721 · $227/mo
- Expected delta
- +$359/yr (+$30/mo · 15.2%)
ⓘ Screening estimate from a state-policy table — verify with the county assessor before closing.
Climate risk First Street
- Flood 1/10 Low FEMA zone X (unshaded) · 0% chance over 30 yrs
- Wildfire 1/10 Low
- Heat 2/10 Low 7 d/yr ≥95°F today · 15 d/yr by 30 yrs out
- Wind 2/10 Low
- Air quality 2/10 Low 1 unhealthy d/yr today · 3 by 30 yrs out
Nearby sold comps map
Loading sold comps map…
Walkable amenities ~0.75 mi
Loading nearby amenities…
Taxation est. · year 1
- Rental income
- $20,283
- − Mortgage interest
- −$11,203
- − Property taxes
- −$2,361
- − Insurance
- −$1,000
- − Repairs & maintenance
- −$1,623
- − Management
- −$1,623
- − Depreciation
- −$5,818
- Taxable loss
- −$3,345
- Est. tax savings @ 24.0%
- +$803
- After-tax cash flow
- $879/yr
For passive investors: Depreciation is non-cash, so a rental often shows a tax loss while cash-flowing — sheltering income. Rental losses are passive: they offset passive income freely, and up to $25,000/yr can offset ordinary (W-2) income if you actively participate and your MAGI is under $100k (phasing out to $0 by $150k); unused losses carry forward. On sale, claimed depreciation is recaptured at up to 25%, and gains may owe capital-gains tax (a 1031 exchange can defer both). Figures are a year-1 estimate at your 24.0% rate — not tax advice; consult a CPA.
Schools (NCES district)
- District
- Fenton Area Public Schools
- NCES district ID
- 2614250
- Math proficiency
- 38% ▼ -7.00%
- Reading proficiency
- 57% ▼ -2.00%
- Median HH income
- $60,377
- Composite
- 41.63/100
- National rank
- #3426
- State rank
- #112 of 540 in MI
Livability — Fenton
- Score
- 77/100
- State rank
- #130
- US rank
- #3197
Category grades
Schools grade is shown separately in the Schools card above.
Census & demographics
- Census place
- Fenton, MI
- County
- Livingston County · 121,626 people
- City population
- 39,309
- Metro
- Detroit-Warren-Dearborn, MI
- Population (ZIP)
- 39,309
- Household income
- $100,193
- Rent vs Own
- Severe rent burden
- 642.0
Population outlook (Genesee County) Hauer SSP2
- Today (2025)
- 381,312 people
- By 2030
- 362,731 · -4.9%
- By 2040
- 321,550 · -15.7%
- By 2050
- 279,212 · -26.8%
- By 2075
- 193,336 · -49.3%
- By 2100
- 128,118 · -66.4%
Race, ethnicity, and origin ACS 2023
- Neighborhood character
- Predominantly White (91%)
- Race & ethnicity
- White 91% Two or more races 4% Hispanic / Latino 3% Asian 1% Black 1%
- Common ancestry
- Romanian 10% Lithuanian 5% Slovak 3%
- Foreign-born
- 2% · Canada
- Languages at home
- 97% English-only · Spanish 1% Other Asian/Pacific 1% Other Indo-European 1%
Political lean MEDSL · Genesee
- 2024 margin
- Toss-up / Even · D 51.4% · R 47.2% · Other 1.4%
- 2008→2024 swing
- -28.3pp toward R · 2008: 32.5pp · 2024: 4.2pp
- All cycles
- 2024: D+4.2 2020: D+9.3 2016: D+9.5 2012: D+28.2 2008: D+32.5
Not yet ingested
- Civics
- —
Market trends
- HPI YoY
- ▼ -298.66%
- Current HPI
- 238.8371
- Rent YoY
- ▲ 2.59%
- Metro
- Detroit-Warren-Dearborn, MI
- State GDP YoY
- ▲ 1.37%
- F500 in state
- 28
Industry mix (Fortune 500 HQ in MI)
| Industry | F500 HQs | Revenue |
|---|---|---|
| Automotive Parts | 3 | $48B |
|
||
| Automotive | 2 | $372B |
|
||
| Chemicals | 1 | $45B |
|
||
| Automotive Retail | 1 | $29B |
|
||
| Healthcare / Medical Devices | 1 | $23B |
|
||
| Automotive Technology | 1 | $20B |
|
||
Price history
+0.0% since first listed2 events — show timeline
- 2026-05-28 Listed $199,999 REALCOMP
- 2026-05-28 Listed $199,999 MiRealSource-MiMLS
Property tax history
+6.2%/yrLatest (2025): $2,361 · +2.7% YoY. Source: county tax records.
Cash-flow waterfall
monthlySold comps — $/sqft
last 12 mo · ≤1 miLoading sold comps…