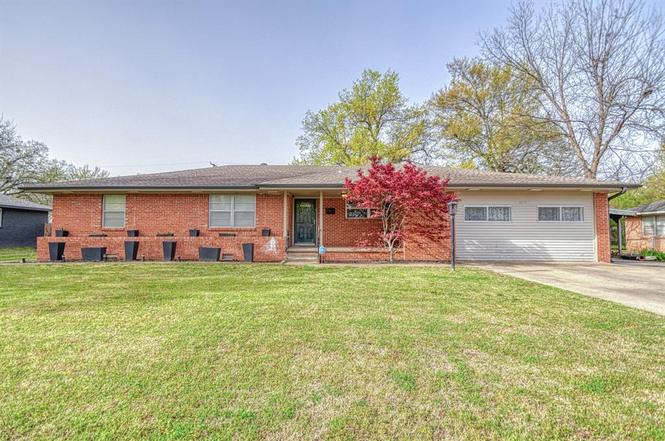
1614 Cruce St · Norman, OK
Flood risk 1/10 · Minimal
- FEMA flood zone
- X (unshaded)
- Chance of flooding over 30 yrs
- 0.0%
- Est. flood insurance / yr
- $507 – $1,088
Fire risk 2/10 · Minimal
- Est. fire insurance / yr
- $2,463 – $4,575
Heat risk 6/10 · Moderate
- Hot days now (above 108°F)
- 7 days/yr
- Hot days in 30 yrs
- 19 days/yr
Wind risk 3/10 · Minor
- Chance of severe wind over 30 yrs
- 4.0%
Air-quality risk 2/10 · Minimal
- Unhealthy air days now
- 1 days/yr
- Unhealthy air days in 30 yrs
- 1 days/yr
Risk factors via First Street. Map © Google.
Why this score? — see what drove the D+ grade
The composite is a weighted blend of 9 inputs, each scored 0–100. Each bar is that input's sub-score; the figure is the points it added to the 100-point composite (weight × sub-score).
- ARV discount +15.0/15.0
- Cash flow +12.4/30.0
- Rent growth +4.4/5.0
- Livability +4.2/5.0
- DSCR +3.7/10.0
- 1% rule +3.0/10.0
- Schools +2.6/10.0
- Condition / age +2.5/5.0
- Appreciation +0.0/10.0
$285,000
🖨 Deal sheet 📄 Offer letter ✓ Due diligence
Listing remarks MLS
Location and Care! This home has been so well taken care of. Beautiful original hardwood floors! Lots of living space and tons of storage. Nice garage conversion off of kitchen. New carpet in garage conversion. Newer interior paint. 2010 new new HVAC, 2013 new roof, installed new insulation in in attic, sprinkle system,, nice wood deck in backyard for entertaining, 2 storgae sheds
Key facts
- Covered porch
- Garage conversion
- Large wood deck
Tags
Property features AI
Finance
- HOA & community: No mandatory association dues
Exterior
- Parking: Concrete parking
- Security: Smoke alarm; Underground sprinkler system
- Utilities: Cable available; Electricity available; Natural gas available; Public utilities
- Home design: Single-family residence; One level; Property faces north; Residential property, existing
- Construction: Brick and frame construction; Composition roof (replaced/updated 2025); Combination foundation
- Exterior features: Covered porch; Open deck; Open patio; Wood fence; Private outdoor fiberglass pool; Outdoor pool
Interior
- Kitchen: Dishwasher; Disposal; Instant hot water; Microwave; Built-in electric range and oven
- Bedrooms: 3 bedrooms
- Flooring: Wood; Combination of floor types
- Bathrooms: 2 full baths; 1 half bath; Tub and separate shower
- Heating & cooling: Smoke alarm
- Interior features: Ceiling fans; Window treatments; Built-ins; Entertainment center; Breakfast bar; Eating space; Family/den; Game room; Inside utility; Study; Optional bedroom / living area
- Laundry & utility: Washer and dryer included; Inside utility
Neighborhood map
What this means for you Summary
Snapshot
- This is a 3-bed/1.5-bath single-family listed at $285k.
Deal economics
- At list price, monthly cash flow is $-46 ($-555/yr) — negative.
- To cash-flow at today's rent, offer at most $277k (2.9% below list).
- To meet the 1% rule (rent ≥ 1% of price), the offer needs to be $229k (19.6% below list).
- Recommended offer: $229k (19.6% below list) — sets the bar for 1% rule.
- Cap rate 6.1% vs local median 3.6% in Norman — top-decile yield for the area; either an underpriced asset or a hidden risk that comps aren't pricing in. Stress-test before assuming the spread holds.
Location & tenants
- Location reads 85/100 on livability (#1 in OK, #557 nationally) — a professional / high-income tenant draw. Strengths: amenities A+, commute A+, cost of living A+.
- Norman (suburban): math 27% / reading 32% proficiency, ranked #61 of 270 in OK (top 23%) — low school quality limits family demand, transient renter base, plan for 1-2y turnover.
- Zoned schools: Jackson Es (math 17% / reading 17%, grade F, #540 of 845 statewide, top 68%, 410 students, 0% FRL); Norman Hs (math 27% / reading 44%, grade F, #46 of 447 statewide, top 10%, 2,137 students, 0% FRL) — zoned schools average 0% FRL vs 39% district-wide (39 pts lower); this property's tenant base skews higher-income than the district average.
- Market conditions: Rents rising fast (+7.7%/yr); 250 active listings in the ZIP; 9 comparable units currently listed for rent nearby; rentals at typical pace (median 15d on market — plan ~3-4 weeks tenant-placement turnaround); 592 units permitted in Cleveland County in 2024 (12 in 5+ unit buildings).
- At $2,292/mo this rent would consume 47% of the median local household income ($59k/yr) (locally 1704% of renters already pay >50% of income on rent) — very limited rent-growth headroom before tenants either downsize or default.
Forward outlook
- Local home prices are declining (-3.0%/yr); year-one equity from $2k of loan paydown is wiped out by about $9k of value loss. Plan a longer hold.
- Cleveland County population projected at +40% by 2050 — long-run rental-demand tailwind backs the buy-and-hold thesis.
Negotiation context
- It's been on market 187 days — a 12% lower offer ($251k) is reasonable based on typical stale-listing flexibility.
- 4 sale attempts since 12y ago with the ask held roughly flat each time — persistent listings suggest the price (not the market) is what's stuck; bring a comps-based counter.
- Current owner paid $173k; list at $285k implies a 65% gain — meaningful room to come down on a strong offer.
Risks & watch-outs
- Watch-outs: built in 1956 — expect roof / HVAC / electrical / plumbing capex.
- Climate carrying-cost: extreme-heat days projected 7→19/yr by 2055 (HVAC capex compounding) — expect insurance premiums to compound above CPI over the hold.
Questions for the listing agent
- What do current leases actually rent for vs. the listed asking? Can we see a recent rent roll and the last 12 months of T-12 income?
- It's been on market 187 days. Have you received any prior offers? Is the seller open to a 20% concession, seller financing, or rate buy-down credit?
- Built in 1956 — when were the roof, HVAC, electrical panel, plumbing, and water heater last replaced?
- Why hasn't it sold? Are there any deal-killer items the seller is aware of (foundation, flood, title, zoning, code violations)?
- Is there a deadline driving the sale (1031 exchange, divorce, estate, relocation)? That informs how much negotiation room exists.
- The area grade is low — what's the realistic commute time and amenity access for the typical tenant pool here? Any planned neighborhood developments (good or bad) we should know about?
- What's the average days-on-market for RENTAL listings here right now (not sales)? A rising rental-DOM trend means longer vacancies and softer asking-rent achievability than the comps imply.
- What's the recent tenant-quality profile in this submarket — average credit score on applications, eviction rate, late-payment / NSF rate, and stable-employment percentage? A property-management company in the area should have these aggregated.
- How much new for-sale + rental construction is in the pipeline within 1–3 miles? Heavy new supply typically softens prices + rents 12–24 months out; constrained supply supports both.
Investment metrics
- 1% rule
- 0.80% ✗
- Cap rate
- 6.10%
- Cash-on-cash
- -0.70%
- DSCR
- 0.97
- GRM
- 10.4
CMA / ARV
- ARV (on-the-fly)
- $346,312
- Comps found
- 12
Show comp detail 12 sales within ~0.75 mi
| Address | Dist | Beds/Ba | Sqft | Sold | Price | $/sf | Match |
|---|---|---|---|---|---|---|---|
| 1221 Cruce St | 0.14mi | 3/2.0 | 2,499 (+5%) | 4mo | $362,500 | $145 | 79 |
| 837 Carriage Ln | 0.26mi | 4/2.5 (+1) | 2,599 (+10%) | 1mo | $490,000 | $189 | 62 |
| 1626 Lenox Dr | 0.17mi | 4/1.0 (+1) | 2,649 (+12%) | 6mo | $209,000 | $79 | 61 |
| 1311 Cherry Stone St | 0.60mi | 3/2.0 | 2,489 (+5%) | 5mo | $230,000 | $92 | 58 |
| 1617 Avondale Dr | 0.17mi | 4/2.5 (+1) | 2,016 (-15%) | 2mo | $295,000 | $146 | 57 |
| 1201 Westlawn Dr | 0.43mi | 4/3.0 (+1) | 2,275 (-4%) | 9mo | $375,000 | $165 | 54 |
| 826 Nancy Lynn Ter | 0.34mi | 4/2.0 (+1) | 2,061 (-13%) | 4mo | $280,000 | $136 | 52 |
| 518 S Flood Ave | 0.71mi | 3/2.0 | 2,280 (-4%) | 8mo | $446,400 | $196 | 52 |
| 1222 Camden Way | 0.36mi | 4/2.0 (+1) | 2,030 (-14%) | 1mo | $365,000 | $180 | 51 |
| 531 S Berry Rd | 0.48mi | 4/2.0 (+1) | 2,587 (+9%) | 7mo | $340,000 | $131 | 50 |
| 1802 Logan Dr | 0.72mi | 3/2.5 | 2,155 (-9%) | 1mo | $259,000 | $120 | 47 |
| 823 S Flood Ave | 0.74mi | 3/2.0 | 2,640 (+11%) | 9mo | $700,000 | $265 | 37 |
Match score weights: distance 35% · size 25% · config 20% · recency 20%. Top-matched comps best support the ARV.
Projected returns pro-forma
-3.0% appreciation · 7.66% rent growth · sell at horizon
- IRR
- -12.7%
- Equity multiple
- 0.52×
- Total profit
- $-37,915
- Equity at exit
- $42,494
- IRR
- 2.0%
- Equity multiple
- 1.17×
- Total profit
- $13,886
- Equity at exit
- $24,642
Cash invested: $79,800 (down + closing). Projections, not guarantees.
Landlord ↔ Tenant lean methodology
- Overall (STATE)
- 83 Strongly Landlord-Friendly
- State Oklahoma
- 83 Strongly Landlord-Friendly · R+20
- County
- — inherits STATE
- City
- — inherits STATE
ZIP-level market 73069
- Rents YoY
- 7.7%
- Active inventory
- 250
- Price-to-rent
- 10.4×
Monthly cashflow live
- Estimated rent
- $2,292 high interval (Pro) →
- Mortgage (P&I)
- −$1,495
- Tax from tax record
- −$244 /mo · $2,922/yr
- Insurance
- −$119
- HOA
- −$0
- Vacancy / Maint / Mgmt
- −$481
- Net cashflow
- $-46
Break-even live
UW: 25.0% down · 7.5% · 30yr · 1.5% tax · 5.0% vac · 8.0% maint · 8.0% mgmt
Financing live
Cash to close
- Down payment
- $71,250
- Closing costs
- $8,550
- Reserves months
- —
- Total cash needed
- —
Loan-product check · same deal, 3 products live
Conventional
25% down · 7.5% · 30yr
- Down + closing
- —
- Monthly P&I
- —
- Monthly cashflow
- —
- DSCR
- —
- Eligible?
- —
Personal DTI + credit; lowest rate.
DSCR
20% down · 8.5% · 30yr
- Down + closing
- —
- Monthly P&I
- —
- Monthly cashflow
- —
- DSCR
- —
- Eligible?
- —
No personal income docs; deal must DSCR.
Hard money
10% down · 12.0% · 12mo
- Down + closing
- —
- Monthly P&I
- —
- Monthly cashflow
- —
- DSCR
- —
- Eligible?
- —
Short-term bridge; refi at stabilization.
Rent comps 9 comps
| Address | Beds | Baths | Sqft | Rent | $/sqft | DOM | Units | Dist |
|---|---|---|---|---|---|---|---|---|
| 1214 Cruce St Norman, OK | 4.0 | 2.0 | 1882 | $3,200 | $1.70 | 11d | 1 | 0.20mi |
| 1219 Leslie Ln Norman, OK | 4.0 | 2.5 | 1875 | $2,495 | $1.33 | 14d | 1 | 0.21mi |
| 1222 Camden Way Norman, OK | 4.0 | 2.0 | 2030 | $2,600 | $1.28 | 14d | 1 | 0.33mi |
| 1215 Westlawn Dr Norman, OK | 3.0 | 2.0 | 1795 | $2,195 | $1.22 | 14d | 1 | 0.34mi |
| 1404 Melrose Dr Norman, OK | 3.0 | 2.0 | 2259 | $1,925 | $0.85 | 23d | 1 | 0.44mi |
| 1213 Westbrooke Ter Norman, OK | 3.0 | 2.0 | 1612 | $2,100 | $1.30 | 23d | 1 | 0.93mi |
| 421 Foreman Ave Norman, OK | 4.0 | 2.0 | 2070 | $2,600 | $1.26 | 11d | 1 | 0.93mi |
| 1008 Woods Ave Norman, OK | 3.0 | 1.5 | 1690 | $1,500 | $0.89 | 11d | 1 | 1.36mi |
| 2805 Belknap Ave #2807 Norman, OK | 3.0 | 4.0 | 3142 | $1,700 | $0.54 | 14d | 1 | 1.37mi |
Listing history 17 events
-
2026-05-21status Active
-
2026-05-06status Pending
-
2026-04-27price $285,000
-
2026-04-06price $289,000
-
2025-11-05$299,000 Active
-
2025-10-30historical
-
2025-10-20price $310,000
-
2025-07-25price $320,000
-
2025-07-15price $325,000
-
2025-06-04price $329,900
-
2025-05-27price $339,000
-
2025-04-16price $342,000
-
2025-04-02$349,000 Active
-
2015-01-16soldstatus $173,000
-
2015-01-15soldstatus $173,000 383-char remark
Show marketing remark (383 chars)
Location and Care! This home has been so well taken care of. Beautiful original hardwood floors! Lots of living space and tons of storage. Nice garage conversion off of kitchen. New carpet in garage conversion. Newer interior paint. 2010 new new HVAC, 2013 new roof, installed new insulation in in attic, sprinkle system,, nice wood deck in backyard for entertaining, 2 storgae sheds
-
2015-01-15soldstatus $173,000
Show marketing remark (383 chars)
Location and Care! This home has been so well taken care of. Beautiful original hardwood floors! Lots of living space and tons of storage. Nice garage conversion off of kitchen. New carpet in garage conversion. Newer interior paint. 2010 new new HVAC, 2013 new roof, installed new insulation in in attic, sprinkle system,, nice wood deck in backyard for entertaining, 2 storgae sheds
-
2014-12-08$184,900 383-char remark
Show marketing remark (383 chars)
Location and Care! This home has been so well taken care of. Beautiful original hardwood floors! Lots of living space and tons of storage. Nice garage conversion off of kitchen. New carpet in garage conversion. Newer interior paint. 2010 new new HVAC, 2013 new roof, installed new insulation in in attic, sprinkle system,, nice wood deck in backyard for entertaining, 2 storgae sheds
ⓘ Source: listings_history table (triggers on properties + properties_extension) + one-shot
backfill from property_details.listing_events for pre-trigger history.
Tax reassessment forecast OK · Resets to sale price
- Current annual tax
- $2,922 · $244/mo
- Projected year-2 tax
- $2,922 · $244/mo
- Expected delta
- $0/yr ($0/mo · 0.0%)
ⓘ Screening estimate from a state-policy table — verify with the county assessor before closing.
Climate risk First Street
- Flood 1/10 Low FEMA zone X (unshaded) · 0% chance over 30 yrs
- Wildfire 2/10 Low
- Heat 6/10 Major 7 d/yr ≥108°F today · 19 d/yr by 30 yrs out
- Wind 3/10 Moderate 4% chance of damaging wind over 30 yrs
- Air quality 2/10 Low 1 unhealthy d/yr today · 1 by 30 yrs out
Nearby sold comps map
Loading sold comps map…
Walkable amenities ~0.75 mi
Loading nearby amenities…
Taxation est. · year 1
- Rental income
- $27,502
- − Mortgage interest
- −$15,964
- − Property taxes
- −$2,922
- − Insurance
- −$1,425
- − Repairs & maintenance
- −$2,200
- − Management
- −$2,200
- − Depreciation
- −$8,291
- Taxable loss
- −$5,501
- Est. tax savings @ 24.0%
- +$1,320
- After-tax cash flow
- $765/yr
For passive investors: Depreciation is non-cash, so a rental often shows a tax loss while cash-flowing — sheltering income. Rental losses are passive: they offset passive income freely, and up to $25,000/yr can offset ordinary (W-2) income if you actively participate and your MAGI is under $100k (phasing out to $0 by $150k); unused losses carry forward. On sale, claimed depreciation is recaptured at up to 25%, and gains may owe capital-gains tax (a 1031 exchange can defer both). Figures are a year-1 estimate at your 24.0% rate — not tax advice; consult a CPA.
Schools (NCES district)
- District
- Norman
- NCES district ID
- 4021720
- Math proficiency
- 27% ▼ -9.00%
- Reading proficiency
- 32% ▼ -8.00%
- Median HH income
- $48,940
- Composite
- 25.67/100
- National rank
- #7395
- State rank
- #61 of 270 in OK
Livability — Norman
- Score
- 85/100
- State rank
- #1
- US rank
- #557
Category grades
Schools grade is shown separately in the Schools card above.
Census & demographics
- Census place
- Norman, OK
- County
- Cleveland County · 239,547 people
- City population
- 123,141
- Metro
- Oklahoma City, OK
- Population (ZIP)
- 28,462
- Household income
- $58,888
- Rent vs Own
- Severe rent burden
- 1704.0
Population outlook (Cleveland County) Hauer SSP2
- Today (2025)
- 323,621 people
- By 2030
- 349,070 · +7.9%
- By 2040
- 400,168 · +23.7%
- By 2050
- 454,101 · +40.3%
- By 2075
- 602,926 · +86.3%
- By 2100
- 734,485 · +127.0%
Race, ethnicity, and origin ACS 2023
- Neighborhood character
- Diverse neighborhood (Simpson 0.56)
- Race & ethnicity
- White 64% Two or more races 15% Hispanic / Latino 14% Native American 4% Black 4% Asian 3% Pacific Islander 1%
- Hispanic origin (detail)
- Mexican 9%
- Common ancestry
- Lithuanian 3% Italian 3% Slovak 2%
- Foreign-born
- 9% · Canada, China
- Languages at home
- 84% English-only · Spanish 10% Other Indo-European 1% Chinese 1%
Political lean MEDSL · Cleveland
- 2024 margin
- R (+14.9) · D 41.4% · R 56.4% · Other 2.2%
- 2008→2024 swing
- +9.1pp toward D · 2008: -24.0pp · 2024: -14.9pp
- All cycles
- 2024: R+14.9 2020: R+14.1 2016: R+21.7 2012: R+25.9 2008: R+24.0
Not yet ingested
- Civics
- —
Market trends
- HPI YoY
- ▼ -252.79%
- Current HPI
- 272.4754
- Rent YoY
- ▲ 7.66%
- Metro
- Oklahoma City, OK
- State GDP YoY
- ▲ 1.55%
- F500 in state
- 6
Industry mix (Fortune 500 HQ in OK)
| Industry | F500 HQs | Revenue |
|---|---|---|
| Energy | 3 | $48B |
|
||
Price history
+54.1% since first listed17 events — show timeline
- 2026-05-21 Relisted — MLSOK
- 2026-05-06 Pending — MLSOK
- 2026-04-27 Price Changed $285,000 MLSOK
- 2026-04-06 Price Changed $289,000 MLSOK
- 2025-11-05 Listed $299,000 MLSOK
- 2025-10-30 Listing Removed — MLSOK
- 2025-10-20 Price Changed $310,000 MLSOK
- 2025-07-25 Price Changed $320,000 MLSOK
- 2025-07-15 Price Changed $325,000 MLSOK
- 2025-06-04 Price Changed $329,900 MLSOK
- 2025-05-27 Price Changed $339,000 MLSOK
- 2025-04-16 Price Changed $342,000 MLSOK
- 2025-04-02 Listed $349,000 MLSOK
- 2015-01-16 Sold (Public Records) $173,000 Public Records
- 2015-01-15 Sold (MLS) $173,000 MLSOK
- 2015-01-15 Sold (MLS) $173,000 MLSOK
- 2014-12-08 Listed $184,900 MLSOK
Property tax history
+4.4%/yrLatest (2024): $2,922 · +4.7% YoY. Source: county tax records.
Cash-flow waterfall
monthlySold comps — $/sqft
last 12 mo · ≤1 miLoading sold comps…