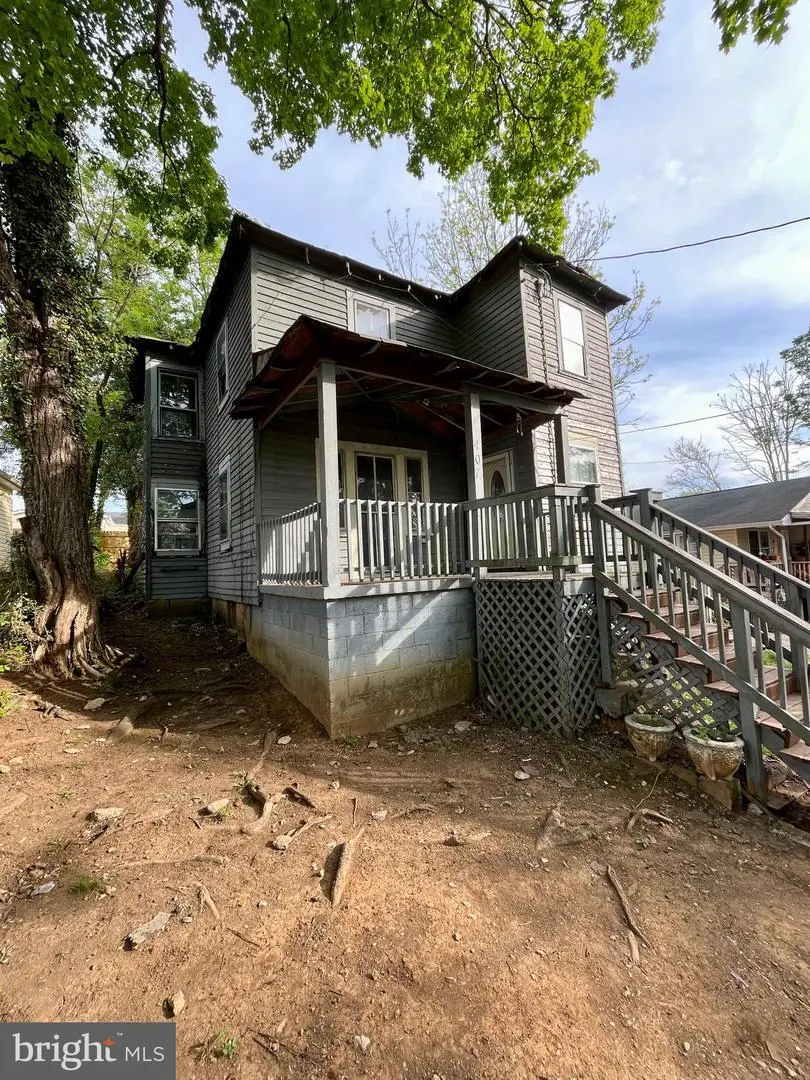
407 Carruthers St · Lexington, VA
Flood risk 1/10 · Minimal
- FEMA flood zone
- X (unshaded)
- Chance of flooding over 30 yrs
- 0.0%
- Est. flood insurance / yr
- $473 – $860
Fire risk 3/10 · Minor
- Est. fire insurance / yr
- $666 – $1,236
Heat risk 6/10 · Moderate
- Hot days now (above 102°F)
- 7 days/yr
- Hot days in 30 yrs
- 19 days/yr
Wind risk 2/10 · Minimal
- Chance of severe wind over 30 yrs
- 1.0%
Air-quality risk 1/10 · Minimal
- Unhealthy air days now
- 0 days/yr
- Unhealthy air days in 30 yrs
- 0 days/yr
Risk factors via First Street. Map © Google.
Why this score? — see what drove the B+ grade
The composite is a weighted blend of 9 inputs, each scored 0–100. Each bar is that input's sub-score; the figure is the points it added to the 100-point composite (weight × sub-score).
- Cash flow +30.0/30.0
- ARV discount +15.0/15.0
- DSCR +10.0/10.0
- 1% rule +8.8/10.0
- Schools +7.1/10.0
- Livability +4.0/5.0
- Rent growth +2.5/5.0
- Condition / age +2.5/5.0
- Appreciation +0.0/10.0
$157,000
🖨 Deal sheet (PDF) 📄 Offer letter ✓ Due diligence
Listing remarks MLS
2 Story house within walking distance to downtown Lexington, VMi and W & L. Being sold in 'AS IS' condition. Call today to schedule a viewing!!
Key facts
- Quiet street
- Private back yard
- Minutes from i81
Tags
Property features AI
Finance
- Financial info: Fee simple ownership; Lease not in effect and lease not considered; No rent control
Exterior
- Parking: On-street parking
- Utilities: Public water; Public sewer; No municipal trash service
- Home design: Detached property; Estimated year built
- Construction: Mixed construction materials; Brick/mortar foundation; Building not winterized
- Exterior features: Not in a federal flood zone; No tidal water on property; No buildout allowance indicated; Pets allowed with no pet restrictions; Above-grade other structures present
Interior
- Bedrooms: Three bedrooms on the first upper level; One bedroom on the main level
- Bathrooms: One full bathroom (all upper levels)
- Heating & cooling: Forced air heating; Natural gas heat; Electric hot water
- Interior features: Smoking is not allowed; Unfinished basement
Neighborhood map
What this means for you Summary
Snapshot
- This is a 4-bed/1.0-bath single-family listed at $157k.
Deal economics
- At list price, monthly cash flow is $722 ($9k/yr) — positive.
- The deal already cash-flows at list — no discount required.
- Meets the 1% rule at list price ($2k rent vs $157k).
- Recommended offer: $148k (6.0% below list) — sets the bar for market timing.
- Cap rate 11.8% vs local median 3.3% in Lexington — top-decile yield for the area; either an underpriced asset or a hidden risk that comps aren't pricing in. Stress-test before assuming the spread holds.
Location & tenants
- Location reads 80/100 on livability (#62 in VA, #1,813 nationally) — a professional / high-income tenant draw. Strengths: schools A+, crime A+, amenities A+; Watch: commute F.
- Lexington City Public School District (town): math 82% / reading 88% proficiency, ranked #4 of 131 in VA (top 3%) — strong family-tenant draw, lease renewals of 3-5y typical; only 18% free/reduced lunch — higher-income household profile.
- Market conditions: 148 active listings in the ZIP; 1 comparable units currently listed for rent nearby; solid renter incomes; 1 units permitted in Lexington city in 2024 (0 in 5+ unit buildings).
- This rent runs 34% of the median local income ($77k/yr) — at the standard rent-burdened threshold; future hikes will face affordability resistance.
Forward outlook
- Local home prices are declining (-3.0%/yr); year-one equity from $1k of loan paydown is wiped out by about $5k of value loss. Plan a longer hold.
- Lexington County population projected at +17% by 2050 — long-run rental-demand tailwind backs the buy-and-hold thesis.
- At projected returns (-3.0% appreciation + 3.0% rent growth), your $44k cash investment doubles in ~7 years — after that, you're playing with house money.
Negotiation context
- It's been on market 70 days — a 6% lower offer ($148k) is reasonable based on typical stale-listing flexibility.
- 3 sale attempts since 2y ago with the ask held roughly flat each time — persistent listings suggest the price (not the market) is what's stuck; bring a comps-based counter.
- Current owner paid $130k; 21% above their basis — modest negotiation headroom, anchor on the comps not their cost.
Risks & watch-outs
- Watch-outs: built in 1932 — expect roof / HVAC / electrical / plumbing capex.
- Climate carrying-cost: extreme-heat days projected 7→19/yr by 2055 (HVAC capex compounding) — expect insurance premiums to compound above CPI over the hold.
Questions for the listing agent
- It's been on market 70 days. Have you received any prior offers? Is the seller open to a 6% concession, seller financing, or rate buy-down credit?
- Built in 1932 — when were the roof, HVAC, electrical panel, plumbing, and water heater last replaced?
- Why hasn't it sold? Are there any deal-killer items the seller is aware of (foundation, flood, title, zoning, code violations)?
- Is there a deadline driving the sale (1031 exchange, divorce, estate, relocation)? That informs how much negotiation room exists.
- Schools are A-rated — typically a magnet for longer-tenancy family renters. What's the average tenant stay here, and is there a school-zone premium baked into asking?
- What's the average days-on-market for RENTAL listings here right now (not sales)? A rising rental-DOM trend means longer vacancies and softer asking-rent achievability than the comps imply.
- What's the recent tenant-quality profile in this submarket — average credit score on applications, eviction rate, late-payment / NSF rate, and stable-employment percentage? A property-management company in the area should have these aggregated.
- How much new for-sale + rental construction is in the pipeline within 1–3 miles? Heavy new supply typically softens prices + rents 12–24 months out; constrained supply supports both.
Investment metrics
- 1% rule
- 1.38% ✓
- Cap rate
- 11.81%
- Cash-on-cash
- 19.70%
- DSCR
- 1.88
- GRM
- 6.1
CMA / ARV
- ARV (on-the-fly)
- $306,000
- Comps found
- 11
Show comp detail 11 sales within ~0.75 mi
| Address | Dist | Beds/Ba | Sqft | Sold | Price | $/sf | Match |
|---|---|---|---|---|---|---|---|
| 308 Massie St | 0.19mi | 3/2.0 (-1) | 1,478 (-3%) | 5mo | $281,000 | $190 | 72 |
| 224 N Randolph St | 0.10mi | 4/1.0 | 1,300 (-15%) | 8mo | $170,000 | $131 | 64 |
| 416 Morningside Dr | 0.34mi | 3/2.0 (-1) | 1,551 (+1%) | 15mo | $540,000 | $348 | 60 |
| 320 N Lewis St | 0.24mi | 3/2.5 (-1) | 1,462 (-4%) | 13mo | $385,000 | $263 | 60 |
| 412 Morningside Dr | 0.32mi | 3/1.5 (-1) | 1,442 (-6%) | 12mo | $250,000 | $173 | 58 |
| 415 Wills Rd | 0.33mi | 3/2.5 (-1) | 1,471 (-4%) | 16mo | $330,000 | $224 | 54 |
| 11 Tucker St | 0.27mi | 3/2.0 (-1) | 1,692 (+11%) | 12mo | $300,000 | $177 | 51 |
| 110 E Mcdowell St | 0.59mi | 3/1.0 (-1) | 1,377 (-10%) | 1mo | $275,000 | $200 | 50 |
| 15 Poyntz Place Pl | 0.32mi | 3/2.0 (-1) | 1,408 (-8%) | 20mo | $345,000 | $245 | 46 |
| 13 Hunter Hill, Extension Rd | 0.66mi | 4/2.0 | 1,577 (+3%) | 19mo | $420,000 | $266 | 44 |
| 214 Walker St | 0.72mi | 4/2.0 | 1,443 (-6%) | 23mo | $220,000 | $152 | 34 |
Match score weights: distance 35% · size 25% · config 20% · recency 20%. Top-matched comps best support the ARV.
Projected returns pro-forma
-3.0% appreciation · 3.0% rent growth · sell at horizon
- IRR
- 11.8%
- Equity multiple
- 1.47×
- Total profit
- $20,496
- Equity at exit
- $23,409
- IRR
- 20.7%
- Equity multiple
- 2.75×
- Total profit
- $76,920
- Equity at exit
- $13,574
Cash invested: $43,960 (down + closing). Projections, not guarantees.
Landlord ↔ Tenant lean methodology
- Overall (STATE)
- 55 Moderately Landlord-Leaning
- State Virginia
- 55 Moderately Landlord-Leaning · D+2
- County
- — inherits STATE
- City
- — inherits STATE
ZIP-level market 24450
- Home prices YoY
- -22.8%
- Active inventory
- 148
- Price-to-rent
- 6.1×
Monthly cashflow live
- Estimated rent
- $2,162 medium interval (Pro) →
- Mortgage (P&I)
- −$823
- Tax from tax record
- −$98 /mo · $1,174/yr
- Insurance
- −$65
- HOA
- −$0
- Vacancy / Maint / Mgmt
- −$454
- Net cashflow
- $722
Break-even live
Sensitivity live
| Price | -10% $811 | -5% $766 | +0% $722 | +5% $677 | +10% $633 |
|---|---|---|---|---|---|
| Rent | -10% $551 | -5% $636 | +0% $722 | +5% $807 | +10% $893 |
| Rate | -1.0pp $801 | -0.5pp $762 | base $722 | +0.5pp $681 | +1.0pp $640 |
UW: 25.0% down · 7.5% · 30yr · 1.5% tax · 5.0% vac · 8.0% maint · 8.0% mgmt
Financing live
Cash to close
- Down payment
- $39,250
- Closing costs
- $4,710
- Reserves months
- —
- Total cash needed
- —
Loan-product check · same deal, 3 products live
Conventional
25% down · 7.5% · 30yr
- Down + closing
- —
- Monthly P&I
- —
- Monthly cashflow
- —
- DSCR
- —
- Eligible?
- —
Personal DTI + credit; lowest rate.
DSCR
20% down · 8.5% · 30yr
- Down + closing
- —
- Monthly P&I
- —
- Monthly cashflow
- —
- DSCR
- —
- Eligible?
- —
No personal income docs; deal must DSCR.
Hard money
10% down · 12.0% · 12mo
- Down + closing
- —
- Monthly P&I
- —
- Monthly cashflow
- —
- DSCR
- —
- Eligible?
- —
Short-term bridge; refi at stabilization.
Rent comps 1 comps
| Address | Beds | Baths | Sqft | Rent | $/sqft | DOM | Units | Dist |
|---|---|---|---|---|---|---|---|---|
| 3 Jean Francis DR Lexington, VA | 3.0 | 2.0 | 1200 | $2,200 | $1.83 | 15d | 1 | 0.43mi |
Listing history 36 events
-
2026-06-18days on market $157,000 Active 70 DOM
-
2026-06-17days on market $157,000 Active 69 DOM
-
2026-06-16days on market $157,000 Active 68 DOM
-
2026-06-15days on market $157,000 Active 67 DOM
-
2026-06-14days on market $157,000 Active 65 DOM
-
2026-06-13days on market $157,000 Active 64 DOM
-
2026-06-10days on market $157,000 Active 62 DOM
-
2026-06-09days on market $157,000 Active 61 DOM
-
2026-06-08days on market $157,000 Active 60 DOM
-
2026-06-07days on market $157,000 Active 59 DOM
-
2026-06-03days on market $157,000 Active 55 DOM
-
2026-06-02days on market $157,000 Active 54 DOM
-
2026-06-01days on market $157,000 Active 53 DOM
-
2026-05-31days on market $157,000 Active 52 DOM
-
2026-05-31days on market $157,000 Active 51 DOM
-
2026-05-15price $157,000
-
2026-04-30price $158,000
-
2026-04-09$159,000 Active
-
2026-02-11historical
-
2025-10-17price $160,000
-
2025-10-06price $162,500
-
2025-09-12price $165,000
-
2025-08-14price $167,500
-
2025-08-08price $169,000
-
2025-07-18price $169,500
-
2025-06-20price $170,000
-
2025-06-06price $172,500
-
2025-05-24price $175,000
-
2025-05-16price $180,000
-
2025-05-09price $190,000
-
2025-04-24$195,000 Active
-
2025-04-11soldstatus $130,000
-
2025-04-10soldstatus $130,000 Closed 147-char remark
Show marketing remark (147 chars)
2 Story house within walking distance to downtown Lexington, VMi and W & L. Being sold in 'AS IS' condition. Call today to schedule a viewing!!
-
2025-02-18status Pending 147-char remark
Show marketing remark (147 chars)
2 Story house within walking distance to downtown Lexington, VMi and W & L. Being sold in 'AS IS' condition. Call today to schedule a viewing!!
-
2025-01-03price $150,000 147-char remark
Show marketing remark (147 chars)
2 Story house within walking distance to downtown Lexington, VMi and W & L. Being sold in 'AS IS' condition. Call today to schedule a viewing!!
-
2024-10-30$160,000 Active 147-char remark
Show marketing remark (147 chars)
2 Story house within walking distance to downtown Lexington, VMi and W & L. Being sold in 'AS IS' condition. Call today to schedule a viewing!!
ⓘ Source: listings_history table (triggers on properties + properties_extension) + one-shot
backfill from property_details.listing_events for pre-trigger history.
Tax reassessment forecast VA · Resets to sale price
- Current annual tax
- $1,174 · $98/mo
- Projected year-2 tax
- $1,287 · $107/mo
- Expected delta
- +$113/yr (+$9/mo · 9.7%)
ⓘ Screening estimate from a state-policy table — verify with the county assessor before closing.
Climate risk First Street
- Flood 1/10 Low FEMA zone X (unshaded) · 0% chance over 30 yrs
- Wildfire 3/10 Moderate
- Heat 6/10 Major 7 d/yr ≥102°F today · 19 d/yr by 30 yrs out
- Wind 2/10 Low 100% chance of damaging wind over 30 yrs
- Air quality 1/10 Low 0 unhealthy d/yr today · 0 by 30 yrs out
Nearby sold comps map
Loading sold comps map…
Walkable amenities ~0.75 mi
Loading nearby amenities…
Taxation est. · year 1
- Rental income
- $25,948
- − Mortgage interest
- −$8,794
- − Property taxes
- −$1,174
- − Insurance
- −$785
- − Repairs & maintenance
- −$2,076
- − Management
- −$2,076
- − Depreciation
- −$4,567
- Taxable income
- $6,476
- Est. tax owed @ 24.0%
- −$1,554
- After-tax cash flow
- $7,106/yr
For passive investors: Depreciation is non-cash, so a rental often shows a tax loss while cash-flowing — sheltering income. Rental losses are passive: they offset passive income freely, and up to $25,000/yr can offset ordinary (W-2) income if you actively participate and your MAGI is under $100k (phasing out to $0 by $150k); unused losses carry forward. On sale, claimed depreciation is recaptured at up to 25%, and gains may owe capital-gains tax (a 1031 exchange can defer both). Figures are a year-1 estimate at your 24.0% rate — not tax advice; consult a CPA.
Schools (NCES district)
- District
- Lexington City Public School District
- NCES district ID
- 5102220
- Math proficiency
- 82% ▼ -9.00%
- Reading proficiency
- 88% ▬ 0.00%
- Median HH income
- $37,249
- Composite
- 70.57/100
- National rank
- #258
- State rank
- #4 of 131 in VA
Livability — Lexington
- Score
- 80/100
- State rank
- #62
- US rank
- #1813
Category grades
Schools grade is shown separately in the Schools card above.
Census & demographics
- Census place
- Lexington, VA
- County
- Rockbridge County · 17,714 people
- City population
- 17,714
- Metro
- nan
- Population (ZIP)
- 17,714
- Household income
- $76,587
- Rent vs Own
- Severe rent burden
- 429.0
Population outlook (Lexington County) Hauer SSP2
- Today (2025)
- 8,814 people
- By 2030
- 9,156 · +3.9%
- By 2040
- 9,636 · +9.3%
- By 2050
- 10,345 · +17.4%
- By 2075
- 12,696 · +44.0%
- By 2100
- 14,268 · +61.9%
Race, ethnicity, and origin ACS 2023
- Neighborhood character
- Predominantly White (86%)
- Race & ethnicity
- White 86% Two or more races 5% Black 4% Hispanic / Latino 3% Asian 2%
- Common ancestry
- Serbian 4% Italian 2% Slovak 2%
- Foreign-born
- 4% · China, Canada, South Korea
- Languages at home
- 95% English-only · Spanish 2% Chinese 1% Korean 1%
Political lean MEDSL · Lexington
- 2024 margin
- Strong D (+26.7) · D 62.7% · R 36.0% · Other 1.3%
- 2008→2024 swing
- +1.3pp toward D · 2008: 25.4pp · 2024: 26.7pp
- All cycles
- 2024: D+26.7 2020: D+32.0 2016: D+30.6 2012: D+12.6 2008: D+25.4
Not yet ingested
- Civics
- —
Market trends
- HPI YoY
- ▼ -83.84%
- Current HPI
- 283.7394
- Rent YoY
- —
- Metro
- nan
- State GDP YoY
- ▲ 2.40%
- F500 in state
- 50
Industry mix (Fortune 500 HQ in VA)
| Industry | F500 HQs | Revenue |
|---|---|---|
| Aerospace / Defense | 4 | $236B |
|
||
| Technology / Defense | 3 | $32B |
|
||
| Financial Services | 2 | $176B |
|
||
| Utilities | 2 | $27B |
|
||
| Insurance | 2 | $25B |
|
||
| Technology | 2 | $15B |
|
||
Price history
-1.9% since first listed21 events — show timeline
- 2026-05-15 Price Changed $157,000 BRIGHT MLS
- 2026-04-30 Price Changed $158,000 BRIGHT MLS
- 2026-04-09 Listed $159,000 BRIGHT MLS
- 2026-02-11 Listing Removed — BRIGHT MLS
- 2025-10-17 Price Changed $160,000 BRIGHT MLS
- 2025-10-06 Price Changed $162,500 BRIGHT MLS
- 2025-09-12 Price Changed $165,000 BRIGHT MLS
- 2025-08-14 Price Changed $167,500 BRIGHT MLS
- 2025-08-08 Price Changed $169,000 BRIGHT MLS
- 2025-07-18 Price Changed $169,500 BRIGHT MLS
- 2025-06-20 Price Changed $170,000 BRIGHT MLS
- 2025-06-06 Price Changed $172,500 BRIGHT MLS
- 2025-05-24 Price Changed $175,000 BRIGHT MLS
- 2025-05-16 Price Changed $180,000 BRIGHT MLS
- 2025-05-09 Price Changed $190,000 BRIGHT MLS
- 2025-04-24 Listed $195,000 BRIGHT MLS
- 2025-04-11 Sold (Public Records) $130,000 Public Records
- 2025-04-10 Sold (MLS) $130,000 RHR
- 2025-02-18 Pending — RHR
- 2025-01-03 Price Changed $150,000 RHR
- 2024-10-30 Listed $160,000 RHR
Property tax history
+7.1%/yrLatest (2025): $1,174 · +0.0% YoY. Source: county tax records.
Cash-flow waterfall
monthlySold comps — $/sqft
last 12 mo · ≤1 miLoading sold comps…