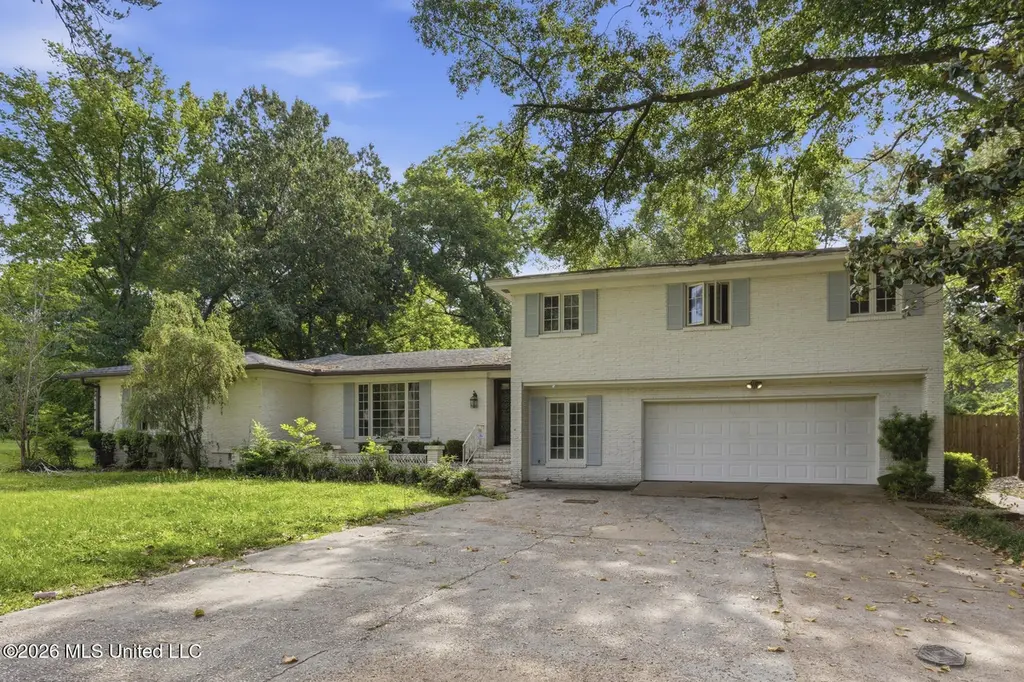
111 Dow St · Mendenhall, MS
Flood risk 1/10 · Minimal
- FEMA flood zone
- X (unshaded)
- Chance of flooding over 30 yrs
- 0.0%
- Est. flood insurance / yr
- $507 – $1,088
Fire risk 4/10 · Minor
- Est. fire insurance / yr
- $1,241 – $2,305
Heat risk 8/10 · Major
- Hot days now (above 107°F)
- 7 days/yr
- Hot days in 30 yrs
- 21 days/yr
Wind risk 8/10 · Major
- Chance of severe wind over 30 yrs
- 80.0%
Air-quality risk 1/10 · Minimal
- Unhealthy air days now
- 0 days/yr
- Unhealthy air days in 30 yrs
- 0 days/yr
Risk factors via First Street. Map © Google.
Why this score? — see what drove the D grade
The composite is a weighted blend of 9 inputs, each scored 0–100. Each bar is that input's sub-score; the figure is the points it added to the 100-point composite (weight × sub-score).
- Appreciation +10.0/10.0
- Cash flow +8.0/30.0
- ARV discount +7.5/15.0
- 1% rule +5.0/10.0
- Livability +3.0/5.0
- Rent growth +2.5/5.0
- Condition / age +2.5/5.0
- DSCR +2.1/10.0
- Schools +1.7/10.0
$139,999
🖨 Deal sheet 📄 Offer letter ✓ Due diligence
Listing remarks
You do not want to miss out on this massive 5-bedroom, 3.5-bath, 4,500 sq ft home in the quaint downtown area of Mendenhall. This property has the bones of an absolute dream home and is ready to be completely restored to its former glory! The layout is incredibly spacious, boasting a large kitchen, dining, and wide-open living area flooded with natural light from a giant front window bank. Bring your flooring team to revive the original hardwoods that ground this home's contemporary, yet traditional style. The footprint of the kitchen is huge, complete with a drop-in range space, double wall ovens, and tons of storage. Upstairs, the expansive master suite is a blank canvas ready to feature
Key facts
- Original hardwoods
- Huge bonus space
- Large kitchen
Tags
Property features AI
Finance
- Other: Lot approximately 0.61 acres
- Financial info: Financial details not provided
- HOA & community: No HOA information provided
Exterior
- Parking: 2 total parking spaces; 2-car garage facing front
- Security: No security features provided
- Utilities: Public water; Public sewer; Electricity connected; Natural gas connected; Water connected
- Home design: Single-family residence (house); One and one-half stories; Fixer condition
- Construction: Brick construction; Composition/shingle roof; Conventional foundation; Built year available from public records
- Exterior features: Private in-ground outdoor pool; Patio (slab)
Interior
- Kitchen: Cooktop; Electric cooktop; Double oven; Microwave; Dishwasher; Refrigerator; Electric water heater
- Bedrooms: Bedrooms information not provided
- Flooring: Tile floors; Wood floors
- Bathrooms: 3 full bathrooms; 1 half bathroom
- Heating & cooling: Central heating; Fireplace heating; Central air conditioning; Ceiling fans; Gas cooling/heating connection
- Interior features: Double vanity; Entrance foyer; Soaking tub; Storage; Walk-in closets; Living room fireplace; Metal windows
- Laundry & utility: Dedicated laundry room
Neighborhood map
What this means for you Summary
Snapshot
- This is a 5-bed/2.0-bath single-family listed at $140k.
Deal economics
- At list price, monthly cash flow is $-142 ($-2k/yr) — negative.
- To cash-flow at today's rent, offer at most $115k (18.0% below list).
- Meets the 1% rule at list price ($1k rent vs $140k).
- Recommended offer: $115k (18.0% below list) — sets the bar for cash-flow.
- Cap rate 5.1% vs local median 3.2% in Mendenhall — top-decile yield for the area; either an underpriced asset or a hidden risk that comps aren't pricing in. Stress-test before assuming the spread holds.
Location & tenants
- Location reads 60/100 on livability (#220 in MS) — a middle-class / working-renter tenant base. Strengths: cost of living A+, crime A-; Watch: amenities F, commute F, employment F.
- Simpson County School District (rural): math 18% / reading 24% proficiency, ranked #90 of 130 in MS (top 69%) — low school quality limits family demand, transient renter base, plan for 1-2y turnover; 76% free/reduced lunch — lower-income household profile, screen leases tightly.
- Zoned schools: Mendenhall Elementary School (math 27% / reading 27%, grade F, #203 of 375 statewide, top 56%, 579 students, 100% FRL); Mendenhall Junior High School (math 14% / reading 24%, grade F, #119 of 179 statewide, top 66%, 243 students, 99% FRL); Mendenhall High School (math 8% / reading 22%, grade F, #150 of 197 statewide, top 76%, 519 students, 99% FRL) — zoned schools average 99% FRL vs 76% district-wide (24 pts higher); higher-poverty schools than district average — tighter screening recommended.
- Market conditions: 69 active listings in the ZIP; 3 units permitted in Simpson County in 2024 (0 in 5+ unit buildings).
Forward outlook
- In year one you build about $15k of equity ($968 loan paydown + $14k appreciation (10.0% local appreciation)).
- Simpson County population projected at -16% by 2050 — secular population decline; favor cash flow + early exit over multi-decade hold.
- By year 3, paydown + projected appreciation supports a ~$38k cash-out refi (75% LTV) — recoverable capital for the next deal without selling this one.
Negotiation context
- Only 14 days on market — expect competitive offers; lowballing is unlikely to land.
- 7 sale attempts since 22y ago; this cycle's ask has dropped $10k (7%) from the opening price — seller is motivated, your offer sets the floor, not the list.
Risks & watch-outs
- Watch-outs: property tax is 4.0% of price.
- Climate carrying-cost: severe wind risk, 80% chance of damaging wind over 30y; extreme-heat days projected 7→21/yr by 2055 (HVAC capex compounding) — expect insurance premiums to compound above CPI over the hold.
Questions for the listing agent
- What do current leases actually rent for vs. the listed asking? Can we see a recent rent roll and the last 12 months of T-12 income?
- Built in 1960 — when were the roof, HVAC, electrical panel, plumbing, and water heater last replaced?
- Property tax is high relative to price — has the assessment been appealed recently, and will the sale trigger a re-assessment?
- Is there a deadline driving the sale (1031 exchange, divorce, estate, relocation)? That informs how much negotiation room exists.
- Schools are F-rated, which usually means shorter tenancies and higher turnover. Who's the typical renter profile here, and what's been the actual vacancy rate?
- The area grade is low — what's the realistic commute time and amenity access for the typical tenant pool here? Any planned neighborhood developments (good or bad) we should know about?
- What's the average days-on-market for RENTAL listings here right now (not sales)? A rising rental-DOM trend means longer vacancies and softer asking-rent achievability than the comps imply.
- What's the recent tenant-quality profile in this submarket — average credit score on applications, eviction rate, late-payment / NSF rate, and stable-employment percentage? A property-management company in the area should have these aggregated.
- How much new for-sale + rental construction is in the pipeline within 1–3 miles? Heavy new supply typically softens prices + rents 12–24 months out; constrained supply supports both.
Investment metrics
- 1% rule
- 1.00% ✓
- Cap rate
- 5.07%
- Cash-on-cash
- -4.36%
- DSCR
- 0.81
- GRM
- 8.3
CMA / ARV
No comps found within radius.
Projected returns pro-forma
10.0% appreciation · 3.0% rent growth · sell at horizon
- IRR
- 21.2%
- Equity multiple
- 2.72×
- Total profit
- $67,371
- Equity at exit
- $126,122
- IRR
- 19.2%
- Equity multiple
- 6.25×
- Total profit
- $205,924
- Equity at exit
- $271,987
Cash invested: $39,200 (down + closing). Projections, not guarantees.
Landlord ↔ Tenant lean methodology
- Overall (STATE)
- 90 Strongly Landlord-Friendly
- State Mississippi
- 90 Strongly Landlord-Friendly · R+11
- County
- — inherits STATE
- City
- — inherits STATE
ZIP-level market 39114
- Home prices YoY
- 7.9%
- Active inventory
- 69
- Price-to-rent
- 8.3×
Monthly cashflow live
- Estimated rent
- $1,407 medium interval (Pro) →
- Mortgage (P&I)
- −$734
- Tax from tax record
- −$461 /mo · $5,534/yr
- Insurance
- −$58
- HOA
- −$0
- Vacancy / Maint / Mgmt
- −$295
- Net cashflow
- $-142
Break-even live
UW: 25.0% down · 7.5% · 30yr · 1.5% tax · 5.0% vac · 8.0% maint · 8.0% mgmt
Financing live
Cash to close
- Down payment
- $35,000
- Closing costs
- $4,200
- Reserves months
- —
- Total cash needed
- —
Loan-product check · same deal, 3 products live
Conventional
25% down · 7.5% · 30yr
- Down + closing
- —
- Monthly P&I
- —
- Monthly cashflow
- —
- DSCR
- —
- Eligible?
- —
Personal DTI + credit; lowest rate.
DSCR
20% down · 8.5% · 30yr
- Down + closing
- —
- Monthly P&I
- —
- Monthly cashflow
- —
- DSCR
- —
- Eligible?
- —
No personal income docs; deal must DSCR.
Hard money
10% down · 12.0% · 12mo
- Down + closing
- —
- Monthly P&I
- —
- Monthly cashflow
- —
- DSCR
- —
- Eligible?
- —
Short-term bridge; refi at stabilization.
Listing history 18 events
-
2026-06-07statusdays on market $139,999 Pending 14 DOM
-
2026-06-04days on market $139,999 Active 13 DOM
-
2026-06-02pricedays on market $139,999 Active 12 DOM
-
2026-06-01days on market $150,000 Active 11 DOM
-
2026-05-31days on market $150,000 Active 10 DOM
-
2026-05-22$150,000 Active
-
2021-10-08historical
-
2021-10-01historical
-
2019-09-03soldstatus
-
2019-02-08$199,900
-
2017-02-23$239,900
-
2017-02-14historical
-
2016-08-10$274,900
-
2014-12-19soldstatus
-
2014-09-11$84,900
-
2007-05-24soldstatus
-
2007-03-29$199,900
-
2004-07-08$216,900
ⓘ Source: listings_history table (triggers on properties + properties_extension) + one-shot
backfill from property_details.listing_events for pre-trigger history.
Tax reassessment forecast MS · Resets to sale price
- Current annual tax
- $5,534 · $461/mo
- Projected year-2 tax
- $5,534 · $461/mo
- Expected delta
- $0/yr ($0/mo · 0.0%)
ⓘ Screening estimate from a state-policy table — verify with the county assessor before closing.
Climate risk First Street
- Flood 1/10 Low FEMA zone X (unshaded) · 0% chance over 30 yrs
- Wildfire 4/10 Moderate
- Heat 8/10 Severe 7 d/yr ≥107°F today · 21 d/yr by 30 yrs out
- Wind 8/10 Severe 80% chance of damaging wind over 30 yrs
- Air quality 1/10 Low 0 unhealthy d/yr today · 0 by 30 yrs out
Nearby sold comps map
Loading sold comps map…
Walkable amenities ~0.75 mi
Loading nearby amenities…
Taxation est. · year 1
- Rental income
- $16,879
- − Mortgage interest
- −$7,842
- − Property taxes
- −$5,534
- − Insurance
- −$700
- − Repairs & maintenance
- −$1,350
- − Management
- −$1,350
- − Depreciation
- −$4,073
- Taxable loss
- −$3,970
- Est. tax savings @ 24.0%
- +$953
- After-tax cash flow
- $-757/yr
For passive investors: Depreciation is non-cash, so a rental often shows a tax loss while cash-flowing — sheltering income. Rental losses are passive: they offset passive income freely, and up to $25,000/yr can offset ordinary (W-2) income if you actively participate and your MAGI is under $100k (phasing out to $0 by $150k); unused losses carry forward. On sale, claimed depreciation is recaptured at up to 25%, and gains may owe capital-gains tax (a 1031 exchange can defer both). Figures are a year-1 estimate at your 24.0% rate — not tax advice; consult a CPA.
Schools (NCES district)
- District
- Simpson County School District
- NCES district ID
- 2803990
- Math proficiency
- 18% ▼ -14.00%
- Reading proficiency
- 24% ▼ -9.00%
- Median HH income
- $36,826
- Composite
- 17.46/100
- National rank
- #9063
- State rank
- #90 of 130 in MS
Livability — Mendenhall
- Score
- 60/100
- State rank
- #220
- US rank
- #19070
Category grades
Schools grade is shown separately in the Schools card above.
Census & demographics
- Census place
- Mendenhall, MS
- Population (ZIP)
- 10,553
Population outlook (Simpson County) Hauer SSP2
- Today (2025)
- 26,197 people
- By 2030
- 25,474 · -2.8%
- By 2040
- 23,811 · -9.1%
- By 2050
- 22,024 · -15.9%
- By 2075
- 17,701 · -32.4%
- By 2100
- 13,732 · -47.6%
Race, ethnicity, and origin ACS 2023
- Neighborhood character
- Majority White (58%)
- Race & ethnicity
- White 58% Black 39% Two or more races 2%
- Common ancestry
- Italian 3% Slovak 2% Lithuanian 2%
- Foreign-born
- 1%
- Languages at home
- 98% English-only · French/Haitian/Cajun 1% Other Indo-European 1%
Political lean MEDSL · Simpson
- 2024 margin
- Solid R (+36.7) · D 31.4% · R 68.1%
- 2008→2024 swing
- -14.3pp toward R · 2008: -22.4pp · 2024: -36.7pp
- All cycles
- 2024: R+36.7 2020: R+30.4 2016: R+30.9 2012: R+22.1 2008: R+22.4
Not yet ingested
- Civics
- —
Market trends
- HPI YoY
- ▲ 21.04%
- Current HPI
- 286.42
- Rent YoY
- —
- Metro
- —
- State GDP YoY
- —
- F500 in state
- 0
Price history
-30.8% since first listed13 events — show timeline
- 2026-05-22 Listed $150,000 MLSU
- 2021-10-08 Listing Removed — MLSU
- 2021-10-01 Listing Removed — MLSU
- 2019-09-03 Sold (MLS) — MLSU
- 2019-02-08 Listed $199,900 MLSU
- 2017-02-23 Listed $239,900 MLSU
- 2017-02-14 Listing Removed — MLSU
- 2016-08-10 Listed $274,900 MLSU
- 2014-12-19 Sold (MLS) — MLSU
- 2014-09-11 Listed $84,900 MLSU
- 2007-05-24 Sold (MLS) — MLSU
- 2007-03-29 Listed $199,900 MLSU
- 2004-07-08 Listed $216,900 MLSU
Property tax history
+4.5%/yrLatest (2025): $5,534 · +10.2% YoY. Source: county tax records.
Cash-flow waterfall
monthlySold comps — $/sqft
last 12 mo · ≤1 miLoading sold comps…