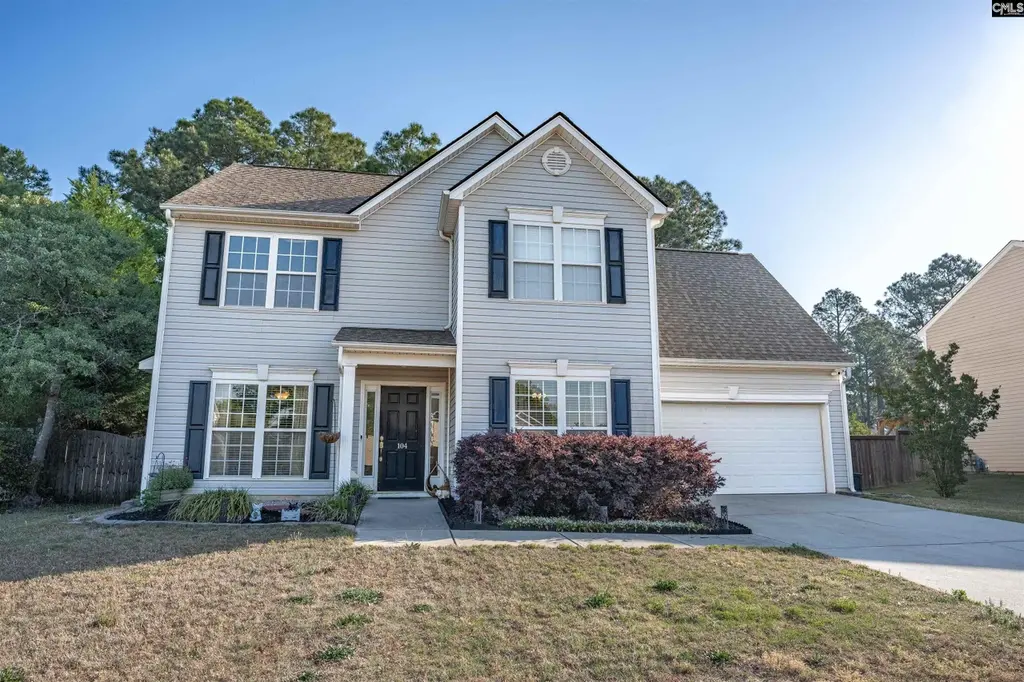
104 Coxton Mill Ln · White Knoll, SC
Flood risk 1/10 · Minimal
- FEMA flood zone
- X (unshaded)
- Chance of flooding over 30 yrs
- 0.0%
- Est. flood insurance / yr
- $507 – $1,088
Fire risk 5/10 · Moderate
- Est. fire insurance / yr
- $783 – $1,453
Heat risk 6/10 · Moderate
- Hot days now (above 107°F)
- 7 days/yr
- Hot days in 30 yrs
- 16 days/yr
Wind risk 6/10 · Moderate
- Chance of severe wind over 30 yrs
- 73.0%
Air-quality risk 3/10 · Minor
- Unhealthy air days now
- 2 days/yr
- Unhealthy air days in 30 yrs
- 2 days/yr
Risk factors via First Street. Map © Google.
Why this score? — see what drove the D- grade
The composite is a weighted blend of 9 inputs, each scored 0–100. Each bar is that input's sub-score; the figure is the points it added to the 100-point composite (weight × sub-score).
- Cash flow +13.2/30.0
- ARV discount +7.5/15.0
- Schools +4.2/10.0
- DSCR +4.0/10.0
- Rent growth +3.3/5.0
- 1% rule +2.5/10.0
- Livability +2.5/5.0
- Condition / age +2.5/5.0
- Appreciation +0.0/10.0
$270,000
🖨 Deal sheet (PDF) 📄 Offer letter ✓ Due diligence
Listing remarks
This 4-bedroom, 2.5-bath home has a layout that actually makes sense for how people live! The main level features a bright, open feel with a spacious great room centered around a cozy gas fireplace—perfect for relaxing nights or hosting friends. The kitchen is a standout, complete with granite countertops, a center island, tiled backsplash, and plenty of cabinet space, all flowing easily into the main living areas. Upstairs, you’ll find all four bedrooms, including a roomy primary suite with vaulted ceilings, a walk-in closet, and a private bath featuring a double vanity, garden tub, and separate shower. The additional bedrooms give flexibility for guests, a home office, or what
Key facts
- Cozy gas fireplace
- Tiled backsplash
- Great room
Tags
Property features AI
Finance
- Other: Community pool
- HOA & community: Homeowners association — community amenities include pool, playground, common area maintenance, street light maintenance and maintained green areas
Exterior
- Parking: Attached garage (main level) with 2 garage spaces; Total of 4 parking spaces
- Utilities: Public water; Public sewer
- Home design: Two‑story single family home; Vinyl exterior
- Construction: Slab foundation
- Exterior features: Covered front porch; Screened back porch; Full gutters; Sprinkler system; Storage shed; Privacy wood fence in rear
Interior
- Kitchen: Kitchen island; Granite countertops; Tile floor and tiled backsplash; Painted cabinets; Convection, free‑standing, smooth‑surface, self‑cleaning range; Dishwasher; Microwave above stove; Garbage disposal
- Bedrooms: Primary bedroom on second floor with double vanity, garden tub, separate shower, vaulted ceilings and ceiling fan; Three additional bedrooms on second floor — each with ceiling fan and private closet; Bedroom 2 includes walk-in closet and tub/shower
- Flooring: Tile floors in living and formal dining areas; Carpeted bedrooms
- Bathrooms: Two full bathrooms; One half bathroom; Additional full baths on second floor
- Heating & cooling: Central heating and cooling; Zoned HVAC with gas heating on both levels
- Interior features: Attic storage with pull-down access; Ceiling fans throughout; Smoke detector; Gas log (natural) fireplace
- Laundry & utility: Second‑floor laundry area; Closet laundry space; Tankless gas water heater
Neighborhood map
What this means for you Summary
Snapshot
- This is a 3-bed/2.5-bath single-family listed at $270k.
Deal economics
- At list price, monthly cash flow is $-5 ($-56/yr) — negative.
- To cash-flow at today's rent, offer at most $269k (0.3% below list).
- To meet the 1% rule (rent ≥ 1% of price), the offer needs to be $204k (24.5% below list).
- Recommended offer: $204k (24.5% below list) — sets the bar for 1% rule.
Location & tenants
- Location reads: area grade D — affects rentability + tenant quality, not the cash-flow math above.
- Lexington 01 (suburban): math 42% / reading 53% proficiency, ranked #11 of 80 in SC (top 14%) — families likely to look elsewhere, expect single-tenant / working-renter base with shorter leases.
- Zoned schools: Carolina Springs Elementary (math 34% / reading 34%, grade F, #359 of 597 statewide, top 60%, 850 students, 41% FRL); Carolina Springs Middle (math 25% / reading 39%, grade F, #119 of 229 statewide, top 54%, 914 students, 46% FRL); White Knoll High (math 47% / reading 85%, grade B, #81 of 196 statewide, top 42%, 2,204 students, 45% FRL).
- Market conditions: Rents rising (+3.2%/yr); 572 active listings in the ZIP; 6 comparable units currently listed for rent nearby; rentals at typical pace (median 24d on market — plan ~3-4 weeks tenant-placement turnaround); solid renter incomes; 1,712 units permitted in Lexington County in 2024 (0 in 5+ unit buildings).
- This rent runs 32% of the median local income ($77k/yr) — at the standard rent-burdened threshold; future hikes will face affordability resistance.
Forward outlook
- Local home prices are declining (-3.0%/yr); year-one equity from $2k of loan paydown is wiped out by about $8k of value loss. Plan a longer hold.
- Lexington County population projected at +26% by 2050 — long-run rental-demand tailwind backs the buy-and-hold thesis.
Negotiation context
- It's been on market 21 days — a 2% lower offer ($266k) is reasonable based on typical stale-listing flexibility.
- Current owner paid $174k; list at $270k implies a 56% gain — meaningful room to come down on a strong offer.
Risks & watch-outs
- Climate carrying-cost: major wind risk, 73% chance of damaging wind over 30y; moderate wildfire risk; extreme-heat days projected 7→16/yr by 2055 (HVAC capex compounding) — expect insurance premiums to compound above CPI over the hold.
Questions for the listing agent
- What do current leases actually rent for vs. the listed asking? Can we see a recent rent roll and the last 12 months of T-12 income?
- Is there a deadline driving the sale (1031 exchange, divorce, estate, relocation)? That informs how much negotiation room exists.
- The area grade is low — what's the realistic commute time and amenity access for the typical tenant pool here? Any planned neighborhood developments (good or bad) we should know about?
- What's the average days-on-market for RENTAL listings here right now (not sales)? A rising rental-DOM trend means longer vacancies and softer asking-rent achievability than the comps imply.
- What's the recent tenant-quality profile in this submarket — average credit score on applications, eviction rate, late-payment / NSF rate, and stable-employment percentage? A property-management company in the area should have these aggregated.
- How much new for-sale + rental construction is in the pipeline within 1–3 miles? Heavy new supply typically softens prices + rents 12–24 months out; constrained supply supports both.
Investment metrics
- 1% rule
- 0.75% ✗
- Cap rate
- 6.27%
- Cash-on-cash
- -0.07%
- DSCR
- 1.00
- GRM
- 11.0
CMA / ARV
No comps found within radius.
Projected returns pro-forma
-3.0% appreciation · 3.24% rent growth · sell at horizon
- IRR
- -16.3%
- Equity multiple
- 0.42×
- Total profit
- $-43,680
- Equity at exit
- $40,258
- IRR
- -7.7%
- Equity multiple
- 0.51×
- Total profit
- $-36,887
- Equity at exit
- $23,345
Cash invested: $75,600 (down + closing). Projections, not guarantees.
Landlord ↔ Tenant lean methodology
- Overall (STATE)
- 90 Strongly Landlord-Friendly
- State South Carolina
- 90 Strongly Landlord-Friendly · R+6
- County
- — inherits STATE
- City
- — inherits STATE
ZIP-level market 29073
- Home prices YoY
- -19.1%
- Rents YoY
- 3.2%
- Active inventory
- 572
- Price-to-rent
- 11.0×
Monthly cashflow live
- Estimated rent
- $2,038 high interval (Pro) →
- Mortgage (P&I)
- −$1,416
- Tax from tax record
- −$87 /mo · $1,039/yr
- Insurance
- −$112
- HOA
- −$0
- Vacancy / Maint / Mgmt
- −$428
- Net cashflow
- $-5
Break-even live
Sensitivity live
| Price | -10% $148 | -5% $72 | +0% $-5 | +5% $-81 | +10% $-158 |
|---|---|---|---|---|---|
| Rent | -10% $-166 | -5% $-85 | +0% $-5 | +5% $76 | +10% $156 |
| Rate | -1.0pp $131 | -0.5pp $64 | base $-5 | +0.5pp $-75 | +1.0pp $-146 |
UW: 25.0% down · 7.5% · 30yr · 1.5% tax · 5.0% vac · 8.0% maint · 8.0% mgmt
Financing live
Cash to close
- Down payment
- $67,500
- Closing costs
- $8,100
- Reserves months
- —
- Total cash needed
- —
Loan-product check · same deal, 3 products live
Conventional
25% down · 7.5% · 30yr
- Down + closing
- —
- Monthly P&I
- —
- Monthly cashflow
- —
- DSCR
- —
- Eligible?
- —
Personal DTI + credit; lowest rate.
DSCR
20% down · 8.5% · 30yr
- Down + closing
- —
- Monthly P&I
- —
- Monthly cashflow
- —
- DSCR
- —
- Eligible?
- —
No personal income docs; deal must DSCR.
Hard money
10% down · 12.0% · 12mo
- Down + closing
- —
- Monthly P&I
- —
- Monthly cashflow
- —
- DSCR
- —
- Eligible?
- —
Short-term bridge; refi at stabilization.
Rent comps 6 comps
| Address | Beds | Baths | Sqft | Rent | $/sqft | DOM | Units | Dist |
|---|---|---|---|---|---|---|---|---|
| 123 Brevard Pkwy Lexington, SC | 1.0–3.0 | 1.0–2.0 | 1097 | $1,275 | $1.16 | 4d | 1 | 0.26mi |
| 432 Cape Jasmine Way Lexington, SC | 4.0 | 2.5 | 1600 | $2,049 | $1.28 | 5d | 1 | 0.37mi |
| 473 Walking Ln Lexington, SC | 3.0 | 2.5 | 1835 | $2,100 | $1.14 | 25d | 1 | 0.41mi |
| 307 Savannah Hills Dr Lexington, SC | 3.0 | 2.5 | 1612 | $1,985 | $1.23 | 25d | 1 | 0.64mi |
| 2237 Trakand Dr Lexington, SC | 3.0 | 2.5 | 1962 | $1,975 | $1.01 | 4d | 1 | 0.69mi |
| 237 Tea Olive Ave Lexington, SC | 3.0 | 2.5 | 2448 | $2,099 | $0.86 | 23d | 1 | 0.72mi |
Listing history 6 events
-
2026-05-20status Pending
-
2026-05-05historical Active - Contingent
-
2026-04-28$270,000 Active
-
2018-05-30soldstatus $173,500
-
2015-07-20soldstatus $154,900
-
2008-08-12soldstatus $162,000
ⓘ Source: listings_history table (triggers on properties + properties_extension) + one-shot
backfill from property_details.listing_events for pre-trigger history.
Tax reassessment forecast SC · Resets to sale price
- Current annual tax
- $1,039 · $87/mo
- Projected year-2 tax
- $1,539 · $128/mo
- Expected delta
- +$500/yr (+$42/mo · 48.1%)
ⓘ Screening estimate from a state-policy table — verify with the county assessor before closing.
Climate risk First Street
- Flood 1/10 Low FEMA zone X (unshaded) · 0% chance over 30 yrs
- Wildfire 5/10 Major
- Heat 6/10 Major 7 d/yr ≥107°F today · 16 d/yr by 30 yrs out
- Wind 6/10 Major 73% chance of damaging wind over 30 yrs
- Air quality 3/10 Moderate 2 unhealthy d/yr today · 2 by 30 yrs out
Nearby sold comps map
Loading sold comps map…
Walkable amenities ~0.75 mi
Loading nearby amenities…
Taxation est. · year 1
- Rental income
- $24,461
- − Mortgage interest
- −$15,124
- − Property taxes
- −$1,039
- − Insurance
- −$1,350
- − Repairs & maintenance
- −$1,957
- − Management
- −$1,957
- − Depreciation
- −$7,855
- Taxable loss
- −$4,821
- Est. tax savings @ 24.0%
- +$1,157
- After-tax cash flow
- $1,101/yr
For passive investors: Depreciation is non-cash, so a rental often shows a tax loss while cash-flowing — sheltering income. Rental losses are passive: they offset passive income freely, and up to $25,000/yr can offset ordinary (W-2) income if you actively participate and your MAGI is under $100k (phasing out to $0 by $150k); unused losses carry forward. On sale, claimed depreciation is recaptured at up to 25%, and gains may owe capital-gains tax (a 1031 exchange can defer both). Figures are a year-1 estimate at your 24.0% rate — not tax advice; consult a CPA.
Schools (NCES district)
- District
- Lexington 01
- NCES district ID
- 4502700
- Math proficiency
- 42% ▼ -12.00%
- Reading proficiency
- 53% ▼ -2.00%
- Median HH income
- $61,298
- Composite
- 41.75/100
- National rank
- #3399
- State rank
- #11 of 80 in SC
Livability — White Knoll
No livability data for this city. (Only ~50 U.S. cities are tracked.)
Census & demographics
- Census place
- White Knoll, SC
- County
- Lexington County · 232,571 people
- City population
- 51,471
- Metro
- Columbia, SC
- Population (ZIP)
- 53,156
- Household income
- $77,229
- Rent vs Own
- Severe rent burden
- 935.0
Population outlook (Lexington County) Hauer SSP2
- Today (2025)
- 322,999 people
- By 2030
- 342,356 · +6.0%
- By 2040
- 377,715 · +16.9%
- By 2050
- 406,984 · +26.0%
- By 2075
- 465,447 · +44.1%
- By 2100
- 485,674 · +50.4%
Race, ethnicity, and origin ACS 2023
- Neighborhood character
- Predominantly White (72%)
- Race & ethnicity
- White 72% Black 14% Two or more races 7% Hispanic / Latino 6% Asian 2%
- Hispanic origin (detail)
- Mexican 2% Puerto Rican 1%
- Common ancestry
- Romanian 3% Italian 2% Slovak 1%
- Foreign-born
- 4% · Canada, China
- Languages at home
- 93% English-only · Spanish 5% Other Indo-European 1%
Political lean MEDSL · Lexington
- 2024 margin
- Solid R (+33.5) · D 32.5% · R 66.0% · Other 1.4%
- 2008→2024 swing
- +4.6pp toward D · 2008: -38.0pp · 2024: -33.5pp
- All cycles
- 2024: R+33.5 2020: R+30.1 2016: R+36.7 2012: R+37.8 2008: R+38.0
Not yet ingested
- Civics
- —
Market trends
- HPI YoY
- ▼ -59.20%
- Current HPI
- 249.8957
- Rent YoY
- ▲ 3.24%
- Metro
- Columbia, SC
- State GDP YoY
- ▲ 4.51%
- F500 in state
- 2
Industry mix (Fortune 500 HQ in SC)
| Industry | F500 HQs | Revenue |
|---|---|---|
| Packaging | 1 | $7B |
|
||
Price history
+66.7% since first listed6 events — show timeline
- 2026-05-20 Pending — Consolidated MLS
- 2026-05-05 Contingent — Consolidated MLS
- 2026-04-28 Listed $270,000 Consolidated MLS
- 2018-05-30 Sold (Public Records) $173,500 Public Records
- 2015-07-20 Sold (Public Records) $154,900 Public Records
- 2008-08-12 Sold (Public Records) $162,000 Public Records
Property tax history
-10.2%/yrLatest (2024): $1,039 · +4.4% YoY. Source: county tax records.
Cash-flow waterfall
monthlySold comps — $/sqft
last 12 mo · ≤1 miLoading sold comps…