7941 Maggie Ln · Townsend, TN
Flood risk 6/10 · Moderate
- FEMA flood zone
- X (unshaded)
- Chance of flooding over 30 yrs
- 0.7%
- Est. flood insurance / yr
- $507 – $1,088
Fire risk 6/10 · Moderate
- Est. fire insurance / yr
- $949 – $1,763
Heat risk 7/10 · Major
- Hot days now (above 100°F)
- 7 days/yr
- Hot days in 30 yrs
- 22 days/yr
Wind risk 2/10 · Minimal
- Chance of severe wind over 30 yrs
- —
Air-quality risk 4/10 · Minor
- Unhealthy air days now
- 5 days/yr
- Unhealthy air days in 30 yrs
- 6 days/yr
Risk factors via First Street. Map © Google.
Why this score? — see what drove the B+ grade
The composite is a weighted blend of 9 inputs, each scored 0–100. Each bar is that input's sub-score; the figure is the points it added to the 100-point composite (weight × sub-score).
- Cash flow +30.0/30.0
- DSCR +10.0/10.0
- Appreciation +10.0/10.0
- 1% rule +8.9/10.0
- ARV discount +7.5/15.0
- Livability +3.4/5.0
- Schools +2.6/10.0
- Rent growth +2.5/5.0
- Condition / age +2.5/5.0
$69,000
🖨 Deal sheet (PDF) 📄 Offer letter ✓ Due diligence
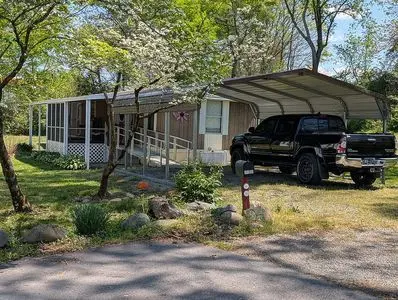
Listing remarks
House was built in1982 and has been owned by my mother-in-law for several years. It is located in a small, one street, mobile home park in Townsend, TN. The location is very private and most do not know that it is there. Townsend is located next to the entrance to the Great Smoky Mountain National Park. It is 30 minutes from Pigeon Forge and 40 minutes from Gatlinburg. This home is the last unit on the street and on a cul-de-sac. Private location, as the lot you see to the right is empty and too small for another mobile home. This is a two bedroom, two bath unit which is being sold fully furnished. The furnace is electric and she had a new mini split installed last Spring. The mini split pr
Key facts
- Septic for sewer
- New mini split
- City water
Tags
Neighborhood map
What this means for you Summary
Snapshot
- This is a 2-bed/2.0-bath manufactured listed at $69k.
Deal economics
- At list price, monthly cash flow is $281 ($3k/yr) — positive.
- The deal already cash-flows at list — no discount required.
- Meets the 1% rule at list price ($959 rent vs $69k).
- Recommended offer: $68k (1.5% below list) — sets the bar for market timing.
- Cap rate 11.2% vs local median 0.8% in Townsend — top-decile yield for the area; either an underpriced asset or a hidden risk that comps aren't pricing in. Stress-test before assuming the spread holds.
Location & tenants
- Location reads 68/100 on livability (#88 in TN) — a middle-class / working-renter tenant base. Strengths: housing A+, employment A, cost of living A; Watch: schools C-, amenities F, commute F.
- Blount County (rural): math 29% / reading 31% proficiency, ranked #52 of 139 in TN (top 37%) — families likely to look elsewhere, expect single-tenant / working-renter base with shorter leases.
- Market conditions: 140 active listings in the ZIP; 937 units permitted in Blount County in 2024 (57 in 5+ unit buildings).
Forward outlook
- In year one you build about $7k of equity ($477 loan paydown + $7k appreciation (10.0% local appreciation)).
- Blount County population projected at +8% by 2050 — modest demand growth; plan on rents tracking national, not racing it.
- At projected returns (10.0% appreciation + 3.0% rent growth), your $19k cash investment doubles in ~2 years — after that, you're playing with house money.
- By year 5, paydown + projected appreciation supports a ~$34k cash-out refi (75% LTV) — recoverable capital for the next deal without selling this one.
Negotiation context
- It's been on market 24 days — a 2% lower offer ($68k) is reasonable based on typical stale-listing flexibility.
- 2 sale attempts since 24y ago; this cycle's ask has dropped $10k (13%) from the opening price — seller is motivated, your offer sets the floor, not the list.
Risks & watch-outs
- Climate carrying-cost: major flood risk; major wildfire risk; extreme-heat days projected 7→22/yr by 2055 (HVAC capex compounding) — expect insurance premiums to compound above CPI over the hold.
Questions for the listing agent
- Is there a deadline driving the sale (1031 exchange, divorce, estate, relocation)? That informs how much negotiation room exists.
- What's the average days-on-market for RENTAL listings here right now (not sales)? A rising rental-DOM trend means longer vacancies and softer asking-rent achievability than the comps imply.
- What's the recent tenant-quality profile in this submarket — average credit score on applications, eviction rate, late-payment / NSF rate, and stable-employment percentage? A property-management company in the area should have these aggregated.
- How much new for-sale + rental construction is in the pipeline within 1–3 miles? Heavy new supply typically softens prices + rents 12–24 months out; constrained supply supports both.
Investment metrics
- 1% rule
- 1.39% ✓
- Cap rate
- 11.18%
- Cash-on-cash
- 17.44%
- DSCR
- 1.78
- GRM
- 6.0
CMA / ARV
No comps found within radius.
Projected returns pro-forma
10.0% appreciation · 3.0% rent growth · sell at horizon
- IRR
- 37.2%
- Equity multiple
- 3.87×
- Total profit
- $55,480
- Equity at exit
- $62,161
- IRR
- 32.1%
- Equity multiple
- 8.73×
- Total profit
- $149,342
- Equity at exit
- $134,052
Cash invested: $19,320 (down + closing). Projections, not guarantees.
Landlord ↔ Tenant lean methodology
- Overall (STATE)
- 87 Strongly Landlord-Friendly
- State Tennessee
- 87 Strongly Landlord-Friendly · R+13
- County
- — inherits STATE
- City
- — inherits STATE
ZIP-level market 37882
- Home prices YoY
- 30.4%
- Active inventory
- 140
- Price-to-rent
- 6.0×
Monthly cashflow live
- Estimated rent
- $959 medium interval (Pro) →
- Mortgage (P&I)
- −$362
- Tax est. 1.5%
- −$86 /mo · $1,035/yr
- Insurance
- −$29
- HOA
- −$0
- Vacancy / Maint / Mgmt
- −$201
- Net cashflow
- $281
Break-even live
Sensitivity live
| Price | -10% $329 | -5% $305 | +0% $281 | +5% $257 | +10% $233 |
|---|---|---|---|---|---|
| Rent | -10% $205 | -5% $243 | +0% $281 | +5% $319 | +10% $357 |
| Rate | -1.0pp $316 | -0.5pp $298 | base $281 | +0.5pp $263 | +1.0pp $245 |
UW: 25.0% down · 7.5% · 30yr · 1.5% tax · 5.0% vac · 8.0% maint · 8.0% mgmt
Financing live
Cash to close
- Down payment
- $17,250
- Closing costs
- $2,070
- Reserves months
- —
- Total cash needed
- —
Loan-product check · same deal, 3 products live
Conventional
25% down · 7.5% · 30yr
- Down + closing
- —
- Monthly P&I
- —
- Monthly cashflow
- —
- DSCR
- —
- Eligible?
- —
Personal DTI + credit; lowest rate.
DSCR
20% down · 8.5% · 30yr
- Down + closing
- —
- Monthly P&I
- —
- Monthly cashflow
- —
- DSCR
- —
- Eligible?
- —
No personal income docs; deal must DSCR.
Hard money
10% down · 12.0% · 12mo
- Down + closing
- —
- Monthly P&I
- —
- Monthly cashflow
- —
- DSCR
- —
- Eligible?
- —
Short-term bridge; refi at stabilization.
Listing history 17 events
-
2026-06-18days on market $69,000 Active 24 DOM
-
2026-06-17days on market $69,000 Active 23 DOM
-
2026-06-16pricedays on market $69,000 Active 22 DOM
-
2026-06-15days on market $79,000 Active 21 DOM
-
2026-06-14days on market $79,000 Active 19 DOM
-
2026-06-13days on market $79,000 Active 18 DOM
-
2026-06-10days on market $79,000 Active 16 DOM
-
2026-06-09days on market $79,000 Active 15 DOM
-
2026-06-08days on market $79,000 Active 14 DOM
-
2026-06-07days on market $79,000 Active 13 DOM
-
2026-06-03days on market $79,000 Active 9 DOM
-
2026-06-02days on market $79,000 Active 8 DOM
-
2026-06-01days on market $79,000 Active 7 DOM
-
2026-05-31days on market $79,000 Active 6 DOM
-
2026-05-31days on market $79,000 Active 5 DOM
-
2026-05-26$79,000 Active
-
2002-05-07$20,000
ⓘ Source: listings_history table (triggers on properties + properties_extension) + one-shot
backfill from property_details.listing_events for pre-trigger history.
Climate risk First Street
- Flood 6/10 Major FEMA zone X (unshaded) · 70% chance over 30 yrs
- Wildfire 6/10 Major
- Heat 7/10 Severe 7 d/yr ≥100°F today · 22 d/yr by 30 yrs out
- Wind 2/10 Low
- Air quality 4/10 Moderate 5 unhealthy d/yr today · 6 by 30 yrs out
Nearby sold comps map
Loading sold comps map…
Walkable amenities ~0.75 mi
Loading nearby amenities…
Taxation est. · year 1
- Rental income
- $11,509
- − Mortgage interest
- −$3,865
- − Property taxes
- −$1,035
- − Insurance
- −$345
- − Repairs & maintenance
- −$921
- − Management
- −$921
- − Depreciation
- −$2,007
- Taxable income
- $2,415
- Est. tax owed @ 24.0%
- −$580
- After-tax cash flow
- $2,790/yr
For passive investors: Depreciation is non-cash, so a rental often shows a tax loss while cash-flowing — sheltering income. Rental losses are passive: they offset passive income freely, and up to $25,000/yr can offset ordinary (W-2) income if you actively participate and your MAGI is under $100k (phasing out to $0 by $150k); unused losses carry forward. On sale, claimed depreciation is recaptured at up to 25%, and gains may owe capital-gains tax (a 1031 exchange can defer both). Figures are a year-1 estimate at your 24.0% rate — not tax advice; consult a CPA.
Schools (NCES district)
- District
- Blount County
- NCES district ID
- 4700300
- Math proficiency
- 29% ▼ -7.00%
- Reading proficiency
- 31% ▼ -2.00%
- Median HH income
- $47,764
- Composite
- 25.99/100
- National rank
- #7322
- State rank
- #52 of 139 in TN
Livability — Townsend
- Score
- 68/100
- State rank
- #88
- US rank
- #9561
Category grades
Schools grade is shown separately in the Schools card above.
Census & demographics
- Census place
- Townsend, TN
- Population (ZIP)
- 2,800
Population outlook (Blount County) Hauer SSP2
- Today (2025)
- 135,873 people
- By 2030
- 139,460 · +2.6%
- By 2040
- 144,767 · +6.5%
- By 2050
- 147,393 · +8.5%
- By 2075
- 151,597 · +11.6%
- By 2100
- 147,393 · +8.5%
Race, ethnicity, and origin ACS 2023
- Neighborhood character
- Predominantly White (97%)
- Race & ethnicity
- White 97% Two or more races 2%
- Common ancestry
- Lithuanian 4% Slovak 4% Serbian 3%
- Foreign-born
- 0%
Political lean MEDSL · Blount
- 2024 margin
- Solid R (+47.7) · D 25.5% · R 73.2% · Other 1.2%
- 2008→2024 swing
- -8.4pp toward R · 2008: -39.4pp · 2024: -47.7pp
- All cycles
- 2024: R+47.7 2020: R+44.2 2016: R+48.8 2012: R+45.7 2008: R+39.4
Not yet ingested
- Civics
- —
Market trends
- HPI YoY
- ▲ 134.85%
- Current HPI
- 577.9164
- Rent YoY
- —
- Metro
- —
- State GDP YoY
- ▲ 2.78%
- F500 in state
- 22
Industry mix (Fortune 500 HQ in TN)
| Industry | F500 HQs | Revenue |
|---|---|---|
| Healthcare | 3 | $91B |
|
||
| Retail | 3 | $72B |
|
||
| Transportation / Logistics | 1 | $88B |
|
||
| Paper / Packaging | 1 | $19B |
|
||
| Insurance | 1 | $13B |
|
||
| Energy | 1 | $12B |
|
||
Price history
+295.0% since first listed2 events — show timeline
- 2026-05-26 Listed $79,000 FSBO.com
- 2002-05-07 Listed $20,000 Knoxville MLS
Property tax history
+12.5%/yrLatest (2025): $66 · +0.0% YoY. Source: county tax records.
Cash-flow waterfall
monthlySold comps — $/sqft
last 12 mo · ≤1 miLoading sold comps…