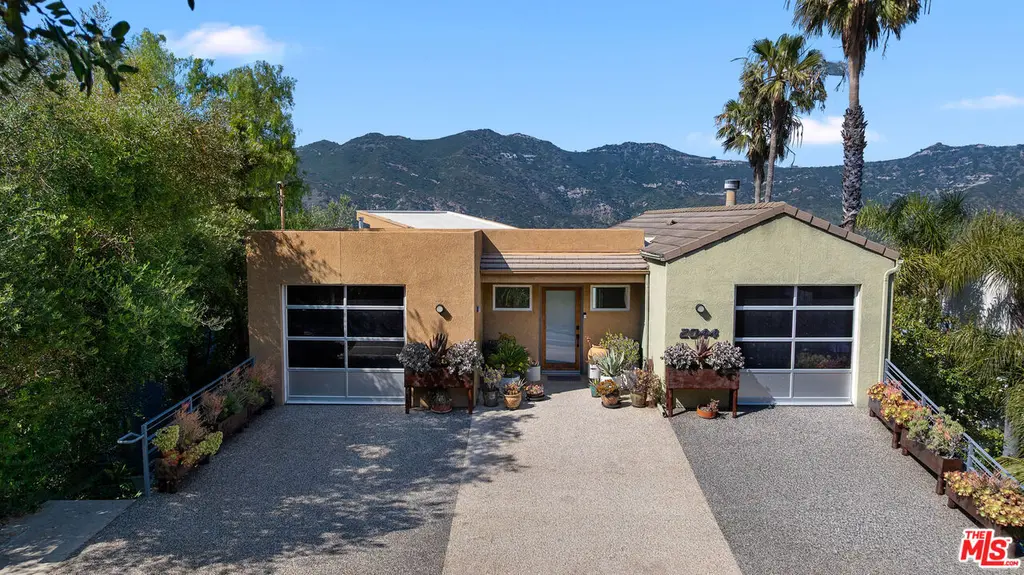
2044 Corral Canyon Rd · Malibu, CA
Flood risk 1/10 · Minimal
- FEMA flood zone
- X (unshaded)
- Chance of flooding over 30 yrs
- 0.0%
- Est. flood insurance / yr
- $507 – $1,088
Fire risk 5/10 · Moderate
- Est. fire insurance / yr
- $659 – $1,223
Heat risk 3/10 · Minor
- Hot days now (above 83°F)
- 7 days/yr
- Hot days in 30 yrs
- 20 days/yr
Wind risk 1/10 · Minimal
- Chance of severe wind over 30 yrs
- —
Air-quality risk 5/10 · Moderate
- Unhealthy air days now
- 7 days/yr
- Unhealthy air days in 30 yrs
- 7 days/yr
Risk factors via First Street. Map © Google.
Why this score? — see what drove the D+ grade
The composite is a weighted blend of 9 inputs, each scored 0–100. Each bar is that input's sub-score; the figure is the points it added to the 100-point composite (weight × sub-score).
- Cash flow +15.5/30.0
- Schools +6.2/10.0
- Appreciation +5.3/10.0
- DSCR +4.8/10.0
- ARV discount +3.9/15.0
- 1% rule +2.9/10.0
- Livability +2.7/5.0
- Condition / age +2.5/5.0
- Rent growth +1.7/5.0
$2,295,000
🖨 Deal sheet 📄 Offer letter ✓ Due diligence
Listing remarks
Architecturally designed and thoughtfully upgraded, this stunning 3-bedroom + den, 3.5-bath residence offers refined mountain and serene living in the heart of Malibu. Privately owned since new, the home showcases soaring ceilings, clean geometric lines, and glass framing sweeping views of the Santa Monica Mountains Conservancy. High-end finishes are featured throughout, including Carrara marble, Vermont slate, and rich Brazilian cherry wood floors. The open-concept layout is complemented by sun decks, glass railings, solid-core wood doors with frosted glass accents, and beautifully upgraded bathrooms finished in limestone and microcement. The property includes a rare flat, fenced yard idea
Key facts
- Fenced yard
- High-end finishes
- Mountain views
Tags
Property features AI
Finance
- Other: Coastal Commission special zoning; Zoning: LCR17500*
- Financial info: Listing terms: Cash to existing loan
Exterior
- Parking: Attached 2-car garage; Driveway parking; Covered parking for 2 vehicles; 3 additional open parking spaces; Guest parking available
- Utilities: Public (district) water; Septic sewer
- Home design: Detached single-family home; Two levels; Two total floors
- Construction: Stucco exterior
- Exterior features: Balcony; Deck(s); Living room balcony; Open patio; Private barbecue; High (9+ ft) ceilings; Rain gutters; Sliding glass doors; Custom built; Back yard; Canyon and greenbelt views; Has view
Interior
- Kitchen: Gas cooktop; Gas oven; Microwave; Marble counters; Kitchen island; Breakfast bar
- Bedrooms: All bedrooms on the ground level; Walk-in closet
- Flooring: Hardwood floors; Ceramic tile floors; Stone floors
- Bathrooms: One full bath; Two 3/4 baths; One half bath
- Heating & cooling: Central heat; Forced air heating; A/C; Water heater: Propane and electric
- Interior features: Furnished; Ground-level entry with no steps; Powder room; Sunken tub; Shower and tub; Family room; Living room; Formal entry; Separate family room; Entry room; Patio (open)
- Laundry & utility: Washer; Dryer; Laundry located in the garage; Gas or electric dryer hookup
Neighborhood map
What this means for you Summary
Snapshot
- This is a 4-bed/3.0-bath single-family listed at $2.29M.
Deal economics
- At list price, monthly cash flow is $918 ($11k/yr) — positive.
- The deal already cash-flows at list — no discount required.
- To meet the 1% rule (rent ≥ 1% of price), the offer needs to be $1.81M (21.2% below list).
- Recommended offer: $1.81M (21.2% below list) — sets the bar for 1% rule.
- Cap rate 6.8% vs local median 0.7% in Malibu — top-decile yield for the area; either an underpriced asset or a hidden risk that comps aren't pricing in. Stress-test before assuming the spread holds.
Location & tenants
- Location reads 53/100 on livability (#979 in CA) — a working-class tenant base; expect higher turnover. Strengths: employment A+, schools B; Watch: housing C-, crime F, amenities F.
- Santa Monica-Malibu Unified (urban): math 61% / reading 74% proficiency, ranked #123 of 1,400 in CA (top 9%) — acceptable for families but not a draw, mixed tenant base, ~2y average lease.
- Market conditions: Rents falling (-3.4%/yr); 627 active listings in the ZIP; 2 comparable units currently listed for rent nearby; high-income renter base; 19,697 units permitted in Los Angeles County in 2024 (9,426 in 5+ unit buildings).
- At $18,096/mo this rent would consume 110% of the median local household income ($197k/yr) (locally 420% of renters already pay >50% of income on rent) — very limited rent-growth headroom before tenants either downsize or default.
Forward outlook
- In year one you build about $30k of equity ($16k loan paydown + $14k appreciation (0.6% local appreciation)).
- Los Angeles County population projected at +9% by 2050 — modest demand growth; plan on rents tracking national, not racing it.
- By year 5, paydown + projected appreciation supports a ~$146k cash-out refi (75% LTV) — recoverable capital for the next deal without selling this one.
Negotiation context
- It's been on market 37 days — a 3% lower offer ($2.23M) is reasonable based on typical stale-listing flexibility.
- 6 sale attempts since 29y ago; this cycle's ask is 22850% above the opening price — seller raised mid-cycle; expect resistance to lowballs.
- Current owner paid $30k; list at $2.29M implies a 7550% gain — meaningful room to come down on a strong offer.
Risks & watch-outs
- Climate carrying-cost: moderate wildfire risk — expect insurance premiums to compound above CPI over the hold.
Questions for the listing agent
- It's been on market 37 days. Have you received any prior offers? Is the seller open to a 21% concession, seller financing, or rate buy-down credit?
- Is there a deadline driving the sale (1031 exchange, divorce, estate, relocation)? That informs how much negotiation room exists.
- Schools are B-rated — typically a magnet for longer-tenancy family renters. What's the average tenant stay here, and is there a school-zone premium baked into asking?
- Crime grade is F in this area — have there been break-ins, vandalism, or insurance claims at this property in the last 3 years? What carrier currently insures it and at what premium?
- The area grade is low — what's the realistic commute time and amenity access for the typical tenant pool here? Any planned neighborhood developments (good or bad) we should know about?
- What's the average days-on-market for RENTAL listings here right now (not sales)? A rising rental-DOM trend means longer vacancies and softer asking-rent achievability than the comps imply.
- What's the recent tenant-quality profile in this submarket — average credit score on applications, eviction rate, late-payment / NSF rate, and stable-employment percentage? A property-management company in the area should have these aggregated.
- How much new for-sale + rental construction is in the pipeline within 1–3 miles? Heavy new supply typically softens prices + rents 12–24 months out; constrained supply supports both.
Investment metrics
- 1% rule
- 0.79% ✗
- Cap rate
- 6.77%
- Cash-on-cash
- 1.71%
- DSCR
- 1.08
- GRM
- 10.6
CMA / ARV
- ARV (median comp)
- $2,126,000
- List price
- $2,295,000
- Delta
- 7.95%
- Verdict
- FAIR
- Comps
- 13 within 1.0 mi
Show comp detail 3 sales within ~0.75 mi
| Address | Dist | Beds/Ba | Sqft | Sold | Price | $/sf | Match |
|---|---|---|---|---|---|---|---|
| 26200 Lockwood Rd | 0.05mi | 4/3.5 | 2,752 (+8%) | 7mo | $2,075,000 | $754 | 76 |
| 26160 Fairside Rd | 0.12mi | 4/5.0 | 2,679 (+5%) | 12mo | $2,420,000 | $903 | 68 |
| 26335 Lockwood Rd | 0.14mi | 3/3.0 (-1) | 2,230 (-12%) | 5mo | $2,126,000 | $953 | 64 |
Match score weights: distance 35% · size 25% · config 20% · recency 20%. Top-matched comps best support the ARV.
Projected returns pro-forma
0.62% appreciation · 0.0% rent growth · sell at horizon
- IRR
- 0.1%
- Equity multiple
- 1.01×
- Total profit
- $4,545
- Equity at exit
- $738,183
- IRR
- 3.5%
- Equity multiple
- 1.39×
- Total profit
- $248,621
- Equity at exit
- $946,858
Cash invested: $642,600 (down + closing). Projections, not guarantees.
Landlord ↔ Tenant lean methodology
- Overall (STATE)
- 18 Strongly Tenant-Friendly
- State California
- 18 Strongly Tenant-Friendly · D+13
- County
- — inherits STATE
- City
- — inherits STATE
ZIP-level market 90265
- Home prices YoY
- 0.1%
- Rents YoY
- -3.4%
- Active inventory
- 627
- Price-to-rent
- 10.6×
Monthly cashflow live
- Estimated rent
- $18,096 medium interval (Pro) →
- Mortgage (P&I)
- −$12,035
- Tax from tax record
- −$386 /mo · $4,633/yr
- Insurance
- −$956
- HOA
- −$0
- Vacancy / Maint / Mgmt
- −$3,800
- Net cashflow
- $918
Break-even live
UW: 25.0% down · 7.5% · 30yr · 1.5% tax · 5.0% vac · 8.0% maint · 8.0% mgmt
Financing live
Cash to close
- Down payment
- $573,750
- Closing costs
- $68,850
- Reserves months
- —
- Total cash needed
- —
Loan-product check · same deal, 3 products live
Conventional
25% down · 7.5% · 30yr
- Down + closing
- —
- Monthly P&I
- —
- Monthly cashflow
- —
- DSCR
- —
- Eligible?
- —
Personal DTI + credit; lowest rate.
DSCR
20% down · 8.5% · 30yr
- Down + closing
- —
- Monthly P&I
- —
- Monthly cashflow
- —
- DSCR
- —
- Eligible?
- —
No personal income docs; deal must DSCR.
Hard money
10% down · 12.0% · 12mo
- Down + closing
- —
- Monthly P&I
- —
- Monthly cashflow
- —
- DSCR
- —
- Eligible?
- —
Short-term bridge; refi at stabilization.
Rent comps 2 comps
| Address | Beds | Baths | Sqft | Rent | $/sqft | DOM | Units | Dist |
|---|---|---|---|---|---|---|---|---|
| 26237 Fairside Rd Malibu, CA | 4.0 | 4.0 | 2082 | $13,000 | $6.24 | 17d | 1 | 0.03mi |
| 26349 Fairside Rd Malibu, CA | 3.0 | 3.0 | 1876 | $7,500 | $4.00 | 43d | 1 | 0.15mi |
Listing history 25 events
-
2026-06-18days on market $2,295,000 Active 37 DOM
-
2026-06-17days on market $2,295,000 Active 36 DOM
-
2026-06-16days on market $2,295,000 Active 35 DOM
-
2026-06-15days on market $2,295,000 Active 34 DOM
-
2026-06-13days on market $2,295,000 Active 32 DOM
-
2026-06-13days on market $2,295,000 Active 31 DOM
-
2026-06-09days on market $2,295,000 Active 28 DOM
-
2026-06-08days on market $2,295,000 Active 27 DOM
-
2026-06-07days on market $2,295,000 Active 26 DOM
-
2026-06-04days on market $2,295,000 Active 23 DOM
-
2026-06-03days on market $2,295,000 Active 22 DOM
-
2026-06-02days on market $2,295,000 Active 21 DOM
-
2026-06-01days on market $2,295,000 Active 20 DOM
-
2026-05-31days on market $2,295,000 Active 19 DOM
-
2026-05-12$2,295,000 Active 1179-char remark
-
2026-05-08historical
-
2026-04-03price $2,395,000
-
2026-03-11$2,495,000 Active
-
1998-09-11historical
-
1998-05-14historical
-
1998-03-16
-
1997-11-28historical
-
1997-11-14
-
1997-05-30
-
1994-08-30soldstatus $30,000
ⓘ Source: listings_history table (triggers on properties + properties_extension) + one-shot
backfill from property_details.listing_events for pre-trigger history.
Tax reassessment forecast CA · Resets to sale price
- Current annual tax
- $4,633 · $386/mo
- Projected year-2 tax
- $17,442 · $1,454/mo
- Expected delta
- +$12,809/yr (+$1,067/mo · 276.5%)
ⓘ Screening estimate from a state-policy table — verify with the county assessor before closing.
Climate risk First Street
- Flood 1/10 Low FEMA zone X (unshaded) · 0% chance over 30 yrs
- Wildfire 5/10 Major
- Heat 3/10 Moderate 7 d/yr ≥83°F today · 20 d/yr by 30 yrs out
- Wind 1/10 Low
- Air quality 5/10 Major 7 unhealthy d/yr today · 7 by 30 yrs out
Nearby sold comps map
Loading sold comps map…
Walkable amenities ~0.75 mi
Loading nearby amenities…
Taxation est. · year 1
- Rental income
- $217,152
- − Mortgage interest
- −$128,556
- − Property taxes
- −$4,633
- − Insurance
- −$11,475
- − Repairs & maintenance
- −$17,372
- − Management
- −$17,372
- − Depreciation
- −$66,764
- Taxable loss
- −$29,019
- Est. tax savings @ 24.0%
- +$6,965
- After-tax cash flow
- $17,984/yr
For passive investors: Depreciation is non-cash, so a rental often shows a tax loss while cash-flowing — sheltering income. Rental losses are passive: they offset passive income freely, and up to $25,000/yr can offset ordinary (W-2) income if you actively participate and your MAGI is under $100k (phasing out to $0 by $150k); unused losses carry forward. On sale, claimed depreciation is recaptured at up to 25%, and gains may owe capital-gains tax (a 1031 exchange can defer both). Figures are a year-1 estimate at your 24.0% rate — not tax advice; consult a CPA.
Schools (NCES district)
- District
- Santa Monica-Malibu Unified
- NCES district ID
- 0635700
- Math proficiency
- 61% ▬ 0.00%
- Reading proficiency
- 74% ▬ 0.00%
- Median HH income
- $81,489
- Composite
- 61.58/100
- National rank
- #1535
- State rank
- #123 of 1400 in CA
Livability — Malibu
- Score
- 53/100
- State rank
- #979
- US rank
- #24630
Category grades
Schools grade is shown separately in the Schools card above.
Census & demographics
- County
- Los Angeles County · 9,444,647 people
- City population
- 15,918
- Metro
- Los Angeles-Long Beach-Anaheim, CA
- Population (ZIP)
- 15,918
- Household income
- $196,742
- Rent vs Own
- Severe rent burden
- 420.0
Population outlook (Los Angeles County) Hauer SSP2
- Today (2025)
- 10,940,515 people
- By 2030
- 11,256,481 · +2.9%
- By 2040
- 11,729,929 · +7.2%
- By 2050
- 11,948,407 · +9.2%
- By 2075
- 11,818,114 · +8.0%
- By 2100
- 10,842,928 · -0.9%
Race, ethnicity, and origin ACS 2023
- Neighborhood character
- Predominantly White (77%)
- Race & ethnicity
- White 77% Two or more races 10% Hispanic / Latino 9% Asian 5% Black 1%
- Hispanic origin (detail)
- Mexican 6%
- Common ancestry
- Italian 8% Scotch-Irish 3% Romanian 3%
- Foreign-born
- 16% · Canada, South Korea, China
- Languages at home
- 82% English-only · Spanish 6% Other Indo-European 6% French/Haitian/Cajun 2%
Political lean MEDSL · Los Angeles
- 2024 margin
- Solid D (+32.9) · D 64.8% · R 31.9% · Other 3.3%
- 2008→2024 swing
- -7.4pp toward R · 2008: 40.4pp · 2024: 32.9pp
- All cycles
- 2024: D+32.9 2020: D+44.2 2016: D+48.0 2012: D+40.0 2008: D+40.4
Not yet ingested
- Civics
- —
Market trends
- HPI YoY
- ▲ 0.62%
- Current HPI
- 498.5117
- Rent YoY
- ▼ -3.39%
- Metro
- Los Angeles-Long Beach-Anaheim, CA
- State GDP YoY
- ▲ 3.21%
- F500 in state
- 116
Industry mix (Fortune 500 HQ in CA)
| Industry | F500 HQs | Revenue |
|---|---|---|
| Technology | 27 | $1,492B |
|
||
| Financial Services | 3 | $174B |
|
||
| Retail | 3 | $44B |
|
||
| Insurance | 3 | $26B |
|
||
| Media / Entertainment | 2 | $115B |
|
||
| Pharmaceuticals / Biotech | 2 | $62B |
|
||
Price history
-66.7% since first listed12 events — show timeline
- 2026-06-09 Listed for Rent $10,000 CLAW
- 2026-05-12 Listed $2,295,000 TheMLS
- 2026-05-08 Listing Removed — CRMLS
- 2026-04-03 Price Changed $2,395,000 CRMLS
- 2026-03-11 Listed $2,495,000 CRMLS
- 1998-09-11 Delisted — TheMLS
- 1998-05-14 Delisted — TheMLS
- 1998-03-16 Listed — TheMLS
- 1997-11-28 Delisted — TheMLS
- 1997-11-14 Listed — TheMLS
- 1997-05-30 Listed — TheMLS
- 1994-08-30 Sold (Public Records) $30,000 Public Records
Property tax history
+2.9%/yrLatest (2025): $4,633 · +12.2% YoY. Source: county tax records.
Cash-flow waterfall
monthlySold comps — $/sqft
last 12 mo · ≤1 miLoading sold comps…