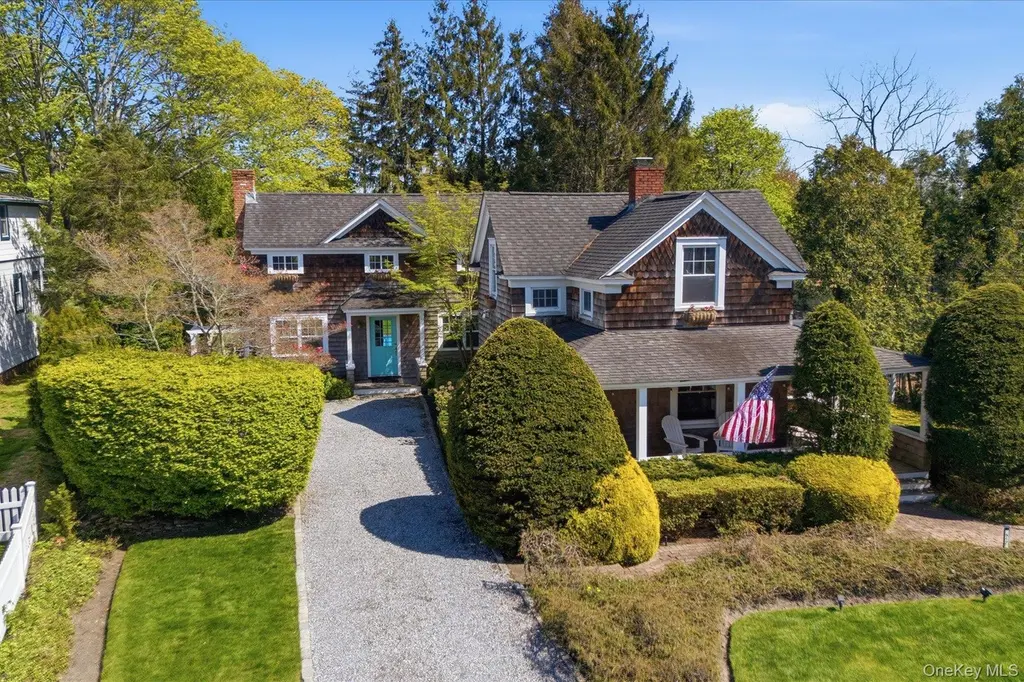
517 Montauk Hwy · East Quogue, NY
Flood risk 1/10 · Minimal
- FEMA flood zone
- X (unshaded)
- Chance of flooding over 30 yrs
- 0.0%
- Est. flood insurance / yr
- $507 – $1,088
Fire risk 1/10 · Minimal
- Est. fire insurance / yr
- $691 – $1,283
Heat risk 4/10 · Minor
- Hot days now (above 90°F)
- 7 days/yr
- Hot days in 30 yrs
- 19 days/yr
Wind risk 8/10 · Major
- Chance of severe wind over 30 yrs
- 80.0%
Air-quality risk 2/10 · Minimal
- Unhealthy air days now
- 2 days/yr
- Unhealthy air days in 30 yrs
- 2 days/yr
Risk factors via First Street. Map © Google.
Why this score? — see what drove the B grade
The composite is a weighted blend of 9 inputs, each scored 0–100. Each bar is that input's sub-score; the figure is the points it added to the 100-point composite (weight × sub-score).
- Cash flow +30.0/30.0
- ARV discount +10.5/15.0
- 1% rule +10.0/10.0
- DSCR +10.0/10.0
- Schools +5.0/10.0
- Livability +3.1/5.0
- Rent growth +2.5/5.0
- Condition / age +2.5/5.0
- Appreciation +0.0/10.0
$1,399,000
🖨 Deal sheet (PDF) 📄 Offer letter ✓ Due diligence
Listing remarks
They often say many homes have character, but few capture the character of days gone by quite like this one. Originally built in 1890, this truly special property offers a unique layout, timeless charm, and versatility unlike anything else currently on the market. Set in a desirable Main Street location with Hamlet Office zoning, this home has served for many years as both a primary residence and a professional real estate office, offering exceptional potential for a variety of permitted uses. Renovated and expanded in 2001, great care was taken to preserve the home’s historic charm while incorporating modern conveniences. The first level welcomes you into a warm gathering room with a
Key facts
- Main street location
- Hamlet office zoning
- Landscaped backyard
Tags
Property features AI
Exterior
- Parking: Driveway parking
- Utilities: Cesspool sewer; Electricity connected; Cable connected
- Home design: Single family residence
- Construction: Frame construction
- Exterior features: Private, landscaped yard with both front and back yard
Interior
- Kitchen: Kitchen island; Eat-in kitchen; Refrigerator included
- Bedrooms: Includes a first-floor bedroom
- Flooring: Hardwood floors
- Bathrooms: Two full bathrooms
- Heating & cooling: Forced air heating; Central air conditioning
- Interior features: First-floor bedroom; First-floor full bathroom; Eat-in kitchen; Kitchen island; Washer/dryer hookup; Covered wrap-around porch
- Laundry & utility: Laundry room; Washer and dryer included; Washer/dryer hookup
Neighborhood map
What this means for you Summary
Snapshot
- This is a 4-bed/1.0-bath single-family listed at $1.40M.
Deal economics
- At list price, monthly cash flow is $8k ($100k/yr) — positive.
- The deal already cash-flows at list — no discount required.
- Meets the 1% rule at list price ($21k rent vs $1.40M).
- Cap rate 13.4% vs local median 10.6% in East Quogue — meaningfully above typical; check what's discounted (condition, days-on-market, listing class) to confirm the premium yield is real.
Location & tenants
- Location reads 61/100 on livability (#943 in NY) — a middle-class / working-renter tenant base. Strengths: crime A+, employment A+; Watch: amenities F, commute F, cost of living F.
- East Quogue Union Free School District (suburban): math 55% / reading 50% proficiency, ranked #342 of 755 in NY (top 45%) — acceptable for families but not a draw, mixed tenant base, ~2y average lease; only 15% free/reduced lunch — higher-income household profile.
- Zoned schools: East Quogue School (math 57% / reading 62%, grade B-, #745 of 2,108 statewide, top 39%, 355 students, 31% FRL) — zoned schools average 31% FRL vs 15% district-wide (16 pts higher); higher-poverty schools than district average — tighter screening recommended.
- Market conditions: 75 active listings in the ZIP; 22 comparable units currently listed for rent nearby; rentals at typical pace (median 25d on market — plan ~3-4 weeks tenant-placement turnaround); 1,366 units permitted in Suffolk County in 2024 (216 in 5+ unit buildings).
Forward outlook
- Local home prices are declining (-3.0%/yr); year-one equity from $10k of loan paydown is wiped out by about $42k of value loss. Plan a longer hold.
- Suffolk County population projected to shrink 5% by 2050 — rents likely to lag national; underwrite the cash flow, not the appreciation.
- At projected returns (-3.0% appreciation + 3.0% rent growth), your $392k cash investment doubles in ~5 years — after that, you're playing with house money.
Negotiation context
- Only 14 days on market — expect competitive offers; lowballing is unlikely to land.
- Current owner paid $140k; list at $1.40M implies a 899% gain — meaningful room to come down on a strong offer.
Risks & watch-outs
- Watch-outs: built in 1890 — expect roof / HVAC / electrical / plumbing capex.
- Climate carrying-cost: severe wind risk, 80% chance of damaging wind over 30y — expect insurance premiums to compound above CPI over the hold.
Questions for the listing agent
- Built in 1890 — when were the roof, HVAC, electrical panel, plumbing, and water heater last replaced?
- Is there a deadline driving the sale (1031 exchange, divorce, estate, relocation)? That informs how much negotiation room exists.
- Schools are B-rated — typically a magnet for longer-tenancy family renters. What's the average tenant stay here, and is there a school-zone premium baked into asking?
- What's the average days-on-market for RENTAL listings here right now (not sales)? A rising rental-DOM trend means longer vacancies and softer asking-rent achievability than the comps imply.
- What's the recent tenant-quality profile in this submarket — average credit score on applications, eviction rate, late-payment / NSF rate, and stable-employment percentage? A property-management company in the area should have these aggregated.
- How much new for-sale + rental construction is in the pipeline within 1–3 miles? Heavy new supply typically softens prices + rents 12–24 months out; constrained supply supports both.
Investment metrics
- 1% rule
- 1.52% ✓
- Cap rate
- 13.41%
- Cash-on-cash
- 25.42%
- DSCR
- 2.13
- GRM
- 5.5
CMA / ARV
- ARV (median comp)
- $1,499,534
- List price
- $1,399,000
- Delta
- -6.70%
- Verdict
- FAIR
- Comps
- 20 within 1.0 mi
Show comp detail 9 sales within ~0.75 mi
| Address | Dist | Beds/Ba | Sqft | Sold | Price | $/sf | Match |
|---|---|---|---|---|---|---|---|
| 19 Walnut Ave | 0.16mi | 3/3.0 (-1) | 2,700 (-5%) | 3mo | $1,250,000 | $463 | 70 |
| 14 Bay Ave | 0.17mi | 5/4.5 (+1) | 2,900 (+2%) | 2mo | $2,500,000 | $862 | 67 |
| 21 Bay Ave | 0.26mi | 4/2.0 | 2,522 (-11%) | 16mo | $810,000 | $321 | 52 |
| 65 Old Country Rd | 0.60mi | 4/3.5 | 2,973 (+5%) | 8mo | $1,550,000 | $521 | 47 |
| 18 Sunset Ave | 0.49mi | 5/3.5 (+1) | 2,814 (-1%) | 18mo | $2,742,000 | $974 | 46 |
| 61 W Side Ave | 0.25mi | 4/3.5 | 2,408 (-15%) | 12mo | $925,000 | $384 | 43 |
| 7 Vail Ave | 0.43mi | 4/3.5 | 3,076 (+9%) | 18mo | $1,212,500 | $394 | 40 |
| 2 Box Tree Rd | 0.58mi | 4/2.5 | 2,500 (-12%) | 18mo | $1,300,000 | $520 | 32 |
| 15 Sunset Ave | 0.42mi | 3/3.5 (-1) | 2,419 (-14%) | 16mo | $1,650,000 | $682 | 28 |
Match score weights: distance 35% · size 25% · config 20% · recency 20%. Top-matched comps best support the ARV.
Projected returns pro-forma
-3.0% appreciation · 3.0% rent growth · sell at horizon
- IRR
- 19.0%
- Equity multiple
- 1.77×
- Total profit
- $301,370
- Equity at exit
- $208,595
- IRR
- 27.3%
- Equity multiple
- 3.40×
- Total profit
- $941,368
- Equity at exit
- $120,960
Cash invested: $391,720 (down + closing). Projections, not guarantees.
Landlord ↔ Tenant lean methodology
- Overall (STATE)
- 15 Strongly Tenant-Friendly
- State New York
- 15 Strongly Tenant-Friendly · D+10
- County
- — inherits STATE
- City
- — inherits STATE
ZIP-level market 11942
- Home prices YoY
- -25.0%
- Active inventory
- 75
- Price-to-rent
- 5.5×
Monthly cashflow live
- Estimated rent
- $21,312 high interval (Pro) →
- Mortgage (P&I)
- −$7,337
- Tax from tax record
- −$620 /mo · $7,441/yr
- Insurance
- −$583
- HOA
- −$0
- Vacancy / Maint / Mgmt
- −$4,476
- Net cashflow
- $8,297
Break-even live
Sensitivity live
| Price | -10% $9,089 | -5% $8,693 | +0% $8,297 | +5% $7,901 | +10% $7,505 |
|---|---|---|---|---|---|
| Rent | -10% $6,613 | -5% $7,455 | +0% $8,297 | +5% $9,139 | +10% $9,981 |
| Rate | -1.0pp $9,002 | -0.5pp $8,653 | base $8,297 | +0.5pp $7,934 | +1.0pp $7,566 |
UW: 25.0% down · 7.5% · 30yr · 1.5% tax · 5.0% vac · 8.0% maint · 8.0% mgmt
Financing live
Cash to close
- Down payment
- $349,750
- Closing costs
- $41,970
- Reserves months
- —
- Total cash needed
- —
Loan-product check · same deal, 3 products live
Conventional
25% down · 7.5% · 30yr
- Down + closing
- —
- Monthly P&I
- —
- Monthly cashflow
- —
- DSCR
- —
- Eligible?
- —
Personal DTI + credit; lowest rate.
DSCR
20% down · 8.5% · 30yr
- Down + closing
- —
- Monthly P&I
- —
- Monthly cashflow
- —
- DSCR
- —
- Eligible?
- —
No personal income docs; deal must DSCR.
Hard money
10% down · 12.0% · 12mo
- Down + closing
- —
- Monthly P&I
- —
- Monthly cashflow
- —
- DSCR
- —
- Eligible?
- —
Short-term bridge; refi at stabilization.
Rent comps 22 comps
| Address | Beds | Baths | Sqft | Rent | $/sqft | DOM | Units | Dist |
|---|---|---|---|---|---|---|---|---|
| 11 Post Xing East Quogue, NY | 3.0 | 2.0 | 2926 | $20,000 | $6.84 | 19d | 1 | 0.22mi |
| 36 Walker Ave East Quogue, NY | 5.0 | 3.0 | 2500 | $23,000 | $9.20 | 8d | 1 | 0.37mi |
| 718 Montauk Hwy East Quogue, NY | 5.0 | 2.0 | 2500 | $25,000 | $10.00 | 25d | 1 | 0.40mi |
| 2 Bayside Ave East Quogue, NY | 4.0 | 3.0 | 2280 | $80,000 | $35.09 | 22d | 1 | 0.58mi |
| 21 Bayside Ave East Quogue, NY | 4.0 | 3.0 | 2900 | $14,000 | $4.83 | 44d | 1 | 0.68mi |
| 114 Spinney Rd East Quogue, NY | 4.0 | 3.0 | 2201 | $18,000 | $8.18 | 19d | 1 | 0.84mi |
| 10 Skyes Neck Ct East Quogue, NY | 4.0 | 3.0 | 2249 | $80,000 | $35.57 | 25d | 1 | 0.91mi |
| 99 Spinney Rd East Quogue, NY | 5.0 | 4.5 | 3512 | $95,000 | $27.05 | 25d | 1 | 1.00mi |
| 3 Bennett Dr East Quogue, NY | 4.0 | 4.0 | 2673 | $5,000 | $1.87 | 44d | 1 | 1.00mi |
| 4 Bennett Dr East Quogue, NY | 4.0 | 3.0 | 2400 | $11,000 | $4.58 | 18d | 1 | 1.05mi |
| 4 Bennett Dr East Quogue, NY | 4.0 | 3.0 | 2144 | $11,000 | $5.13 | 6d | 1 | 1.05mi |
| 3 Cherry Blossom Ln East Quogue, NY | 5.0 | 4.5 | 3632 | $40,000 | $11.01 | 44d | 1 | 1.08mi |
| 24 Quogue Riverhead Rd Quogue, NY | 3.0 | 3.0 | 2054 | $15,000 | $7.30 | 25d | 1 | 1.14mi |
| 73 Spinney Rd East Quogue, NY | 3.0 | 2.5 | 2400 | $25,000 | $10.42 | 19d | 1 | 1.25mi |
| 4 Aerie Way East Quogue, NY | 4.0 | 3.0 | 2400 | $11,000 | $4.58 | 16d | 1 | 1.31mi |
| 23 Whiting Rd East Quogue, NY | 4.0 | 3.5 | 2296 | $60,000 | $26.13 | 22d | 1 | 1.31mi |
| 13 Beachland Ave East Quogue, NY | 4.0 | 4.0 | 2028 | $38,000 | $18.74 | 22d | 1 | 1.34mi |
| 2941 Quogue Riverhead Rd East Quogue, NY | 3.0 | 2.5 | 2044 | $80,000 | $39.14 | 25d | 1 | 1.37mi |
| 20 Marlin Rd East Quogue, NY | 3.0 | 2.0 | 2000 | $10,000 | $5.00 | 44d | 1 | 1.42mi |
| 26 Squires Ave East Quogue, NY | 4.0 | 2.5 | 2950 | $7,000 | $2.37 | 44d | 1 | 1.42mi |
| 1 Candace Dr East Quogue, NY | 4.0 | 4.0 | 3000 | $25,000 | $8.33 | 44d | 1 | 1.47mi |
| 10 Fox Hollow Dr East Quogue, NY | 4.0 | 3.5 | 2750 | $30,000 | $10.91 | 44d | 1 | 1.47mi |
Listing history 2 events
-
2026-05-07$1,399,000 Active 2040-char remark
-
1989-05-16soldstatus $140,000
ⓘ Source: listings_history table (triggers on properties + properties_extension) + one-shot
backfill from property_details.listing_events for pre-trigger history.
Tax reassessment forecast NY · Partial reset (capped growth)
- Current annual tax
- $7,441 · $620/mo
- Projected year-2 tax
- $15,542 · $1,295/mo
- Expected delta
- +$8,101/yr (+$675/mo · 108.9%)
ⓘ Screening estimate from a state-policy table — verify with the county assessor before closing.
Climate risk First Street
- Flood 1/10 Low FEMA zone X (unshaded) · 0% chance over 30 yrs
- Wildfire 1/10 Low
- Heat 4/10 Moderate 7 d/yr ≥90°F today · 19 d/yr by 30 yrs out
- Wind 8/10 Severe 80% chance of damaging wind over 30 yrs
- Air quality 2/10 Low 2 unhealthy d/yr today · 2 by 30 yrs out
Nearby sold comps map
Loading sold comps map…
Walkable amenities ~0.75 mi
Loading nearby amenities…
Taxation est. · year 1
- Rental income
- $255,745
- − Mortgage interest
- −$78,366
- − Property taxes
- −$7,441
- − Insurance
- −$6,995
- − Repairs & maintenance
- −$20,460
- − Management
- −$20,460
- − Depreciation
- −$40,698
- Taxable income
- $81,325
- Est. tax owed @ 24.0%
- −$19,518
- After-tax cash flow
- $80,046/yr
For passive investors: Depreciation is non-cash, so a rental often shows a tax loss while cash-flowing — sheltering income. Rental losses are passive: they offset passive income freely, and up to $25,000/yr can offset ordinary (W-2) income if you actively participate and your MAGI is under $100k (phasing out to $0 by $150k); unused losses carry forward. On sale, claimed depreciation is recaptured at up to 25%, and gains may owe capital-gains tax (a 1031 exchange can defer both). Figures are a year-1 estimate at your 24.0% rate — not tax advice; consult a CPA.
Schools (NCES district)
- District
- East Quogue Union Free School District
- NCES district ID
- 3609900
- Math proficiency
- 55% ▬ 0.00%
- Reading proficiency
- 50% ▲ 5.00%
- Median HH income
- $81,457
- Composite
- 49.79/100
- National rank
- #4207
- State rank
- #342 of 755 in NY
Livability — East Quogue
- Score
- 61/100
- State rank
- #943
- US rank
- #18348
Category grades
Schools grade is shown separately in the Schools card above.
Census & demographics
- Census place
- East Quogue, NY
- City population
- 5,871
- Population (ZIP)
- 5,871
Population outlook (Suffolk County) Hauer SSP2
- Today (2025)
- 1,505,262 people
- By 2030
- 1,498,318 · -0.5%
- By 2040
- 1,471,101 · -2.3%
- By 2050
- 1,424,848 · -5.3%
- By 2075
- 1,337,157 · -11.2%
- By 2100
- 1,217,720 · -19.1%
Race, ethnicity, and origin ACS 2023
- Neighborhood character
- Predominantly White (80%)
- Race & ethnicity
- White 80% Hispanic / Latino 16% Asian 2% Two or more races 2%
- Hispanic origin (detail)
- Mexican 3%
- Common ancestry
- Romanian 6% Scotch-Irish 3% Lithuanian 3%
- Foreign-born
- 13% · Canada, Jamaica, Guatemala
- Languages at home
- 80% English-only · Spanish 12% Other Indo-European 2% Russian/Polish/Slavic 2%
Political lean MEDSL · Suffolk
- 2024 margin
- Lean R (+10.0) · D 45.0% · R 55.0%
- 2008→2024 swing
- -16.0pp toward R · 2008: 6.0pp · 2024: -10.0pp
- All cycles
- 2024: R+10.0 2020: R+0.0 2016: R+8.2 2012: D+2.9 2008: D+6.0
Not yet ingested
- Civics
- —
Market trends
- HPI YoY
- ▼ -145.33%
- Current HPI
- 435.8017
- Rent YoY
- —
- Metro
- —
- State GDP YoY
- ▲ 2.60%
- F500 in state
- 92
Industry mix (Fortune 500 HQ in NY)
| Industry | F500 HQs | Revenue |
|---|---|---|
| Financial Services | 10 | $950B |
|
||
| Consumer Goods | 9 | $162B |
|
||
| Insurance | 4 | $225B |
|
||
| Telecommunications | 2 | $144B |
|
||
| Pharmaceuticals | 2 | $112B |
|
||
| Media / Entertainment | 2 | $69B |
|
||
Price history
+899.3% since first listed3 events — show timeline
- 2026-05-21 Pending — OneKey® MLS as Distributed by MLS Grid
- 2026-05-07 Listed $1,399,000 OneKey® MLS as Distributed by MLS Grid
- 1989-05-16 Sold (Public Records) $140,000 Public Records
Property tax history
+2.3%/yrLatest (2024): $7,441 · +0.0% YoY. Source: county tax records.
Cash-flow waterfall
monthlySold comps — $/sqft
last 12 mo · ≤1 miLoading sold comps…