3 Mill Circle Dr · Dardanelle, AR
Flood risk 1/10 · Minimal
- FEMA flood zone
- X (unshaded)
- Chance of flooding over 30 yrs
- 0.0%
- Est. flood insurance / yr
- $507 – $1,088
Fire risk 3/10 · Minor
- Est. fire insurance / yr
- $1,499 – $2,785
Heat risk 7/10 · Major
- Hot days now (above 112°F)
- 7 days/yr
- Hot days in 30 yrs
- 19 days/yr
Wind risk 2/10 · Minimal
- Chance of severe wind over 30 yrs
- 2.0%
Air-quality risk 1/10 · Minimal
- Unhealthy air days now
- 0 days/yr
- Unhealthy air days in 30 yrs
- 0 days/yr
Risk factors via First Street. Map © Google.
Why this score? — see what drove the D+ grade
The composite is a weighted blend of 9 inputs, each scored 0–100. Each bar is that input's sub-score; the figure is the points it added to the 100-point composite (weight × sub-score).
- ARV discount +15.0/15.0
- Cash flow +14.7/30.0
- DSCR +4.5/10.0
- Schools +3.6/10.0
- Livability +3.5/5.0
- 1% rule +3.0/10.0
- Rent growth +2.5/5.0
- Condition / age +2.5/5.0
- Appreciation +0.0/10.0
$137,700
🖨 Deal sheet (PDF) 📄 Offer letter ✓ Due diligence
Listing remarks MLS
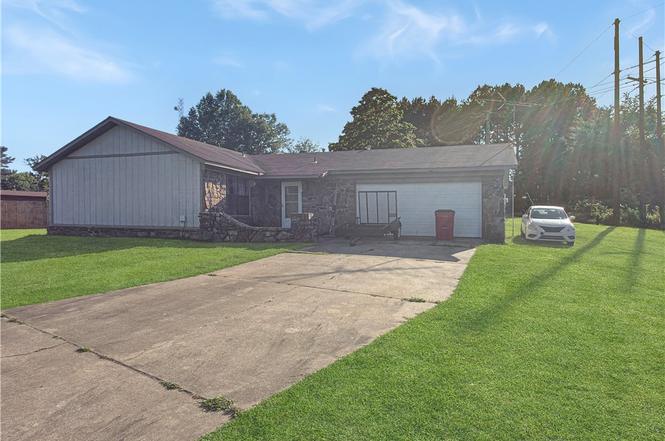
Welcome home to this spacious 4-bedroom property nestled on a large lot in an established Dardanelle neighborhood. Offering plenty of room both inside and out, this home features a functional floor plan designed for comfortable everyday living. The attached garage provides convenient parking and additional storage, while the oversized yard offers endless possibilities for outdoor entertaining, gardening, pets, or play. Enjoy the small-town atmosphere of Dardanelle while remaining just minutes from schools, shopping, dining, the Arkansas River, Mount Nebo State Park, Lake Dardanelle State Park, Lions Den Golf Club, and all the amenities of the River Valley area. Whether you're looking for extra space for a growing family or simply want room to spread out, this property delivers comfort, convenience, and value. Don't miss your opportunity to make this versatile home your own!
Key facts
- Oversized yard
- Attached garage
- Large lot
Tags
Property features AI
Exterior
- Parking: Attached garage
- Utilities: Public sewer; Public water; Municipal electric (Entergy); Natural gas; Fiber internet available
- Home design: Brick, stone, and wood exterior
- Construction: Slab foundation; Architectural shingle roof
- Exterior features: Patio; Cul-de-sac lot; Cleared lot; Located in a subdivision; Paved road access; Located inside city limits; Golf course nearby
Interior
- Kitchen: Gas range; Dishwasher; Pantry
- Flooring: Carpet; Vinyl; Tile; Concrete
- Bathrooms: One full bathroom; One half bathroom
- Heating & cooling: Central electric heat; Central electric cooling
- Interior features: Gas water heater; Ceiling fans; Great room; Bonus room; Laundry room
- Laundry & utility: Laundry room
Neighborhood map
What this means for you Summary
Snapshot
- This is a 4-bed/1.5-bath single-family listed at $138k.
Deal economics
- At list price, monthly cash flow is $37 ($438/yr) — positive.
- The deal already cash-flows at list — no discount required.
- To meet the 1% rule (rent ≥ 1% of price), the offer needs to be $110k (20.5% below list).
- Recommended offer: $110k (20.5% below list) — sets the bar for 1% rule.
- Cap rate 6.6% vs local median 3.2% in Dardanelle — top-decile yield for the area; either an underpriced asset or a hidden risk that comps aren't pricing in. Stress-test before assuming the spread holds.
Location & tenants
- Location reads 70/100 on livability (#56 in AR) — a middle-class / working-renter tenant base. Strengths: cost of living A+, health & safety A+, housing A; Watch: amenities F, commute F, employment D-.
- Dardanelle School District (town): math 44% / reading 42% proficiency, ranked #52 of 238 in AR (top 22%) — families likely to look elsewhere, expect single-tenant / working-renter base with shorter leases.
- Zoned schools: Dardanelle Primary School (math 47% / reading 27%, grade F, #229 of 454 statewide, top 54%, 614 students, 72% FRL); Dardanelle Middle School (math 44% / reading 43%, grade D, #69 of 201 statewide, top 34%, 524 students, 66% FRL); Dardanelle High School (math 27% / reading 50%, grade F, #60 of 292 statewide, top 20%, 624 students, 64% FRL).
- Market conditions: 90 active listings in the ZIP; 10 units permitted in Yell County in 2024 (0 in 5+ unit buildings).
Forward outlook
- Local home prices are declining (-3.0%/yr); year-one equity from $952 of loan paydown is wiped out by about $4k of value loss. Plan a longer hold.
- Yell County population projected at -24% by 2050 — secular population decline; favor cash flow + early exit over multi-decade hold.
Negotiation context
- Only 7 days on market — expect competitive offers; lowballing is unlikely to land.
- 3 sale attempts since 9y ago with the ask held roughly flat each time — persistent listings suggest the price (not the market) is what's stuck; bring a comps-based counter.
- Current owner paid $98k; 41% above their basis — modest negotiation headroom, anchor on the comps not their cost.
Risks & watch-outs
- Climate carrying-cost: extreme-heat days projected 7→19/yr by 2055 (HVAC capex compounding) — expect insurance premiums to compound above CPI over the hold.
Questions for the listing agent
- Is there a deadline driving the sale (1031 exchange, divorce, estate, relocation)? That informs how much negotiation room exists.
- Schools are D-rated, which usually means shorter tenancies and higher turnover. Who's the typical renter profile here, and what's been the actual vacancy rate?
- The area grade is low — what's the realistic commute time and amenity access for the typical tenant pool here? Any planned neighborhood developments (good or bad) we should know about?
- What's the average days-on-market for RENTAL listings here right now (not sales)? A rising rental-DOM trend means longer vacancies and softer asking-rent achievability than the comps imply.
- What's the recent tenant-quality profile in this submarket — average credit score on applications, eviction rate, late-payment / NSF rate, and stable-employment percentage? A property-management company in the area should have these aggregated.
- How much new for-sale + rental construction is in the pipeline within 1–3 miles? Heavy new supply typically softens prices + rents 12–24 months out; constrained supply supports both.
Investment metrics
- 1% rule
- 0.80% ✗
- Cap rate
- 6.61%
- Cash-on-cash
- 1.14%
- DSCR
- 1.05
- GRM
- 10.5
CMA / ARV
- ARV (on-the-fly)
- $200,880
- Comps found
- 7
Show comp detail 7 sales within ~0.75 mi
| Address | Dist | Beds/Ba | Sqft | Sold | Price | $/sf | Match |
|---|---|---|---|---|---|---|---|
| 2103 Highland Ct | 0.44mi | 3/2.0 (-1) | 1,556 (-4%) | 7mo | $193,500 | $124 | 60 |
| 124 Winterwood Cir | 0.53mi | 3/2.0 (-1) | 1,628 (+0%) | 11mo | $282,000 | $173 | 58 |
| 1113 N 6th St | 0.38mi | 3/2.0 (-1) | 1,700 (+5%) | 13mo | $190,000 | $112 | 56 |
| 314 Rock St | 0.69mi | 3/2.0 (-1) | 1,612 (-0%) | 4mo | $175,000 | $109 | 56 |
| 134 Winterwood Cir | 0.63mi | 3/2.0 (-1) | 1,661 (+2%) | 6mo | $243,000 | $146 | 55 |
| 120 Winterwood Cir | 0.48mi | 3/2.0 (-1) | 1,430 (-12%) | 19mo | $250,000 | $175 | 35 |
| 104 Winterwood Dr | 0.63mi | 3/2.0 (-1) | 1,400 (-14%) | 20mo | $168,000 | $120 | 24 |
Match score weights: distance 35% · size 25% · config 20% · recency 20%. Top-matched comps best support the ARV.
Projected returns pro-forma
-3.0% appreciation · 3.0% rent growth · sell at horizon
- IRR
- -14.5%
- Equity multiple
- 0.48×
- Total profit
- $-20,045
- Equity at exit
- $20,532
- IRR
- -5.9%
- Equity multiple
- 0.62×
- Total profit
- $-14,699
- Equity at exit
- $11,906
Cash invested: $38,556 (down + closing). Projections, not guarantees.
Landlord ↔ Tenant lean methodology
- Overall (STATE)
- 92 Strongly Landlord-Friendly
- State Arkansas
- 92 Strongly Landlord-Friendly · R+14
- County
- — inherits STATE
- City
- — inherits STATE
ZIP-level market 72834
- Home prices YoY
- -8.4%
- Active inventory
- 90
- Price-to-rent
- 10.5×
Monthly cashflow live
- Estimated rent
- $1,095 medium interval (Pro) →
- Mortgage (P&I)
- −$722
- Tax from tax record
- −$49 /mo · $589/yr
- Insurance
- −$57
- HOA
- −$0
- Vacancy / Maint / Mgmt
- −$230
- Net cashflow
- $37
Break-even live
Sensitivity live
| Price | -10% $114 | -5% $76 | +0% $37 | +5% $-2 | +10% $-41 |
|---|---|---|---|---|---|
| Rent | -10% $-50 | -5% $-7 | +0% $37 | +5% $80 | +10% $123 |
| Rate | -1.0pp $106 | -0.5pp $72 | base $37 | +0.5pp $1 | +1.0pp $-35 |
UW: 25.0% down · 7.5% · 30yr · 1.5% tax · 5.0% vac · 8.0% maint · 8.0% mgmt
Financing live
Cash to close
- Down payment
- $34,425
- Closing costs
- $4,131
- Reserves months
- —
- Total cash needed
- —
Loan-product check · same deal, 3 products live
Conventional
25% down · 7.5% · 30yr
- Down + closing
- —
- Monthly P&I
- —
- Monthly cashflow
- —
- DSCR
- —
- Eligible?
- —
Personal DTI + credit; lowest rate.
DSCR
20% down · 8.5% · 30yr
- Down + closing
- —
- Monthly P&I
- —
- Monthly cashflow
- —
- DSCR
- —
- Eligible?
- —
No personal income docs; deal must DSCR.
Hard money
10% down · 12.0% · 12mo
- Down + closing
- —
- Monthly P&I
- —
- Monthly cashflow
- —
- DSCR
- —
- Eligible?
- —
Short-term bridge; refi at stabilization.
Listing history 7 events
-
2026-06-18status $137,700 Under Contract 7 DOM
-
2026-06-17statusdays on market $137,700 Active 7 DOM
-
2026-06-16days on market $137,700 New Listing 6 DOM
-
2026-06-15days on market $137,700 New Listing 5 DOM
-
2026-06-14days on market $137,700 New Listing 3 DOM
-
2026-06-12remarks 699-char remark
-
2026-06-12$137,700 New Listing 2 DOM
ⓘ Source: listings_history table (triggers on properties + properties_extension) + one-shot
backfill from property_details.listing_events for pre-trigger history.
Tax reassessment forecast AR · Resets to sale price
- Current annual tax
- $589 · $49/mo
- Projected year-2 tax
- $881 · $73/mo
- Expected delta
- +$292/yr (+$24/mo · 49.6%)
ⓘ Screening estimate from a state-policy table — verify with the county assessor before closing.
Climate risk First Street
- Flood 1/10 Low FEMA zone X (unshaded) · 0% chance over 30 yrs
- Wildfire 3/10 Moderate
- Heat 7/10 Severe 7 d/yr ≥112°F today · 19 d/yr by 30 yrs out
- Wind 2/10 Low 2% chance of damaging wind over 30 yrs
- Air quality 1/10 Low 0 unhealthy d/yr today · 0 by 30 yrs out
Nearby sold comps map
Loading sold comps map…
Walkable amenities ~0.75 mi
Loading nearby amenities…
Taxation est. · year 1
- Rental income
- $13,141
- − Mortgage interest
- −$7,713
- − Property taxes
- −$589
- − Insurance
- −$688
- − Repairs & maintenance
- −$1,051
- − Management
- −$1,051
- − Depreciation
- −$4,006
- Taxable loss
- −$1,958
- Est. tax savings @ 24.0%
- +$470
- After-tax cash flow
- $908/yr
For passive investors: Depreciation is non-cash, so a rental often shows a tax loss while cash-flowing — sheltering income. Rental losses are passive: they offset passive income freely, and up to $25,000/yr can offset ordinary (W-2) income if you actively participate and your MAGI is under $100k (phasing out to $0 by $150k); unused losses carry forward. On sale, claimed depreciation is recaptured at up to 25%, and gains may owe capital-gains tax (a 1031 exchange can defer both). Figures are a year-1 estimate at your 24.0% rate — not tax advice; consult a CPA.
Schools (NCES district)
- District
- Dardanelle School District
- NCES district ID
- 0504930
- Math proficiency
- 44% ▼ -10.00%
- Reading proficiency
- 42% ▼ -6.00%
- Median HH income
- $37,940
- Composite
- 35.85/100
- National rank
- #4819
- State rank
- #52 of 238 in AR
Livability — Dardanelle
- Score
- 70/100
- State rank
- #56
- US rank
- #7782
Category grades
Schools grade is shown separately in the Schools card above.
Census & demographics
- Census place
- Dardanelle, AR
- Population (ZIP)
- 9,908
Population outlook (Yell County) Hauer SSP2
- Today (2025)
- 20,438 people
- By 2030
- 19,561 · -4.3%
- By 2040
- 17,654 · -13.6%
- By 2050
- 15,569 · -23.8%
- By 2075
- 10,746 · -47.4%
- By 2100
- 6,907 · -66.2%
Race, ethnicity, and origin ACS 2023
- Neighborhood character
- Predominantly White (70%)
- Race & ethnicity
- White 70% Hispanic / Latino 24% Two or more races 4% Black 2% Asian 1%
- Hispanic origin (detail)
- Mexican 15%
- Common ancestry
- Italian 3% Slovak 2% Iranian 2%
- Foreign-born
- 10% · Canada
- Languages at home
- 79% English-only · Spanish 20% Other Asian/Pacific 1%
Political lean MEDSL · Yell
- 2024 margin
- Solid R (+60.7) · D 18.7% · R 79.5% · Other 1.8%
- 2008→2024 swing
- -30.8pp toward R · 2008: -29.9pp · 2024: -60.7pp
- All cycles
- 2024: R+60.7 2020: R+58.5 2016: R+49.0 2012: R+38.9 2008: R+29.9
Not yet ingested
- Civics
- —
Market trends
- HPI YoY
- ▼ -15.34%
- Current HPI
- 168.0553
- Rent YoY
- —
- Metro
- —
- State GDP YoY
- ▲ 3.80%
- F500 in state
- 10
Industry mix (Fortune 500 HQ in AR)
| Industry | F500 HQs | Revenue |
|---|---|---|
| Retail | 1 | $681B |
|
||
| Food / Agriculture | 1 | $53B |
|
||
| Retail / Energy | 1 | $22B |
|
||
| Transportation / Logistics | 1 | $12B |
|
||
| Energy | 1 | $4B |
|
||
Price history
+39.1% since first listed5 events — show timeline
- 2026-06-10 Listed $137,700 CARMLS
- 2026-06-10 Listed $137,700 NWARMLS
- 2018-03-19 Sold (MLS) $97,500 NWARMLS
- 2018-03-16 Sold (Public Records) $98,000 Public Records
- 2017-08-30 Listed $99,000 NWARMLS
Property tax history
-0.8%/yrLatest (2025): $589 · -14.5% YoY. Source: county tax records.
Cash-flow waterfall
monthlySold comps — $/sqft
last 12 mo · ≤1 miLoading sold comps…