 🔨 Auction
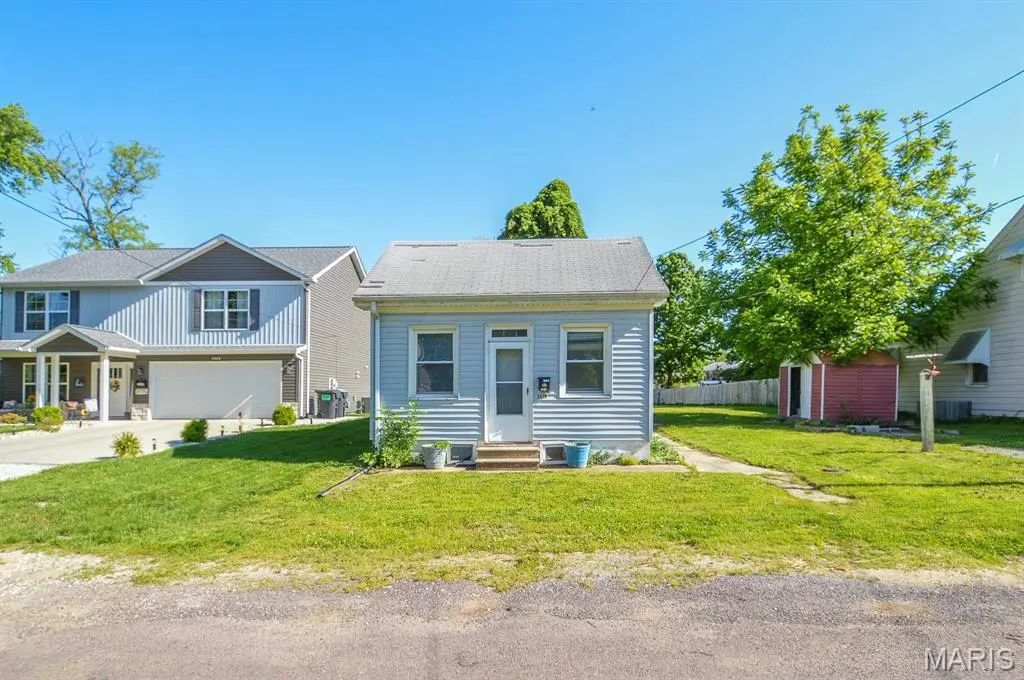
1319 Eisenhower Rd · Mascoutah, IL
Flood risk 1/10 · Minimal
- FEMA flood zone
- X
- Chance of flooding over 30 yrs
- 0.0%
- Est. flood insurance / yr
- $507 – $1,088
Fire risk 1/10 · Minimal
- Est. fire insurance / yr
- $804 – $1,492
Heat risk 5/10 · Moderate
- Hot days now (above 106°F)
- 7 days/yr
- Hot days in 30 yrs
- 21 days/yr
Wind risk 2/10 · Minimal
- Chance of severe wind over 30 yrs
- 1.0%
Air-quality risk 2/10 · Minimal
- Unhealthy air days now
- 0 days/yr
- Unhealthy air days in 30 yrs
- 1 days/yr
Risk factors via First Street. Map © Google.
Why this score? — see what drove the C+ grade
The composite is a weighted blend of 9 inputs, each scored 0–100. Each bar is that input's sub-score; the figure is the points it added to the 100-point composite (weight × sub-score).
- Cash flow +26.2/30.0
- DSCR +8.9/10.0
- ARV discount +7.5/15.0
- 1% rule +7.0/10.0
- Schools +4.1/10.0
- Livability +3.4/5.0
- Rent growth +2.5/5.0
- Condition / age +2.5/5.0
- Appreciation +0.0/10.0
$20,000
🖨 Deal sheet 📄 Offer letter ✓ Due diligence
Listing remarks
Price listed is Starting Bid Only. Bidding starts closing 6/4/2026 @ 5:30 p. m. Opportunity awaits for investors with this 1BR/1BA single-family home nestled in the heart of Mascoutah! This cozy home features a comfortable living room with front-facing windows that provide plenty of natural light. The centrally located kitchen includes washer and dryer hookups for added convenience. Just steps away, you’ll find a full bath and a spacious single bedroom offering access to a side, covered porch. Conveniently located just minutes from local schools, parks, and Scott Air Force Base, this property offers great potential for rental income or future investment opportunities. Property will se
Key facts
- 5,227 sq ft lot
- Built 1919
- Listed 22 days
Property features AI
Finance
- Other: Lot size approximately 0.12 acre
- Financial info: Auction listing; Lease not considered
Exterior
- Parking: No designated parking or carport listed
- Utilities: Public water; Public sewer; Electricity connected; Natural gas connected; Water connected; Sewer connected; Electric service: Other
- Home design: Single-family residence; One story; Private ownership; Property condition: fixer
- Construction: Shingle roof; Construction material: Other; Above-grade finished area reported as 684
- Exterior features: Back yard; Front yard; A few trees on the lot
Interior
- Bedrooms: One bedroom on the main level
- Bathrooms: One full bathroom on the main level
- Heating & cooling: Forced air heating; Cooling: Other
- Interior features: Crawl space basement; No fireplace; Four total rooms
Neighborhood map
What this means for you Summary
Snapshot
- This is a 1-bed/2.0-bath single-family listed at $20k.
Deal economics
- At list price, monthly cash flow is $249 ($3k/yr) — positive.
- The deal already cash-flows at list — no discount required.
- Meets the 1% rule at list price ($1k rent vs $20k).
- Recommended offer: $20k (1.5% below list) — sets the bar for market timing.
- Cap rate 9.3% vs local median 3.0% in Mascoutah — top-decile yield for the area; either an underpriced asset or a hidden risk that comps aren't pricing in. Stress-test before assuming the spread holds.
Location & tenants
- Location reads 68/100 on livability (#471 in IL) — a middle-class / working-renter tenant base. Strengths: crime A+, cost of living A+, housing A+; Watch: amenities F, health & safety F.
- Mascoutah CUD 19 (town): math 42% / reading 48% proficiency, ranked #80 of 620 in IL (top 13%) — families likely to look elsewhere, expect single-tenant / working-renter base with shorter leases; only 16% free/reduced lunch — higher-income household profile.
- Zoned schools: Mascoutah High School (math 39% / reading 46%, grade F, #73 of 693 statewide, top 11%, 1,227 students, 0% FRL) — zoned schools average 0% FRL vs 16% district-wide (16 pts lower); this property's tenant base skews higher-income than the district average.
- Market conditions: 58 active listings in the ZIP; solid renter incomes; 783 units permitted in St. Clair County in 2024 (378 in 5+ unit buildings).
- This rent is only 15% of the median local income ($95k/yr) — well below the 30% rent-burden line; pricing power to push rent on renewal without tenant pushback.
Forward outlook
- Local home prices are declining (-3.0%/yr); year-one equity from $676 of loan paydown is wiped out by about $3k of value loss. Plan a longer hold.
- St. Clair County population projected at -23% by 2050 — secular population decline; favor cash flow + early exit over multi-decade hold.
- At projected returns (-3.0% appreciation + 3.0% rent growth), your $27k cash investment doubles in ~10 years — after that, you're playing with house money.
Negotiation context
- It's been on market 22 days — a 2% lower offer ($20k) is reasonable based on typical stale-listing flexibility.
Risks & watch-outs
- Watch-outs: property tax is 7.3% of price; built in 1919 — expect roof / HVAC / electrical / plumbing capex.
- Climate carrying-cost: extreme-heat days projected 7→21/yr by 2055 (HVAC capex compounding) — expect insurance premiums to compound above CPI over the hold.
Questions for the listing agent
- Built in 1919 — when were the roof, HVAC, electrical panel, plumbing, and water heater last replaced?
- Property tax is high relative to price — has the assessment been appealed recently, and will the sale trigger a re-assessment?
- Is there a deadline driving the sale (1031 exchange, divorce, estate, relocation)? That informs how much negotiation room exists.
- What's the average days-on-market for RENTAL listings here right now (not sales)? A rising rental-DOM trend means longer vacancies and softer asking-rent achievability than the comps imply.
- What's the recent tenant-quality profile in this submarket — average credit score on applications, eviction rate, late-payment / NSF rate, and stable-employment percentage? A property-management company in the area should have these aggregated.
- How much new for-sale + rental construction is in the pipeline within 1–3 miles? Heavy new supply typically softens prices + rents 12–24 months out; constrained supply supports both.
Investment metrics
- 1% rule
- 1.20% ✓
- Cap rate
- 9.35%
- Cash-on-cash
- 10.90%
- DSCR
- 1.49
- GRM
- 7.0
CMA / ARV
- ARV (median comp)
- $97,810
- List price
- $20,000
- Delta
- -79.55%
- Verdict
- UNDERPRICED
- Comps
- 4 within 1.0 mi
Projected returns pro-forma
-3.0% appreciation · 3.0% rent growth · sell at horizon
- IRR
- 0.0%
- Equity multiple
- 1.00×
- Total profit
- $15
- Equity at exit
- $14,584
- IRR
- 9.7%
- Equity multiple
- 1.75×
- Total profit
- $20,490
- Equity at exit
- $8,457
Cash invested: $27,387 (down + closing). Projections, not guarantees.
Landlord ↔ Tenant lean methodology
- Overall (STATE)
- 43 Moderately Tenant-Leaning
- State Illinois
- 43 Moderately Tenant-Leaning · D+7
- County
- — inherits STATE
- City
- — inherits STATE
ZIP-level market 62258
- Home prices YoY
- -27.2%
- Active inventory
- 58
- Price-to-rent
- 1.4×
Monthly cashflow live
- Estimated rent
- $1,171 medium interval (Pro) →
- Mortgage (P&I)
- −$513
- Tax est. 1.5%
- −$122 /mo · $1,467/yr
- Insurance
- −$41
- HOA
- −$0
- Vacancy / Maint / Mgmt
- −$246
- Net cashflow
- $249
Break-even live
UW: 25.0% down · 7.5% · 30yr · 1.5% tax · 5.0% vac · 8.0% maint · 8.0% mgmt
Financing live
Cash to close
- Down payment
- $24,452
- Closing costs
- $2,934
- Reserves months
- —
- Total cash needed
- —
Loan-product check · same deal, 3 products live
Conventional
25% down · 7.5% · 30yr
- Down + closing
- —
- Monthly P&I
- —
- Monthly cashflow
- —
- DSCR
- —
- Eligible?
- —
Personal DTI + credit; lowest rate.
DSCR
20% down · 8.5% · 30yr
- Down + closing
- —
- Monthly P&I
- —
- Monthly cashflow
- —
- DSCR
- —
- Eligible?
- —
No personal income docs; deal must DSCR.
Hard money
10% down · 12.0% · 12mo
- Down + closing
- —
- Monthly P&I
- —
- Monthly cashflow
- —
- DSCR
- —
- Eligible?
- —
Short-term bridge; refi at stabilization.
Listing history 8 events
-
2026-06-07statusdays on market $20,000 Pending 22 DOM
-
2026-06-03days on market $20,000 Active 20 DOM
-
2026-06-02days on market $20,000 Active 19 DOM
-
2026-06-01days on market $20,000 Active 18 DOM
-
2026-05-31days on market $20,000 Active 17 DOM
-
2026-05-15$20,000 Active 963-char remark
-
2026-05-14historical $20,000 963-char remark
-
1997-10-20soldstatus $29,000
ⓘ Source: listings_history table (triggers on properties + properties_extension) + one-shot
backfill from property_details.listing_events for pre-trigger history.
Climate risk First Street
- Flood 1/10 Low FEMA zone X · 0% chance over 30 yrs
- Wildfire 1/10 Low
- Heat 5/10 Major 7 d/yr ≥106°F today · 21 d/yr by 30 yrs out
- Wind 2/10 Low 100% chance of damaging wind over 30 yrs
- Air quality 2/10 Low 0 unhealthy d/yr today · 1 by 30 yrs out
Nearby sold comps map
Loading sold comps map…
Walkable amenities ~0.75 mi
Loading nearby amenities…
Taxation est. · year 1
- Rental income
- $14,047
- − Mortgage interest
- −$5,479
- − Property taxes
- −$1,467
- − Insurance
- −$489
- − Repairs & maintenance
- −$1,124
- − Management
- −$1,124
- − Depreciation
- −$2,845
- Taxable income
- $1,519
- Est. tax owed @ 24.0%
- −$365
- After-tax cash flow
- $2,621/yr
For passive investors: Depreciation is non-cash, so a rental often shows a tax loss while cash-flowing — sheltering income. Rental losses are passive: they offset passive income freely, and up to $25,000/yr can offset ordinary (W-2) income if you actively participate and your MAGI is under $100k (phasing out to $0 by $150k); unused losses carry forward. On sale, claimed depreciation is recaptured at up to 25%, and gains may owe capital-gains tax (a 1031 exchange can defer both). Figures are a year-1 estimate at your 24.0% rate — not tax advice; consult a CPA.
Schools (NCES district)
- District
- Mascoutah CUD 19
- NCES district ID
- 1724940
- Math proficiency
- 42% ▼ -7.00%
- Reading proficiency
- 48% ▼ -11.00%
- Median HH income
- $69,922
- Composite
- 40.52/100
- National rank
- #3708
- State rank
- #80 of 620 in IL
Livability — Mascoutah
- Score
- 68/100
- State rank
- #471
- US rank
- #9746
Category grades
Schools grade is shown separately in the Schools card above.
Census & demographics
- Census place
- Mascoutah, IL
- County
- Saint Clair County · 169,691 people
- City population
- 10,437
- Metro
- St. Louis, MO-IL
- Population (ZIP)
- 10,437
- Household income
- $94,655
- Rent vs Own
- Severe rent burden
- 209.0
Population outlook (St. Clair County) Hauer SSP2
- Today (2025)
- 250,366 people
- By 2030
- 240,511 · -3.9%
- By 2040
- 217,391 · -13.2%
- By 2050
- 192,699 · -23.0%
- By 2075
- 140,637 · -43.8%
- By 2100
- 100,499 · -59.9%
Race, ethnicity, and origin ACS 2023
- Neighborhood character
- Predominantly White (81%)
- Race & ethnicity
- White 81% Two or more races 8% Hispanic / Latino 7% Black 3% Asian 2% Native American 1%
- Hispanic origin (detail)
- Mexican 2%
- Common ancestry
- Romanian 4% Slovak 2% Italian 2%
- Foreign-born
- 3% · Canada
- Languages at home
- 92% English-only · Spanish 4% Tagalog/Filipino 1% Other Asian/Pacific 1%
Political lean MEDSL · St. Clair
- 2024 margin
- Lean D (+7.9) · D 53.0% · R 45.1% · Other 1.8%
- 2008→2024 swing
- -14.6pp toward R · 2008: 22.4pp · 2024: 7.9pp
- All cycles
- 2024: D+7.9 2020: D+8.7 2016: D+5.6 2012: D+14.5 2008: D+22.4
Not yet ingested
- Civics
- —
Market trends
- HPI YoY
- ▼ -68.21%
- Current HPI
- 182.8448
- Rent YoY
- —
- Metro
- St. Louis, MO-IL
- State GDP YoY
- ▲ 1.59%
- F500 in state
- 60
Industry mix (Fortune 500 HQ in IL)
| Industry | F500 HQs | Revenue |
|---|---|---|
| Insurance | 4 | $201B |
|
||
| Consumer Goods | 4 | $87B |
|
||
| Industrial Machinery | 3 | $64B |
|
||
| Healthcare | 2 | $55B |
|
||
| Retail / Pharmacy | 1 | $148B |
|
||
| Agriculture / Food | 1 | $86B |
|
||
Price history
-31.0% since first listed4 events — show timeline
- 2026-06-05 Pending — MARIS as Distributed by MLS Grid
- 2026-05-15 Listed $20,000 MARIS as Distributed by MLS Grid
- 2026-05-14 Coming Soon $20,000 MARIS as Distributed by MLS Grid
- 1997-10-20 Sold (Public Records) $29,000 Public Records
Property tax history
+2.6%/yrLatest (2024): $1,334 · +4.7% YoY. Source: county tax records.
Cash-flow waterfall
monthlySold comps — $/sqft
last 12 mo · ≤1 miLoading sold comps…