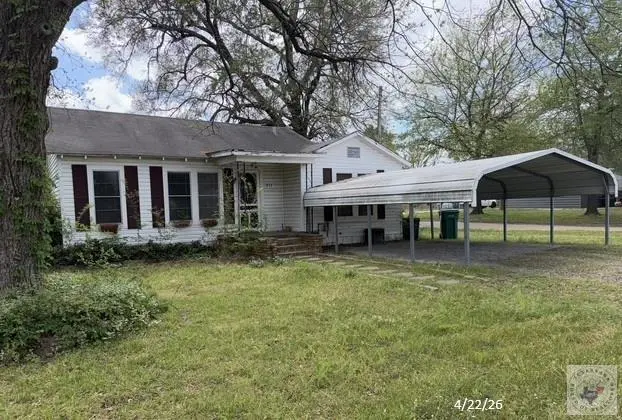
211 SW Front St · New Boston, TX
Flood risk 1/10 · Minimal
- FEMA flood zone
- X (unshaded)
- Chance of flooding over 30 yrs
- 0.0%
- Est. flood insurance / yr
- $507 – $1,088
Fire risk 4/10 · Minor
- Est. fire insurance / yr
- $1,222 – $2,270
Heat risk 7/10 · Major
- Hot days now (above 111°F)
- 7 days/yr
- Hot days in 30 yrs
- 23 days/yr
Wind risk 4/10 · Minor
- Chance of severe wind over 30 yrs
- 21.0%
Air-quality risk 2/10 · Minimal
- Unhealthy air days now
- 1 days/yr
- Unhealthy air days in 30 yrs
- 1 days/yr
Risk factors via First Street. Map © Google.
Why this score? — see what drove the D grade
The composite is a weighted blend of 9 inputs, each scored 0–100. Each bar is that input's sub-score; the figure is the points it added to the 100-point composite (weight × sub-score).
- Cash flow +13.0/30.0
- ARV discount +10.2/15.0
- 1% rule +4.7/10.0
- DSCR +3.9/10.0
- Schools +3.0/10.0
- Livability +3.0/5.0
- Rent growth +2.5/5.0
- Condition / age +2.5/5.0
- Appreciation +0.0/10.0
$79,900
🖨 Deal sheet (PDF) 📄 Offer letter ✓ Due diligence
Listing remarks MLS
Vintage Cottage with that country feel. Close in to downtown, this 2 bdrm, 1 bath home features large living area with built-ins, separate dining area, remodeled kitchen and bath, Laundry room is large enough for your freezer. Fenced backyard with large deck for entertaining, outside cooking area. All on a corner lot and across from the walking trail. Call me for an appointment
Key facts
- Large corner lot
- Fenced yard
- Storage building
Tags
Property features AI
Exterior
- Parking: Detached carport; 2 covered parking spaces; 2 carport spaces; 2 total parking spaces
- Utilities: Public water; Public sewer
- Home design: Single family residence; One story; Frame construction
- Construction: Frame construction; Pillar/post/pier foundation; Composition roof; Built with one level
- Exterior features: Porch; Chain link fencing; Outbuilding; Corner lot; City street frontage
Interior
- Kitchen: Dishwasher; Electric range
- Flooring: Carpet; Vinyl
- Bathrooms: 1 full bathroom
- Heating & cooling: Central heating; Central electric cooling
- Interior features: Blinds; Porch
Neighborhood map
What this means for you Summary
Snapshot
- This is a 2-bed/1.0-bath single-family listed at $80k.
Deal economics
- At list price, monthly cash flow is $-4 ($-50/yr) — negative.
- To cash-flow at today's rent, offer at most $79k (0.9% below list).
- To meet the 1% rule (rent ≥ 1% of price), the offer needs to be $78k (3.0% below list).
- Recommended offer: $78k (3.0% below list) — sets the bar for 1% rule.
Location & tenants
- Location reads 59/100 on livability (#1,178 in TX) — a working-class tenant base; expect higher turnover. Strengths: cost of living A+, housing A+, health & safety A-; Watch: crime F, amenities F, commute F.
- New Boston ISD (town): math 34% / reading 37% proficiency, ranked #518 of 826 in TX (top 63%) — families likely to look elsewhere, expect single-tenant / working-renter base with shorter leases.
- Zoned schools: Crestview El (math 30% / reading 29%, grade F, #2,525 of 4,322 statewide, top 62%, 584 students, 82% FRL); New Boston Middle (math 43% / reading 43%, grade D-, #540 of 1,662 statewide, top 33%, 249 students, 81% FRL); New Boston H S (math 17% / reading 42%, grade F, #1,112 of 1,632 statewide, top 70%, 321 students, 64% FRL) — zoned schools average 76% FRL vs 54% district-wide (22 pts higher); higher-poverty schools than district average — tighter screening recommended.
- Market conditions: 90 active listings in the ZIP; 1 comparable units currently listed for rent nearby; 137 units permitted in Bowie County in 2024 (5 in 5+ unit buildings).
Forward outlook
- Local home prices are declining (-3.0%/yr); year-one equity from $552 of loan paydown is wiped out by about $2k of value loss. Plan a longer hold.
Negotiation context
- It's been on market 54 days — a 3% lower offer ($78k) is reasonable based on typical stale-listing flexibility.
- 5 sale attempts since 6y ago; this cycle's ask has dropped $10k (11%) from the opening price — seller is motivated, your offer sets the floor, not the list.
Risks & watch-outs
- Climate carrying-cost: extreme-heat days projected 7→23/yr by 2055 (HVAC capex compounding) — expect insurance premiums to compound above CPI over the hold.
Questions for the listing agent
- What do current leases actually rent for vs. the listed asking? Can we see a recent rent roll and the last 12 months of T-12 income?
- It's been on market 54 days. Have you received any prior offers? Is the seller open to a 3% concession, seller financing, or rate buy-down credit?
- Is there a deadline driving the sale (1031 exchange, divorce, estate, relocation)? That informs how much negotiation room exists.
- Crime grade is F in this area — have there been break-ins, vandalism, or insurance claims at this property in the last 3 years? What carrier currently insures it and at what premium?
- The area grade is low — what's the realistic commute time and amenity access for the typical tenant pool here? Any planned neighborhood developments (good or bad) we should know about?
- What's the average days-on-market for RENTAL listings here right now (not sales)? A rising rental-DOM trend means longer vacancies and softer asking-rent achievability than the comps imply.
- What's the recent tenant-quality profile in this submarket — average credit score on applications, eviction rate, late-payment / NSF rate, and stable-employment percentage? A property-management company in the area should have these aggregated.
- How much new for-sale + rental construction is in the pipeline within 1–3 miles? Heavy new supply typically softens prices + rents 12–24 months out; constrained supply supports both.
Investment metrics
- 1% rule
- 0.97% ✗
- Cap rate
- 6.23%
- Cash-on-cash
- -0.22%
- DSCR
- 0.99
- GRM
- 8.6
CMA / ARV
- ARV (median comp)
- $84,999
- List price
- $79,900
- Delta
- -6.00%
- Verdict
- FAIR
- Comps
- 9 within 1.0 mi
Show comp detail 6 sales within ~0.75 mi
| Address | Dist | Beds/Ba | Sqft | Sold | Price | $/sf | Match |
|---|---|---|---|---|---|---|---|
| 204 N Merrill | 0.24mi | 2/2.0 | 1,232 (+2%) | 4mo | $62,000 | $50 | 78 |
| 318 N Frost St | 0.45mi | 3/1.0 (+1) | 1,237 (+2%) | 4mo | $51,000 | $41 | 67 |
| 316 N Frost St | 0.43mi | 3/1.0 (+1) | 1,164 (-4%) | 11mo | $120,000 | $103 | 60 |
| 108 E Mcgee Rd | 0.70mi | 2/1.5 | 1,104 (-9%) | 3mo | $84,999 | $77 | 49 |
| 104 Smith | 0.62mi | 2/1.5 | 1,080 (-11%) | 11mo | $135,000 | $125 | 42 |
| 101 Washington Cor | 0.68mi | 3/1.5 (+1) | 1,320 (+9%) | 16mo | $185,000 | $140 | 33 |
Match score weights: distance 35% · size 25% · config 20% · recency 20%. Top-matched comps best support the ARV.
Projected returns pro-forma
-3.0% appreciation · 3.0% rent growth · sell at horizon
- IRR
- -16.6%
- Equity multiple
- 0.41×
- Total profit
- $-13,160
- Equity at exit
- $11,913
- IRR
- -8.2%
- Equity multiple
- 0.48×
- Total profit
- $-11,591
- Equity at exit
- $6,908
Cash invested: $22,372 (down + closing). Projections, not guarantees.
Landlord ↔ Tenant lean methodology
- Overall (STATE)
- 87 Strongly Landlord-Friendly
- State Texas
- 87 Strongly Landlord-Friendly · R+5
- County
- — inherits STATE
- City
- — inherits STATE
ZIP-level market 75570
- Home prices YoY
- -20.1%
- Active inventory
- 90
- Price-to-rent
- 8.6×
Monthly cashflow live
- Estimated rent
- $775 medium interval (Pro) →
- Mortgage (P&I)
- −$419
- Tax from tax record
- −$164 /mo · $1,969/yr
- Insurance
- −$33
- HOA
- −$0
- Vacancy / Maint / Mgmt
- −$163
- Net cashflow
- $-4
Break-even live
Sensitivity live
| Price | -10% $41 | -5% $18 | +0% $-4 | +5% $-27 | +10% $-49 |
|---|---|---|---|---|---|
| Rent | -10% $-65 | -5% $-35 | +0% $-4 | +5% $26 | +10% $57 |
| Rate | -1.0pp $36 | -0.5pp $16 | base $-4 | +0.5pp $-25 | +1.0pp $-46 |
UW: 25.0% down · 7.5% · 30yr · 1.5% tax · 5.0% vac · 8.0% maint · 8.0% mgmt
Financing live
Cash to close
- Down payment
- $19,975
- Closing costs
- $2,397
- Reserves months
- —
- Total cash needed
- —
Loan-product check · same deal, 3 products live
Conventional
25% down · 7.5% · 30yr
- Down + closing
- —
- Monthly P&I
- —
- Monthly cashflow
- —
- DSCR
- —
- Eligible?
- —
Personal DTI + credit; lowest rate.
DSCR
20% down · 8.5% · 30yr
- Down + closing
- —
- Monthly P&I
- —
- Monthly cashflow
- —
- DSCR
- —
- Eligible?
- —
No personal income docs; deal must DSCR.
Hard money
10% down · 12.0% · 12mo
- Down + closing
- —
- Monthly P&I
- —
- Monthly cashflow
- —
- DSCR
- —
- Eligible?
- —
Short-term bridge; refi at stabilization.
Rent comps 1 comps
| Address | Beds | Baths | Sqft | Rent | $/sqft | DOM | Units | Dist |
|---|---|---|---|---|---|---|---|---|
| 200 SE Front St Unit 106 New Boston, TX | 2.0 | 1.0 | 700 | $775 | $1.11 | 45d | 1 | 0.39mi |
Listing history 29 events
-
2026-06-21days on market $79,900 Active 54 DOM
-
2026-06-21days on market $79,900 Active 53 DOM
-
2026-06-18days on market $79,900 Active 51 DOM
-
2026-06-17days on market $79,900 Active 50 DOM
-
2026-06-16days on market $79,900 Active 49 DOM
-
2026-06-15days on market $79,900 Active 48 DOM
-
2026-06-15days on market $79,900 Active 47 DOM
-
2026-06-13days on market $79,900 Active 46 DOM
-
2026-06-12days on market $79,900 Active 45 DOM
-
2026-06-10days on market $79,900 Active 42 DOM
-
2026-06-08days on market $79,900 Active 41 DOM
-
2026-06-08days on market $79,900 Active 40 DOM
-
2026-06-07days on market $79,900 Active 39 DOM
-
2026-06-03pricedays on market $79,900 Active 36 DOM
-
2026-06-02days on market $89,900 Active 35 DOM
-
2026-06-01days on market $89,900 Active 34 DOM
-
2026-05-31days on market $89,900 Active 33 DOM
-
2026-04-28$89,900 Active 564-char remark
-
2024-03-30historical $950
-
2024-03-23$950
-
2024-03-22historical $950
-
2024-02-13$950
-
2024-02-13historical $950
-
2024-02-04$950
-
2023-06-29soldstatus
-
2020-09-28soldstatus
-
2020-09-25soldstatus 380-char remark
Show marketing remark (380 chars)
Vintage Cottage with that country feel. Close in to downtown, this 2 bdrm, 1 bath home features large living area with built-ins, separate dining area, remodeled kitchen and bath, Laundry room is large enough for your freezer. Fenced backyard with large deck for entertaining, outside cooking area. All on a corner lot and across from the walking trail. Call me for an appointment
-
2020-07-28$78,500 380-char remark
Show marketing remark (380 chars)
Vintage Cottage with that country feel. Close in to downtown, this 2 bdrm, 1 bath home features large living area with built-ins, separate dining area, remodeled kitchen and bath, Laundry room is large enough for your freezer. Fenced backyard with large deck for entertaining, outside cooking area. All on a corner lot and across from the walking trail. Call me for an appointment
-
2002-03-21soldstatus
ⓘ Source: listings_history table (triggers on properties + properties_extension) + one-shot
backfill from property_details.listing_events for pre-trigger history.
Tax reassessment forecast TX · Resets to sale price
- Current annual tax
- $1,969 · $164/mo
- Projected year-2 tax
- $1,969 · $164/mo
- Expected delta
- $0/yr ($0/mo · 0.0%)
ⓘ Screening estimate from a state-policy table — verify with the county assessor before closing.
Climate risk First Street
- Flood 1/10 Low FEMA zone X (unshaded) · 0% chance over 30 yrs
- Wildfire 4/10 Moderate
- Heat 7/10 Severe 7 d/yr ≥111°F today · 23 d/yr by 30 yrs out
- Wind 4/10 Moderate 21% chance of damaging wind over 30 yrs
- Air quality 2/10 Low 1 unhealthy d/yr today · 1 by 30 yrs out
Nearby sold comps map
Loading sold comps map…
Walkable amenities ~0.75 mi
Loading nearby amenities…
Taxation est. · year 1
- Rental income
- $9,300
- − Mortgage interest
- −$4,476
- − Property taxes
- −$1,969
- − Insurance
- −$400
- − Repairs & maintenance
- −$744
- − Management
- −$744
- − Depreciation
- −$2,324
- Taxable loss
- −$1,357
- Est. tax savings @ 24.0%
- +$326
- After-tax cash flow
- $276/yr
For passive investors: Depreciation is non-cash, so a rental often shows a tax loss while cash-flowing — sheltering income. Rental losses are passive: they offset passive income freely, and up to $25,000/yr can offset ordinary (W-2) income if you actively participate and your MAGI is under $100k (phasing out to $0 by $150k); unused losses carry forward. On sale, claimed depreciation is recaptured at up to 25%, and gains may owe capital-gains tax (a 1031 exchange can defer both). Figures are a year-1 estimate at your 24.0% rate — not tax advice; consult a CPA.
Schools (NCES district)
- District
- New Boston ISD
- NCES district ID
- 4832340
- Math proficiency
- 34% ▲ 2.00%
- Reading proficiency
- 37% ▼ -2.00%
- Median HH income
- $42,689
- Composite
- 30.06/100
- National rank
- #6351
- State rank
- #518 of 826 in TX
Livability — New Boston
- Score
- 59/100
- State rank
- #1178
- US rank
- #20597
Category grades
Schools grade is shown separately in the Schools card above.
Census & demographics
- Census place
- New Boston, TX
- City population
- 11,047
- Population (ZIP)
- 11,047
Population outlook (Bowie County) Hauer SSP2
- Today (2025)
- 94,699 people
- By 2030
- 94,824 · +0.1%
- By 2040
- 94,870 · +0.2%
- By 2050
- 93,686 · -1.1%
- By 2075
- 90,082 · -4.9%
- By 2100
- 76,579 · -19.1%
Race, ethnicity, and origin ACS 2023
- Neighborhood character
- Predominantly White (70%)
- Race & ethnicity
- White 70% Black 15% Hispanic / Latino 11% Two or more races 5% Native American 1%
- Hispanic origin (detail)
- Mexican 7%
- Common ancestry
- Slovak 1% Portuguese 1% Lithuanian 1%
- Foreign-born
- 3% · Canada
- Languages at home
- 94% English-only · Spanish 6%
Political lean MEDSL · Bowie
- 2024 margin
- Solid R (+48.7) · D 25.3% · R 74.0%
- 2008→2024 swing
- -10.8pp toward R · 2008: -37.9pp · 2024: -48.7pp
- All cycles
- 2024: R+48.7 2020: R+42.8 2016: R+46.6 2012: R+41.5 2008: R+37.9
Not yet ingested
- Civics
- —
Market trends
- HPI YoY
- ▼ -39.50%
- Current HPI
- 156.8696
- Rent YoY
- —
- Metro
- —
- State GDP YoY
- ▲ 3.95%
- F500 in state
- 110
Industry mix (Fortune 500 HQ in TX)
| Industry | F500 HQs | Revenue |
|---|---|---|
| Energy | 16 | $1,198B |
|
||
| Technology | 5 | $198B |
|
||
| Engineering / Construction | 4 | $72B |
|
||
| Energy Services | 3 | $60B |
|
||
| Utilities | 3 | $41B |
|
||
| Healthcare | 2 | $330B |
|
||
Price history
+1.8% since first listed13 events — show timeline
- 2026-06-02 Price Changed $79,900 TBOR
- 2026-04-28 Listed $89,900 TBOR
- 2024-03-30 Rental Removed $950 BUILDIUM
- 2024-03-23 Listed for Rent $950 BUILDIUM
- 2024-03-22 Rental Removed $950 BUILDIUM
- 2024-02-13 Listed for Rent $950 BUILDIUM
- 2024-02-13 Rental Removed $950 BUILDIUM
- 2024-02-04 Listed for Rent $950 BUILDIUM
- 2023-06-29 Sold (Public Records) — Public Records
- 2020-09-28 Sold (Public Records) — Public Records
- 2020-09-25 Sold (MLS) — TBOR
- 2020-07-28 Listed $78,500 TBOR
- 2002-03-21 Sold (Public Records) — Public Records
Property tax history
+5.6%/yrLatest (2025): $1,969 · -1.6% YoY. Source: county tax records.
Cash-flow waterfall
monthlySold comps — $/sqft
last 12 mo · ≤1 miLoading sold comps…