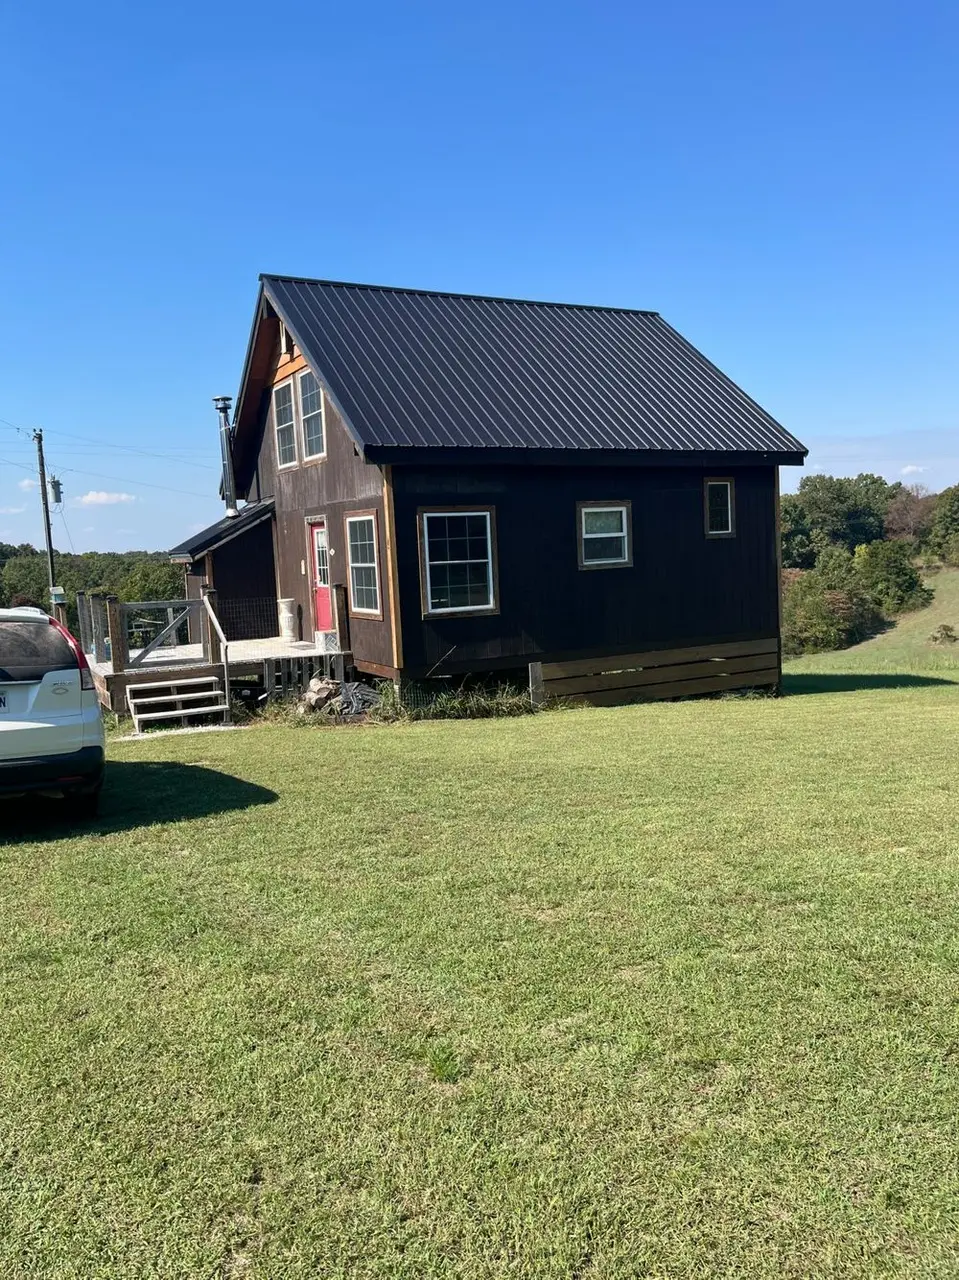
1374 Scotch Hollow Rd · Ginger Blue, MO
Flood risk No data
- FEMA flood zone
- —
- Chance of flooding over 30 yrs
- —
- Est. flood insurance / yr
- —
Fire risk No data
- Est. fire insurance / yr
- —
Heat risk No data
- Hot days now (above threshold)
- —
- Hot days in 30 yrs
- —
Wind risk No data
- Chance of severe wind over 30 yrs
- —
Air-quality risk No data
- Unhealthy air days now
- —
- Unhealthy air days in 30 yrs
- —
Risk factors via First Street. Map © Google.
Why this score? — see what drove the D grade
The composite is a weighted blend of 9 inputs, each scored 0–100. Each bar is that input's sub-score; the figure is the points it added to the 100-point composite (weight × sub-score).
- Cash flow +11.6/30.0
- Appreciation +8.1/10.0
- ARV discount +7.5/15.0
- DSCR +3.4/10.0
- Schools +3.1/10.0
- Livability +2.7/5.0
- Rent growth +2.5/5.0
- Condition / age +2.5/5.0
- 1% rule +2.0/10.0
$120,000
🖨 Deal sheet (PDF) 📄 Offer letter ✓ Due diligence
Listing remarks MLS
4 Acres are included with this Homestead Home. I named it Peaceful Meadows because the location is very peace! Very little traffic with good neighbors! And only 2 miles from Noel. This home has an open floor plan with a loft. Included is a large wood stove for heating and a wood cookstove. There is electricity but you'll need to haul in water. And the toilet is compost. The view from every window is stunning and peaceful. A beautiful homestead waiting for you!
Key facts
- Open floor plan
- 4 acres
- Wood cookstove
Tags
Neighborhood map
What this means for you Summary
Snapshot
- This is a 2-bed/1.0-bath other listed at $120k.
Deal economics
- At list price, monthly cash flow is $-38 ($-453/yr) — negative.
- To cash-flow at today's rent, offer at most $113k (5.6% below list).
- To meet the 1% rule (rent ≥ 1% of price), the offer needs to be $85k (29.6% below list).
- Recommended offer: $85k (29.6% below list) — sets the bar for 1% rule.
Location & tenants
- Location reads 53/100 on livability (#812 in MO) — a working-class tenant base; expect higher turnover. Strengths: cost of living A+; Watch: schools D-, crime F, amenities F.
- Mcdonald County R-I (rural): math 34% / reading 41% proficiency, ranked #192 of 324 in MO (top 59%) — families likely to look elsewhere, expect single-tenant / working-renter base with shorter leases; 61% free/reduced lunch — lower-income household profile, screen leases tightly.
- Market conditions: 61 active listings in the ZIP; 20 units permitted in McDonald County in 2024 (0 in 5+ unit buildings).
Forward outlook
- In year one you build about $8k of equity ($830 loan paydown + $7k appreciation (6.2% local appreciation)).
- McDonald County population projected at -14% by 2050 — secular population decline; favor cash flow + early exit over multi-decade hold.
- At projected returns (6.2% appreciation + 3.0% rent growth), your $34k cash investment doubles in ~4 years — after that, you're playing with house money.
- By year 5, paydown + projected appreciation supports a ~$36k cash-out refi (75% LTV) — recoverable capital for the next deal without selling this one.
Negotiation context
- It's been on market 197 days — a 12% lower offer ($106k) is reasonable based on typical stale-listing flexibility.
Questions for the listing agent
- What do current leases actually rent for vs. the listed asking? Can we see a recent rent roll and the last 12 months of T-12 income?
- It's been on market 197 days. Have you received any prior offers? Is the seller open to a 30% concession, seller financing, or rate buy-down credit?
- Why hasn't it sold? Are there any deal-killer items the seller is aware of (foundation, flood, title, zoning, code violations)?
- Is there a deadline driving the sale (1031 exchange, divorce, estate, relocation)? That informs how much negotiation room exists.
- Schools are D-rated, which usually means shorter tenancies and higher turnover. Who's the typical renter profile here, and what's been the actual vacancy rate?
- Crime grade is F in this area — have there been break-ins, vandalism, or insurance claims at this property in the last 3 years? What carrier currently insures it and at what premium?
- The area grade is low — what's the realistic commute time and amenity access for the typical tenant pool here? Any planned neighborhood developments (good or bad) we should know about?
- What's the average days-on-market for RENTAL listings here right now (not sales)? A rising rental-DOM trend means longer vacancies and softer asking-rent achievability than the comps imply.
- What's the recent tenant-quality profile in this submarket — average credit score on applications, eviction rate, late-payment / NSF rate, and stable-employment percentage? A property-management company in the area should have these aggregated.
- How much new for-sale + rental construction is in the pipeline within 1–3 miles? Heavy new supply typically softens prices + rents 12–24 months out; constrained supply supports both.
Investment metrics
- 1% rule
- 0.70% ✗
- Cap rate
- 5.92%
- Cash-on-cash
- -1.35%
- DSCR
- 0.94
- GRM
- 11.8
CMA / ARV
- ARV (median comp)
- $344,493
- List price
- $120,000
- Delta
- -65.17%
- Verdict
- UNDERPRICED
- Comps
- 3 within 1.0 mi
Projected returns pro-forma
6.16% appreciation · 3.0% rent growth · sell at horizon
- IRR
- 14.6%
- Equity multiple
- 1.99×
- Total profit
- $33,286
- Equity at exit
- $76,613
- IRR
- 14.8%
- Equity multiple
- 3.96×
- Total profit
- $99,380
- Equity at exit
- $139,962
Cash invested: $33,600 (down + closing). Projections, not guarantees.
Landlord ↔ Tenant lean methodology
- Overall (STATE)
- 81 Strongly Landlord-Friendly
- State Missouri
- 81 Strongly Landlord-Friendly · R+10
- County
- — inherits STATE
- City
- — inherits STATE
ZIP-level market 64854
- Home prices YoY
- 4.1%
- Active inventory
- 61
- Price-to-rent
- 11.8×
Monthly cashflow live
- Estimated rent
- $845 medium interval (Pro) →
- Mortgage (P&I)
- −$629
- Tax from tax record
- −$26 /mo · $314/yr
- Insurance
- −$50
- HOA
- −$0
- Vacancy / Maint / Mgmt
- −$178
- Net cashflow
- $-38
Break-even live
Sensitivity live
| Price | -10% $30 | -5% $-4 | +0% $-38 | +5% $-72 | +10% $-106 |
|---|---|---|---|---|---|
| Rent | -10% $-105 | -5% $-71 | +0% $-38 | +5% $-4 | +10% $29 |
| Rate | -1.0pp $23 | -0.5pp $-7 | base $-38 | +0.5pp $-69 | +1.0pp $-100 |
UW: 25.0% down · 7.5% · 30yr · 1.5% tax · 5.0% vac · 8.0% maint · 8.0% mgmt
Financing live
Cash to close
- Down payment
- $30,000
- Closing costs
- $3,600
- Reserves months
- —
- Total cash needed
- —
Loan-product check · same deal, 3 products live
Conventional
25% down · 7.5% · 30yr
- Down + closing
- —
- Monthly P&I
- —
- Monthly cashflow
- —
- DSCR
- —
- Eligible?
- —
Personal DTI + credit; lowest rate.
DSCR
20% down · 8.5% · 30yr
- Down + closing
- —
- Monthly P&I
- —
- Monthly cashflow
- —
- DSCR
- —
- Eligible?
- —
No personal income docs; deal must DSCR.
Hard money
10% down · 12.0% · 12mo
- Down + closing
- —
- Monthly P&I
- —
- Monthly cashflow
- —
- DSCR
- —
- Eligible?
- —
Short-term bridge; refi at stabilization.
Listing history 16 events
-
2026-06-18days on market $120,000 Active 197 DOM
-
2026-06-17days on market $120,000 Active 196 DOM
-
2026-06-16days on market $120,000 Active 195 DOM
-
2026-06-15days on market $120,000 Active 194 DOM
-
2026-06-14days on market $120,000 Active 192 DOM
-
2026-06-13days on market $120,000 Active 191 DOM
-
2026-06-10days on market $120,000 Active 189 DOM
-
2026-06-09days on market $120,000 Active 188 DOM
-
2026-06-08days on market $120,000 Active 187 DOM
-
2026-06-07days on market $120,000 Active 186 DOM
-
2026-06-03days on market $120,000 Active 182 DOM
-
2026-06-02days on market $120,000 Active 181 DOM
-
2026-06-01days on market $120,000 Active 180 DOM
-
2026-05-31days on market $120,000 Active 179 DOM
-
2026-05-31days on market $120,000 Active 178 DOM
-
2025-12-03$120,000 Active 464-char remark
Show marketing remark (464 chars)
4 Acres are included with this Homestead Home. I named it Peaceful Meadows because the location is very peace! Very little traffic with good neighbors! And only 2 miles from Noel. This home has an open floor plan with a loft. Included is a large wood stove for heating and a wood cookstove. There is electricity but you'll need to haul in water. And the toilet is compost. The view from every window is stunning and peaceful. A beautiful homestead waiting for you!
ⓘ Source: listings_history table (triggers on properties + properties_extension) + one-shot
backfill from property_details.listing_events for pre-trigger history.
Tax reassessment forecast MO · Resets to sale price
- Current annual tax
- $314 · $26/mo
- Projected year-2 tax
- $1,164 · $97/mo
- Expected delta
- +$850/yr (+$71/mo · 270.5%)
ⓘ Screening estimate from a state-policy table — verify with the county assessor before closing.
Nearby sold comps map
Loading sold comps map…
Walkable amenities ~0.75 mi
Loading nearby amenities…
Taxation est. · year 1
- Rental income
- $10,143
- − Mortgage interest
- −$6,722
- − Property taxes
- −$314
- − Insurance
- −$600
- − Repairs & maintenance
- −$811
- − Management
- −$811
- − Depreciation
- −$3,491
- Taxable loss
- −$2,607
- Est. tax savings @ 24.0%
- +$626
- After-tax cash flow
- $173/yr
For passive investors: Depreciation is non-cash, so a rental often shows a tax loss while cash-flowing — sheltering income. Rental losses are passive: they offset passive income freely, and up to $25,000/yr can offset ordinary (W-2) income if you actively participate and your MAGI is under $100k (phasing out to $0 by $150k); unused losses carry forward. On sale, claimed depreciation is recaptured at up to 25%, and gains may owe capital-gains tax (a 1031 exchange can defer both). Figures are a year-1 estimate at your 24.0% rate — not tax advice; consult a CPA.
Schools (NCES district)
- District
- Mcdonald County R-I
- NCES district ID
- 2920610
- Math proficiency
- 34% ▼ -8.00%
- Reading proficiency
- 41% ▼ -9.00%
- Median HH income
- $38,301
- Composite
- 31.28/100
- National rank
- #6017
- State rank
- #192 of 324 in MO
Livability — Ginger Blue
- Score
- 53/100
- State rank
- #812
- US rank
- #24354
Category grades
Schools grade is shown separately in the Schools card above.
Census & demographics
- Population (ZIP)
- 4,867
Population outlook (McDonald County) Hauer SSP2
- Today (2025)
- 21,753 people
- By 2030
- 21,154 · -2.8%
- By 2040
- 19,946 · -8.3%
- By 2050
- 18,666 · -14.2%
- By 2075
- 16,201 · -25.5%
- By 2100
- 14,550 · -33.1%
Race, ethnicity, and origin ACS 2023
- Neighborhood character
- Highly diverse neighborhood (Simpson 0.77)
- Race & ethnicity
- White 42% Two or more races 23% Hispanic / Latino 23% Pacific Islander 10% Black 7%
- Hispanic origin (detail)
- Mexican 19%
- Common ancestry
- Lithuanian 2% Portuguese 1% Serbian 1%
- Foreign-born
- 24% · Canada
- Languages at home
- 69% English-only · Spanish 14% Other Asian/Pacific 11%
Political lean MEDSL · McDonald
- 2024 margin
- Solid R (+68.8) · D 15.2% · R 84.0%
- 2008→2024 swing
- -31.3pp toward R · 2008: -37.4pp · 2024: -68.8pp
- All cycles
- 2024: R+68.8 2020: R+66.6 2016: R+64.0 2012: R+48.3 2008: R+37.4
Not yet ingested
- Civics
- —
Market trends
- HPI YoY
- ▲ 6.16%
- Current HPI
- 155.1317
- Rent YoY
- —
- Metro
- —
- State GDP YoY
- ▲ 1.84%
- F500 in state
- 20
Industry mix (Fortune 500 HQ in MO)
| Industry | F500 HQs | Revenue |
|---|---|---|
| Healthcare | 1 | $163B |
|
||
| Insurance | 1 | $21B |
|
||
| Industrial Technology | 1 | $17B |
|
||
| Retail | 1 | $16B |
|
||
| Industrial Distribution | 1 | $10B |
|
||
| Utilities | 1 | $9B |
|
||
Price history
1 event — show timeline
- 2025-12-03 Listed $120,000 ForSaleByOwner.com
Property tax history
+98.6%/yrLatest (2025): $314 · +8.0% YoY. Source: county tax records.
Cash-flow waterfall
monthlySold comps — $/sqft
last 12 mo · ≤1 miLoading sold comps…