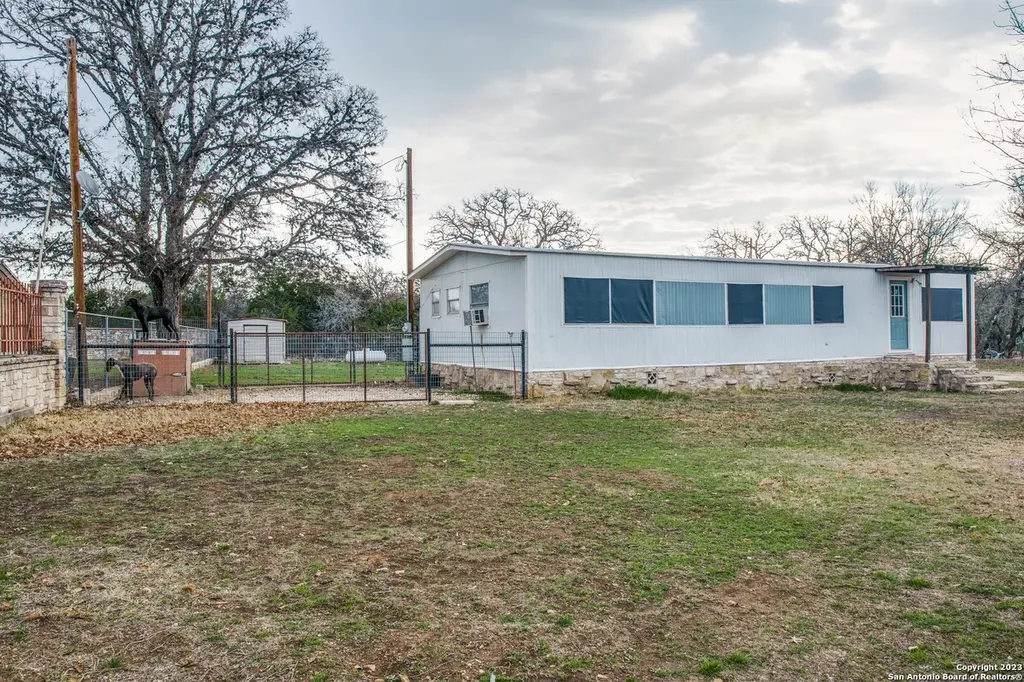
741 Julia Dr · Comfort, TX
Flood risk 4/10 · Minor
- FEMA flood zone
- X (shaded)
- Chance of flooding over 30 yrs
- 0.2%
- Est. flood insurance / yr
- $507 – $1,088
Fire risk 5/10 · Moderate
- Est. fire insurance / yr
- $1,222 – $2,270
Heat risk 7/10 · Major
- Hot days now (above 104°F)
- 7 days/yr
- Hot days in 30 yrs
- 22 days/yr
Wind risk 6/10 · Moderate
- Chance of severe wind over 30 yrs
- 57.0%
Air-quality risk 1/10 · Minimal
- Unhealthy air days now
- 0 days/yr
- Unhealthy air days in 30 yrs
- 0 days/yr
Risk factors via First Street. Map © Google.
Why this score? — see what drove the D grade
The composite is a weighted blend of 9 inputs, each scored 0–100. Each bar is that input's sub-score; the figure is the points it added to the 100-point composite (weight × sub-score).
- ARV discount +15.0/15.0
- Cash flow +7.7/30.0
- Appreciation +5.0/10.0
- Livability +3.2/5.0
- Schools +3.1/10.0
- Rent growth +2.5/5.0
- Condition / age +2.5/5.0
- DSCR +1.8/10.0
- 1% rule +1.4/10.0
$259,000
🖨 Deal sheet (PDF) 📄 Offer letter ✓ Due diligence
Listing remarks
Unrestricted!! Enjoy beautiful sunsets from your back porch at this property located in the charming town of Comfort, Texas. This hidden gem in the hill country is located just down the road from the elementary and middle school, a 3 minute drive to downtown Comfort and out of the flood zone. Tons of shopping, dining, and recreation nearby makes this home's location very sought after. Fully fenced yard with RV hook ups make it easy for guests or a rental opportunity to make passive income. The property is unrestricted and doesn't have an HOA. The current home needs a little TLC and can be redone to your liking, removed to build your dream home, or turned into a cash flow investment. Your op
Key facts
- 0.41 acre lot
- Built 1971
- Listed 1224 days
Property features AI
Finance
- Financial info: Down payment resources available
- HOA & community: Located in the Manor Park subdivision
Exterior
- Utilities: City water; City sewer; Electric service
- Home design: Pre-owned single-family property; Approximate age: 52 years
- Construction: Aluminum exterior; Metal roof; Other foundation (see remarks)
- Exterior features: Covered patio; Storage building / shed; Mature trees; Cross-fenced
Interior
- Kitchen: Eat-in kitchen (12 x 16); Self-cleaning oven; Stove/Range; Dishwasher
- Bedrooms: Master bedroom with walk-in closet and ceiling fan (15 x 12); Second bedroom (12 x 12)
- Flooring: Wood flooring
- Bathrooms: 1 full bathroom
- Heating & cooling: Central heating (electric); Central air conditioning
- Interior features: Ceiling fans; Open floor plan; Eat-in kitchen; Some window coverings remain; Laundry on main level; Washer and dryer connections; Self-cleaning oven; Stove/Range; Dishwasher; Walk-in closets; 1 living area
- Laundry & utility: Washer and dryer connections; Laundry room on main level
Neighborhood map
What this means for you Summary
Snapshot
- This is a 2-bed/2.0-bath manufactured listed at $259k.
Deal economics
- At list price, monthly cash flow is $-300 ($-4k/yr) — negative.
- To cash-flow at today's rent, offer at most $206k (20.4% below list).
- To meet the 1% rule (rent ≥ 1% of price), the offer needs to be $165k (36.3% below list).
- Recommended offer: $165k (36.3% below list) — sets the bar for 1% rule.
- Cap rate 4.9% vs local median 1.8% in Comfort — top-decile yield for the area; either an underpriced asset or a hidden risk that comps aren't pricing in. Stress-test before assuming the spread holds.
Location & tenants
- Location reads 64/100 on livability (#815 in TX) — a middle-class / working-renter tenant base. Strengths: cost of living A+, housing A+, crime A-; Watch: employment C-, amenities F, commute F.
- Comfort ISD (town): math 28% / reading 41% proficiency, ranked #502 of 826 in TX (top 61%) — families likely to look elsewhere, expect single-tenant / working-renter base with shorter leases.
- Zoned schools: Comfort El (math 28% / reading 40%, grade F, #2,149 of 4,322 statewide, top 50%, 497 students, 65% FRL); Comfort Middle (math 20% / reading 37%, grade F, #1,122 of 1,662 statewide, top 69%, 243 students, 54% FRL); Comfort H S (math 57% / reading 57%, grade C, #333 of 1,632 statewide, top 22%, 364 students, 44% FRL) — zoned schools at 54% FRL track the district average.
- Market conditions: 1 active listings in the ZIP; 1 comparable units currently listed for rent nearby; 517 units permitted in Kendall County in 2024 (0 in 5+ unit buildings).
Forward outlook
- In year one you build about $10k of equity ($2k loan paydown + $8k appreciation (3.0% local appreciation)).
- Kendall County population projected at +76% by 2050 — long-run rental-demand tailwind backs the buy-and-hold thesis.
- By year 4, paydown + projected appreciation supports a ~$32k cash-out refi (75% LTV) — recoverable capital for the next deal without selling this one.
Negotiation context
- It's been on market 1224 days — a 12% lower offer ($228k) is reasonable based on typical stale-listing flexibility.
Risks & watch-outs
- Climate carrying-cost: major wind risk, 57% chance of damaging wind over 30y; moderate wildfire risk; extreme-heat days projected 7→22/yr by 2055 (HVAC capex compounding) — expect insurance premiums to compound above CPI over the hold.
Questions for the listing agent
- What do current leases actually rent for vs. the listed asking? Can we see a recent rent roll and the last 12 months of T-12 income?
- It's been on market 1224 days. Have you received any prior offers? Is the seller open to a 36% concession, seller financing, or rate buy-down credit?
- Built in 1971 — when were the roof, HVAC, electrical panel, plumbing, and water heater last replaced?
- Why hasn't it sold? Are there any deal-killer items the seller is aware of (foundation, flood, title, zoning, code violations)?
- Is there a deadline driving the sale (1031 exchange, divorce, estate, relocation)? That informs how much negotiation room exists.
- Schools are F-rated, which usually means shorter tenancies and higher turnover. Who's the typical renter profile here, and what's been the actual vacancy rate?
- The area grade is low — what's the realistic commute time and amenity access for the typical tenant pool here? Any planned neighborhood developments (good or bad) we should know about?
- What's the average days-on-market for RENTAL listings here right now (not sales)? A rising rental-DOM trend means longer vacancies and softer asking-rent achievability than the comps imply.
- What's the recent tenant-quality profile in this submarket — average credit score on applications, eviction rate, late-payment / NSF rate, and stable-employment percentage? A property-management company in the area should have these aggregated.
- How much new for-sale + rental construction is in the pipeline within 1–3 miles? Heavy new supply typically softens prices + rents 12–24 months out; constrained supply supports both.
Investment metrics
- 1% rule
- 0.64% ✗
- Cap rate
- 4.90%
- Cash-on-cash
- -4.96%
- DSCR
- 0.78
- GRM
- 13.1
CMA / ARV
- ARV (median comp)
- $408,938
- List price
- $259,000
- Delta
- -36.67%
- Verdict
- UNDERPRICED
- Comps
- 12 within 1.0 mi
Projected returns pro-forma
3.0% appreciation · 3.0% rent growth · sell at horizon
- IRR
- 2.9%
- Equity multiple
- 1.17×
- Total profit
- $12,022
- Equity at exit
- $116,458
- IRR
- 6.3%
- Equity multiple
- 1.96×
- Total profit
- $69,466
- Equity at exit
- $179,475
Cash invested: $72,520 (down + closing). Projections, not guarantees.
Landlord ↔ Tenant lean methodology
- Overall (STATE)
- 87 Strongly Landlord-Friendly
- State Texas
- 87 Strongly Landlord-Friendly · R+5
- County
- — inherits STATE
- City
- — inherits STATE
ZIP-level market 78013-2030
- Active inventory
- 1
- Price-to-rent
- 13.1×
Monthly cashflow live
- Estimated rent
- $1,650 medium interval (Pro) →
- Mortgage (P&I)
- −$1,358
- Tax from tax record
- −$137 /mo · $1,645/yr
- Insurance
- −$108
- HOA
- −$0
- Vacancy / Maint / Mgmt
- −$346
- Net cashflow
- $-300
Break-even live
Sensitivity live
| Price | -10% $-153 | -5% $-226 | +0% $-300 | +5% $-373 | +10% $-446 |
|---|---|---|---|---|---|
| Rent | -10% $-430 | -5% $-365 | +0% $-300 | +5% $-235 | +10% $-169 |
| Rate | -1.0pp $-169 | -0.5pp $-234 | base $-300 | +0.5pp $-367 | +1.0pp $-435 |
UW: 25.0% down · 7.5% · 30yr · 1.5% tax · 5.0% vac · 8.0% maint · 8.0% mgmt
Financing live
Cash to close
- Down payment
- $64,750
- Closing costs
- $7,770
- Reserves months
- —
- Total cash needed
- —
Loan-product check · same deal, 3 products live
Conventional
25% down · 7.5% · 30yr
- Down + closing
- —
- Monthly P&I
- —
- Monthly cashflow
- —
- DSCR
- —
- Eligible?
- —
Personal DTI + credit; lowest rate.
DSCR
20% down · 8.5% · 30yr
- Down + closing
- —
- Monthly P&I
- —
- Monthly cashflow
- —
- DSCR
- —
- Eligible?
- —
No personal income docs; deal must DSCR.
Hard money
10% down · 12.0% · 12mo
- Down + closing
- —
- Monthly P&I
- —
- Monthly cashflow
- —
- DSCR
- —
- Eligible?
- —
Short-term bridge; refi at stabilization.
Rent comps 1 comps
| Address | Beds | Baths | Sqft | Rent | $/sqft | DOM | Units | Dist |
|---|---|---|---|---|---|---|---|---|
| 823 N Creek Rd Comfort, TX | 1.0–2.0 | 1.0–2.0 | 850 | $1,650 | $1.94 | 0d | 15 | 0.32mi |
Listing history 18 events
-
2026-06-21days on market $259,000 Active 1224 DOM
-
2026-06-18days on market $259,000 Active 1221 DOM
-
2026-06-17days on market $259,000 Active 1220 DOM
-
2026-06-16days on market $259,000 Active 1219 DOM
-
2026-06-15days on market $259,000 Active 1218 DOM
-
2026-06-13days on market $259,000 Active 1216 DOM
-
2026-06-13days on market $259,000 Active 1215 DOM
-
2026-06-09days on market $259,000 Active 1212 DOM
-
2026-06-08days on market $259,000 Active 1211 DOM
-
2026-06-07days on market $259,000 Active 1210 DOM
-
2026-06-04days on market $259,000 Active 1207 DOM
-
2026-06-03days on market $259,000 Active 1206 DOM
-
2026-06-02days on market $259,000 Active 1205 DOM
-
2026-06-01days on market $259,000 Active 1204 DOM
-
2026-05-31days on market $259,000 Active 1203 DOM
-
2023-03-25price $259,000
-
2023-02-13$279,000 New
-
2018-05-31soldstatus
ⓘ Source: listings_history table (triggers on properties + properties_extension) + one-shot
backfill from property_details.listing_events for pre-trigger history.
Tax reassessment forecast TX · Resets to sale price
- Current annual tax
- $1,645 · $137/mo
- Projected year-2 tax
- $4,740 · $395/mo
- Expected delta
- +$3,095/yr (+$258/mo · 188.2%)
ⓘ Screening estimate from a state-policy table — verify with the county assessor before closing.
Climate risk First Street
- Flood 4/10 Moderate FEMA zone X (shaded) · 20% chance over 30 yrs
- Wildfire 5/10 Major
- Heat 7/10 Severe 7 d/yr ≥104°F today · 22 d/yr by 30 yrs out
- Wind 6/10 Major 57% chance of damaging wind over 30 yrs
- Air quality 1/10 Low 0 unhealthy d/yr today · 0 by 30 yrs out
Nearby sold comps map
Loading sold comps map…
Walkable amenities ~0.75 mi
Loading nearby amenities…
Taxation est. · year 1
- Rental income
- $19,800
- − Mortgage interest
- −$14,508
- − Property taxes
- −$1,645
- − Insurance
- −$1,295
- − Repairs & maintenance
- −$1,584
- − Management
- −$1,584
- − Depreciation
- −$7,535
- Taxable loss
- −$8,350
- Est. tax savings @ 24.0%
- +$2,004
- After-tax cash flow
- $-1,592/yr
For passive investors: Depreciation is non-cash, so a rental often shows a tax loss while cash-flowing — sheltering income. Rental losses are passive: they offset passive income freely, and up to $25,000/yr can offset ordinary (W-2) income if you actively participate and your MAGI is under $100k (phasing out to $0 by $150k); unused losses carry forward. On sale, claimed depreciation is recaptured at up to 25%, and gains may owe capital-gains tax (a 1031 exchange can defer both). Figures are a year-1 estimate at your 24.0% rate — not tax advice; consult a CPA.
Schools (NCES district)
- District
- Comfort ISD
- NCES district ID
- 4814790
- Math proficiency
- 28% ▼ -20.00%
- Reading proficiency
- 41% ▼ -3.00%
- Median HH income
- $56,484
- Composite
- 30.51/100
- National rank
- #6214
- State rank
- #502 of 826 in TX
Livability — Comfort
- Score
- 64/100
- State rank
- #815
- US rank
- #14786
Category grades
Schools grade is shown separately in the Schools card above.
Census & demographics
- Census place
- Comfort, TX
Population outlook (Kendall County) Hauer SSP2
- Today (2025)
- 56,273 people
- By 2030
- 64,578 · +14.8%
- By 2040
- 81,624 · +45.1%
- By 2050
- 99,180 · +76.2%
- By 2075
- 144,012 · +155.9%
- By 2100
- 177,185 · +214.9%
Not yet ingested
- Political lean
- —
- Race & ethnicity
- —
- Common origin
- —
- Civics
- —
Market trends
- HPI YoY
- —
- Current HPI
- —
- Rent YoY
- —
- Metro
- —
- State GDP YoY
- ▲ 3.95%
- F500 in state
- 110
Industry mix (Fortune 500 HQ in TX)
| Industry | F500 HQs | Revenue |
|---|---|---|
| Energy | 16 | $1,198B |
|
||
| Technology | 5 | $198B |
|
||
| Engineering / Construction | 4 | $72B |
|
||
| Energy Services | 3 | $60B |
|
||
| Utilities | 3 | $41B |
|
||
| Healthcare | 2 | $330B |
|
||
Price history
-7.2% since first listed3 events — show timeline
- 2023-03-25 Price Changed $259,000 LERA
- 2023-02-13 Listed $279,000 LERA
- 2018-05-31 Sold (Public Records) — Public Records
Property tax history
+3.3%/yrLatest (2025): $1,645 · -1.7% YoY. Source: county tax records.
Cash-flow waterfall
monthlySold comps — $/sqft
last 12 mo · ≤1 miLoading sold comps…