215 E Quiet Village Dr · Donna, TX
Flood risk 6/10 · Moderate
- FEMA flood zone
- X (shaded)
- Chance of flooding over 30 yrs
- 0.68%
- Est. flood insurance / yr
- $507 – $1,088
Fire risk 3/10 · Minor
- Est. fire insurance / yr
- $1,222 – $2,270
Heat risk 9/10 · Severe
- Hot days now (above 111°F)
- 7 days/yr
- Hot days in 30 yrs
- 23 days/yr
Wind risk 8/10 · Major
- Chance of severe wind over 30 yrs
- 99.0%
Air-quality risk 1/10 · Minimal
- Unhealthy air days now
- 0 days/yr
- Unhealthy air days in 30 yrs
- 0 days/yr
Risk factors via First Street. Map © Google.
Why this score? — see what drove the A- grade
The composite is a weighted blend of 9 inputs, each scored 0–100. Each bar is that input's sub-score; the figure is the points it added to the 100-point composite (weight × sub-score).
- Cash flow +30.0/30.0
- ARV discount +15.0/15.0
- 1% rule +10.0/10.0
- DSCR +10.0/10.0
- Appreciation +10.0/10.0
- Livability +2.7/5.0
- Rent growth +2.5/5.0
- Condition / age +2.2/5.0
- Schools +1.1/10.0
$35,000
🖨 Deal sheet (PDF) 📄 Offer letter ✓ Due diligence
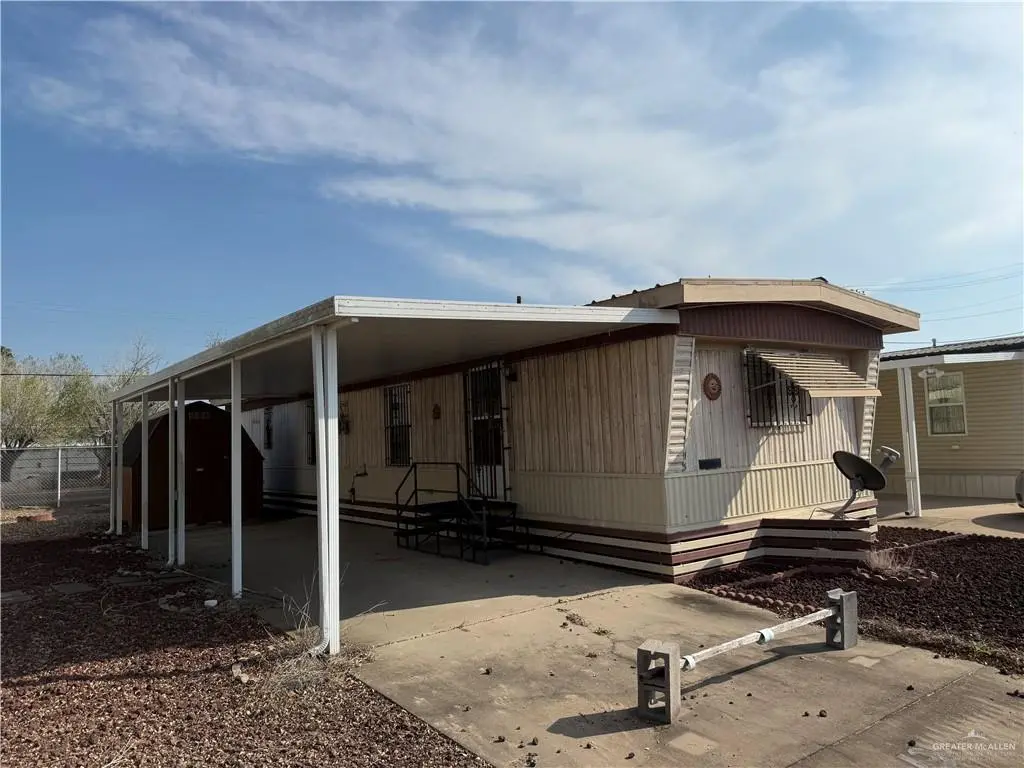
Listing remarks
Take a look at this 2-bedroom, 1-bath mobile home located in a 55 and up community. The mobile home comes fully furnished. Property is being sold as is condition.
Key facts
- 2,800 sq ft lot
- Parking
- Built 1987
Property features AI
Finance
- Other: Living area source: HidalgoCAD
- HOA & community: Quiet Village II association; Mandatory POA; Annual association fee of $250; POA transfer fee of $250; Senior community
Exterior
- Parking: One covered parking space; One carport (no garage)
- Security: Gated community
- Utilities: City sewer; Cable available; Electric service
- Home design: Single-story property; Owner-occupied lot
- Construction: Vinyl siding; Crawl space foundation; Flat roof
- Exterior features: Workshop; Patio; Irregular lot; Paved road access
Interior
- Kitchen: Electric water heater; Other appliance(s)
- Flooring: Laminate flooring
- Bathrooms: 1 full bathroom
- Heating & cooling: Central heating; Central air conditioning; Thermostat
- Interior features: Laminate countertops; Ceiling fan(s); Window coverings (other)
- Laundry & utility: Laundry area with washer/dryer connection
Neighborhood map
What this means for you Summary
Snapshot
- This is a 2-bed/1.0-bath manufactured listed at $35k. Condition is rated fair.
Deal economics
- At list price, monthly cash flow is $335 ($4k/yr) — positive.
- The deal already cash-flows at list — no discount required.
- Meets the 1% rule at list price ($757 rent vs $35k).
- Recommended offer: $34k (1.5% below list) — sets the bar for market timing.
- Cap rate 17.8% vs local median 2.7% in Donna — top-decile yield for the area; either an underpriced asset or a hidden risk that comps aren't pricing in. Stress-test before assuming the spread holds.
Location & tenants
- Location reads 54/100 on livability (#1,411 in TX) — a working-class tenant base; expect higher turnover. Strengths: cost of living A+, housing A; Watch: crime F, amenities F, commute F.
- Donna ISD (suburban): math 11% / reading 18% proficiency, ranked #821 of 826 in TX (top 99%) — low school quality limits family demand, transient renter base, plan for 1-2y turnover.
- Zoned schools: M Rivas Pri Discovery Academy (math 12% / reading 17%, grade F, #4,048 of 4,322 statewide, top 95%, 349 students, 93% FRL); Dora M Sauceda Middle (math 12% / reading 23%, grade F, #1,507 of 1,662 statewide, top 91%, 660 students, 100% FRL); Donna H S (math 16% / reading 21%, grade F, #1,436 of 1,632 statewide, top 88%, 2,095 students, 92% FRL) — zoned schools average 95% FRL vs 48% district-wide (47 pts higher); higher-poverty schools than district average — tighter screening recommended.
- Market conditions: 323 active listings in the ZIP; 15 comparable units currently listed for rent nearby; rentals lingering (median 45d on market — plan ~5-8 weeks vacancy on turnover, expect pricing pressure); 87% of comp listings sitting > 30 days — soft ceiling on asking rent; 7,378 units permitted in Hidalgo County in 2024 (641 in 5+ unit buildings).
Forward outlook
- In year one you build about $4k of equity ($242 loan paydown + $4k appreciation (10.0% local appreciation)).
- Hidalgo County population projected at +28% by 2050 — long-run rental-demand tailwind backs the buy-and-hold thesis.
- At projected returns (10.0% appreciation + 3.0% rent growth), your $10k cash investment doubles in ~2 years — after that, you're playing with house money.
- By year 8, paydown + projected appreciation supports a ~$33k cash-out refi (75% LTV) — recoverable capital for the next deal without selling this one.
Negotiation context
- It's been on market 30 days — a 2% lower offer ($34k) is reasonable based on typical stale-listing flexibility.
Risks & watch-outs
- Climate carrying-cost: major flood risk; severe wind risk, 99% chance of damaging wind over 30y; extreme-heat days projected 7→23/yr by 2055 (HVAC capex compounding) — expect insurance premiums to compound above CPI over the hold.
Questions for the listing agent
- Have any recent inspections been done? Can we get a copy of the seller's disclosures and any deferred-maintenance estimates?
- What does the HOA fee cover, when was the last increase, and are there any pending special assessments or reserve-fund shortfalls?
- Is there a deadline driving the sale (1031 exchange, divorce, estate, relocation)? That informs how much negotiation room exists.
- Schools are F-rated, which usually means shorter tenancies and higher turnover. Who's the typical renter profile here, and what's been the actual vacancy rate?
- Crime grade is F in this area — have there been break-ins, vandalism, or insurance claims at this property in the last 3 years? What carrier currently insures it and at what premium?
- What's the average days-on-market for RENTAL listings here right now (not sales)? A rising rental-DOM trend means longer vacancies and softer asking-rent achievability than the comps imply.
- What's the recent tenant-quality profile in this submarket — average credit score on applications, eviction rate, late-payment / NSF rate, and stable-employment percentage? A property-management company in the area should have these aggregated.
- How much new for-sale + rental construction is in the pipeline within 1–3 miles? Heavy new supply typically softens prices + rents 12–24 months out; constrained supply supports both.
Investment metrics
- 1% rule
- 2.16% ✓
- Cap rate
- 17.78%
- Cash-on-cash
- 41.04%
- DSCR
- 2.83
- GRM
- 3.9
CMA / ARV
- ARV (on-the-fly)
- $50,652
- Comps found
- 2
Show comp detail 2 sales within ~0.75 mi
| Address | Dist | Beds/Ba | Sqft | Sold | Price | $/sf | Match |
|---|---|---|---|---|---|---|---|
| 122 Whisper Meadows Ln | 0.04mi | 2/1.0 | 756 (0%) | 5mo | $39,900 | $53 | 94 |
| 203 Teri St | 0.17mi | 2/1.0 | 728 (-4%) | 10mo | $49,000 | $67 | 78 |
Match score weights: distance 35% · size 25% · config 20% · recency 20%. Top-matched comps best support the ARV.
Projected returns pro-forma
10.0% appreciation · 3.0% rent growth · sell at horizon
- IRR
- 56.1%
- Equity multiple
- 5.13×
- Total profit
- $40,430
- Equity at exit
- $31,531
- IRR
- 49.6%
- Equity multiple
- 11.44×
- Total profit
- $102,324
- Equity at exit
- $67,997
Cash invested: $9,800 (down + closing). Projections, not guarantees.
Landlord ↔ Tenant lean methodology
- Overall (STATE)
- 87 Strongly Landlord-Friendly
- State Texas
- 87 Strongly Landlord-Friendly · R+5
- County
- — inherits STATE
- City
- — inherits STATE
ZIP-level market 78537
- Home prices YoY
- 5.8%
- Active inventory
- 323
- Price-to-rent
- 3.9×
Monthly cashflow live
- Estimated rent
- $757 high interval (Pro) →
- Mortgage (P&I)
- −$184
- Tax est. 1.5%
- −$44 /mo · $525/yr
- Insurance
- −$15
- HOA
- −$21
- Vacancy / Maint / Mgmt
- −$159
- Net cashflow
- $335
Break-even live
Sensitivity live
| Price | -10% $359 | -5% $347 | +0% $335 | +5% $323 | +10% $311 |
|---|---|---|---|---|---|
| Rent | -10% $275 | -5% $305 | +0% $335 | +5% $365 | +10% $395 |
| Rate | -1.0pp $353 | -0.5pp $344 | base $335 | +0.5pp $326 | +1.0pp $317 |
UW: 25.0% down · 7.5% · 30yr · 1.5% tax · 5.0% vac · 8.0% maint · 8.0% mgmt
Financing live
Cash to close
- Down payment
- $8,750
- Closing costs
- $1,050
- Reserves months
- —
- Total cash needed
- —
Loan-product check · same deal, 3 products live
Conventional
25% down · 7.5% · 30yr
- Down + closing
- —
- Monthly P&I
- —
- Monthly cashflow
- —
- DSCR
- —
- Eligible?
- —
Personal DTI + credit; lowest rate.
DSCR
20% down · 8.5% · 30yr
- Down + closing
- —
- Monthly P&I
- —
- Monthly cashflow
- —
- DSCR
- —
- Eligible?
- —
No personal income docs; deal must DSCR.
Hard money
10% down · 12.0% · 12mo
- Down + closing
- —
- Monthly P&I
- —
- Monthly cashflow
- —
- DSCR
- —
- Eligible?
- —
Short-term bridge; refi at stabilization.
Rent comps 15 comps
| Address | Beds | Baths | Sqft | Rent | $/sqft | DOM | Units | Dist |
|---|---|---|---|---|---|---|---|---|
| 310 S Val Verde Rd Unit 22 Donna, TX | 1.0 | 1.5 | 960 | $700 | $0.73 | 44d | 1 | 0.62mi |
| 310 S Val Verde Rd Unit 2 Donna, TX | 1.0 | 1.0 | 540 | $600 | $1.11 | 44d | 1 | 0.62mi |
| 310 S Val Verde Rd Donna, TX | 1.0 | 1.0 | 960 | $700 | $0.73 | 44d | 1 | 0.63mi |
| 422 S Val Verde Rd Unit 68 Donna, TX | 2.0 | 1.0 | 832 | $749 | $0.90 | 44d | 1 | 0.66mi |
| 422 S Val Verde Rd Unit 186 Donna, TX | 3.0 | 2.0 | 960 | $850 | $0.89 | 44d | 1 | 0.72mi |
| 202 W South Ave Donna, TX | 1.0 | 1.0 | 600 | $895 | $1.49 | 44d | 1 | 0.86mi |
| 110 S 3rd St Donna, TX | 2.0 | 2.0 | 884 | $890 | $1.01 | 44d | 1 | 0.95mi |
| 306 E Roberts Ave Donna, TX | 2.0 | 1.0 | 620 | $550 | $0.89 | 44d | 1 | 0.97mi |
| 310 Hester Ave Unit 230 Donna, TX | 3.0 | 2.0 | 960 | $749 | $0.78 | 44d | 1 | 1.08mi |
| 310 Hester Ave Unit 107 Donna, TX | 3.0 | 2.0 | 960 | $799 | $0.83 | 44d | 1 | 1.08mi |
| 310 Hester Ave Trlr 227 Donna, TX | 3.0 | 2.0 | 960 | $799 | $0.83 | 24d | 1 | 1.08mi |
| 310 Scobey Ave Unit 315 Donna, TX | 3.0 | 2.0 | 960 | $799 | $0.83 | 24d | 1 | 1.10mi |
| 310 Scobey Ave Unit 320 Donna, TX | 3.0 | 2.0 | 960 | $749 | $0.78 | 44d | 1 | 1.10mi |
| 109 W Business Highway 83 Donna, TX | 2.0 | 1.0 | 672 | $785 | $1.17 | 44d | 1 | 1.30mi |
| 406 S 10th St Donna, TX | 3.0 | 1.0 | 720 | $850 | $1.18 | 44d | 1 | 1.45mi |
HOA detail
- Monthly dues
- $21 · $252/yr
Listing history 17 events
-
2026-06-18days on market $35,000 Active 30 DOM
-
2026-06-17days on market $35,000 Active 29 DOM
-
2026-06-16days on market $35,000 Active 28 DOM
-
2026-06-15days on market $35,000 Active 27 DOM
-
2026-06-14days on market $35,000 Active 25 DOM
-
2026-06-13days on market $35,000 Active 24 DOM
-
2026-06-10days on market $35,000 Active 22 DOM
-
2026-06-09days on market $35,000 Active 21 DOM
-
2026-06-08days on market $35,000 Active 20 DOM
-
2026-06-07days on market $35,000 Active 19 DOM
-
2026-06-05days on market $35,000 Active 16 DOM
-
2026-06-03days on market $35,000 Active 15 DOM
-
2026-06-02days on market $35,000 Active 14 DOM
-
2026-06-01days on market $35,000 Active 13 DOM
-
2026-05-31days on market $35,000 Active 12 DOM
-
2026-05-31days on market $35,000 Active 11 DOM
-
2026-05-18$35,000 Active
ⓘ Source: listings_history table (triggers on properties + properties_extension) + one-shot
backfill from property_details.listing_events for pre-trigger history.
Climate risk First Street
- Flood 6/10 Major FEMA zone X (shaded) · 68% chance over 30 yrs
- Wildfire 3/10 Moderate
- Heat 9/10 Extreme 7 d/yr ≥111°F today · 23 d/yr by 30 yrs out
- Wind 8/10 Severe 99% chance of damaging wind over 30 yrs
- Air quality 1/10 Low 0 unhealthy d/yr today · 0 by 30 yrs out
Nearby sold comps map
Loading sold comps map…
Walkable amenities ~0.75 mi
Loading nearby amenities…
Taxation est. · year 1
- Rental income
- $9,084
- − Mortgage interest
- −$1,961
- − Property taxes
- −$525
- − Insurance
- −$175
- − Repairs & maintenance
- −$727
- − Management
- −$727
- − HOA
- −$252
- − Depreciation
- −$1,018
- Taxable income
- $3,699
- Est. tax owed @ 24.0%
- −$888
- After-tax cash flow
- $3,134/yr
For passive investors: Depreciation is non-cash, so a rental often shows a tax loss while cash-flowing — sheltering income. Rental losses are passive: they offset passive income freely, and up to $25,000/yr can offset ordinary (W-2) income if you actively participate and your MAGI is under $100k (phasing out to $0 by $150k); unused losses carry forward. On sale, claimed depreciation is recaptured at up to 25%, and gains may owe capital-gains tax (a 1031 exchange can defer both). Figures are a year-1 estimate at your 24.0% rate — not tax advice; consult a CPA.
Condition & rehab AI · 9 photos
This mobile home requires significant updates to its exterior, interior, and landscaping to improve its condition and value.
Repairs flagged
- Major exterior siding — Severe weathering and peeling
- Major kitchen cabinets — Dated and in poor condition
- Major bathroom fixtures — Dated and in poor condition
- Major flooring — Worn and outdated
- Major interior paint — Peeling and outdated
- Major landscaping — Overgrown and lack of curb appeal
Value-add opportunities
- Both New exterior siding and paint — Improves curb appeal and value
- Both Modern kitchen cabinets and appliances — Enhances functionality and aesthetics
- Both Updated bathroom fixtures and decor — Improves functionality and aesthetics
- Both New flooring — Enhances comfort and value
- Both Fresh interior paint — Enhances aesthetics and value
- Both Landscaping and curb appeal improvements — Enhances curb appeal and value
Renovation cost estimate screening
| Repair item | Severity | Est. cost |
|---|---|---|
| exterior siding · Severe weathering and peeling | Major | $15,000–50,000 |
| kitchen cabinets · Dated and in poor condition | Major | $15,000–50,000 |
| bathroom fixtures · Dated and in poor condition | Major | $15,000–50,000 |
| flooring · Worn and outdated | Major | $15,000–50,000 |
| interior paint · Peeling and outdated | Major | $15,000–50,000 |
| landscaping · Overgrown and lack of curb appeal | Major | $15,000–50,000 |
| Total estimated repair cost · 6 items | $90,000–300,000 |
Value-add ROI direction
- Both New exterior siding and paint — Improves curb appeal and value ↑
- Both Modern kitchen cabinets and appliances — Enhances functionality and aesthetics ↑
- Both Updated bathroom fixtures and decor — Improves functionality and aesthetics ↑
- Both New flooring — Enhances comfort and value ↑
- Both Fresh interior paint — Enhances aesthetics and value ↑
- Both Landscaping and curb appeal improvements — Enhances curb appeal and value ↑
ⓘ Cost ranges are severity-bucket heuristics (US national rule-of-thumb). Get contractor quotes + a written scope before underwriting a rehab budget.
Schools (NCES district)
- District
- Donna ISD
- NCES district ID
- 4817390
- Math proficiency
- 11% ▼ -30.00%
- Reading proficiency
- 18% ▼ -13.00%
- Median HH income
- $27,330
- Composite
- 11.16/100
- National rank
- #9728
- State rank
- #821 of 826 in TX
Livability — Donna
- Score
- 54/100
- State rank
- #1411
- US rank
- #24172
Category grades
Schools grade is shown separately in the Schools card above.
Census & demographics
- City population
- 51,346
- Population (ZIP)
- 51,346
Population outlook (Hidalgo County) Hauer SSP2
- Today (2025)
- 955,232 people
- By 2030
- 1,009,774 · +5.7%
- By 2040
- 1,120,332 · +17.3%
- By 2050
- 1,225,036 · +28.2%
- By 2075
- 1,439,189 · +50.7%
- By 2100
- 1,533,429 · +60.5%
Race, ethnicity, and origin ACS 2023
- Neighborhood character
- Predominantly Hispanic (95%)
- Race & ethnicity
- Hispanic / Latino 95% Two or more races 49% White 4%
- Hispanic origin (detail)
- Mexican 91%
- Foreign-born
- 27% · Canada
- Languages at home
- 15% English-only · Spanish 84%
Political lean MEDSL · Hidalgo
- 2024 margin
- Toss-up / Even · D 48.1% · R 51.0%
- 2008→2024 swing
- -41.6pp toward R · 2008: 38.7pp · 2024: -2.9pp
- All cycles
- 2024: R+2.9 2020: D+17.1 2016: D+40.5 2012: D+41.8 2008: D+38.7
Not yet ingested
- Civics
- —
Market trends
- HPI YoY
- ▲ 13.30%
- Current HPI
- 243.3933
- Rent YoY
- —
- Metro
- —
- State GDP YoY
- ▲ 3.95%
- F500 in state
- 110
Industry mix (Fortune 500 HQ in TX)
| Industry | F500 HQs | Revenue |
|---|---|---|
| Energy | 16 | $1,198B |
|
||
| Technology | 5 | $198B |
|
||
| Engineering / Construction | 4 | $72B |
|
||
| Energy Services | 3 | $60B |
|
||
| Utilities | 3 | $41B |
|
||
| Healthcare | 2 | $330B |
|
||
Price history
1 event — show timeline
- 2026-05-18 Listed $35,000 MCALLENMLS
Cash-flow waterfall
monthlySold comps — $/sqft
last 12 mo · ≤1 miLoading sold comps…