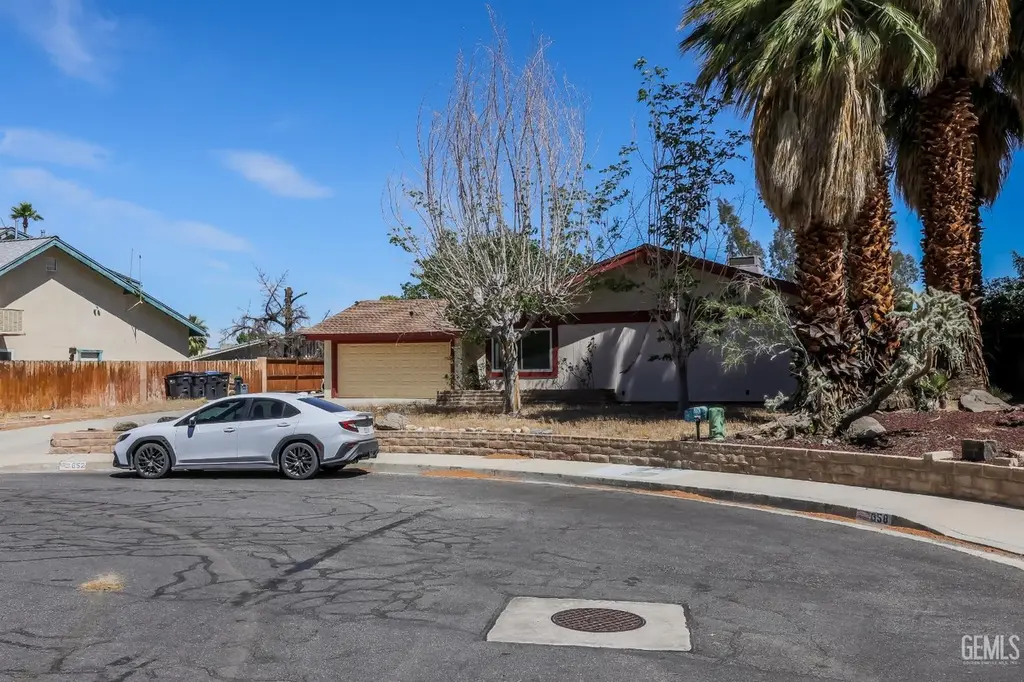
652 Sonja Ave · Ridgecrest, CA
Flood risk No data
- FEMA flood zone
- —
- Chance of flooding over 30 yrs
- —
- Est. flood insurance / yr
- —
Fire risk No data
- Est. fire insurance / yr
- —
Heat risk No data
- Hot days now (above threshold)
- —
- Hot days in 30 yrs
- —
Wind risk No data
- Chance of severe wind over 30 yrs
- —
Air-quality risk No data
- Unhealthy air days now
- —
- Unhealthy air days in 30 yrs
- —
Risk factors via First Street. Map © Google.
Why this score? — see what drove the D grade
The composite is a weighted blend of 9 inputs, each scored 0–100. Each bar is that input's sub-score; the figure is the points it added to the 100-point composite (weight × sub-score).
- ARV discount +14.3/15.0
- Cash flow +9.9/30.0
- Livability +3.5/5.0
- Rent growth +3.4/5.0
- Schools +2.9/10.0
- DSCR +2.8/10.0
- Condition / age +2.5/5.0
- 1% rule +2.1/10.0
- Appreciation +0.0/10.0
$299,000
🖨 Deal sheet (PDF) 📄 Offer letter ✓ Due diligence
Listing remarks MLS
This home has great potential. Large 4/2 home in a desirable area of RIdgecrest. This home has RV parking and a built in pool. It needs some TLC to make you feel right at home. The home is freshly painted and newly remodeled kitchen w new appliances. The current owner left the carpet out of the rooms so you have time to pick your own color and seller will credit at escrow or have installed prior to close.
Key facts
- Built in pool
- Rv parking
- Freshly painted
Tags
Neighborhood map
What this means for you Summary
Snapshot
- This is a 4-bed/2.0-bath single-family listed at $299k.
Deal economics
- At list price, monthly cash flow is $-186 ($-2k/yr) — negative.
- To cash-flow at today's rent, offer at most $266k (11.0% below list).
- To meet the 1% rule (rent ≥ 1% of price), the offer needs to be $211k (29.3% below list).
- Recommended offer: $211k (29.3% below list) — sets the bar for 1% rule.
- Cap rate 5.5% vs local median 4.0% in Ridgecrest — top-decile yield for the area; either an underpriced asset or a hidden risk that comps aren't pricing in. Stress-test before assuming the spread holds.
Location & tenants
- Location reads 70/100 on livability (#243 in CA) — a middle-class / working-renter tenant base. Strengths: commute A+, housing A+; Watch: amenities D+, cost of living D+, crime F.
- Sierra Sands Unified (town): math 25% / reading 39% proficiency, ranked #294 of 517 in CA (top 57%) — families likely to look elsewhere, expect single-tenant / working-renter base with shorter leases.
- Zoned schools: Las Flores Elementary (math 35% / reading 44%, grade F, #621 of 1,571 statewide, top 42%, 526 students, 38% FRL); James Monroe Middle (math 16% / reading 29%, grade F, #382 of 498 statewide, top 78%, 548 students, 49% FRL); Burroughs High (math 37% / reading 70%, grade C-, #281 of 1,170 statewide, top 24%, 1,479 students, 40% FRL) — zoned schools at 42% FRL track the district average.
- Market conditions: Rents rising (+3.6%/yr); 332 active listings in the ZIP; 21 comparable units currently listed for rent nearby; rentals leasing fast (median 5d on market — plan ~1-2 weeks tenant-placement turnaround); solid renter incomes; 3,244 units permitted in Kern County in 2024 (73 in 5+ unit buildings).
Forward outlook
- Local home prices are declining (-3.0%/yr); year-one equity from $2k of loan paydown is wiped out by about $9k of value loss. Plan a longer hold.
- Kern County population projected at +17% by 2050 — long-run rental-demand tailwind backs the buy-and-hold thesis.
Negotiation context
- It's been on market 32 days — a 3% lower offer ($290k) is reasonable based on typical stale-listing flexibility.
Questions for the listing agent
- What do current leases actually rent for vs. the listed asking? Can we see a recent rent roll and the last 12 months of T-12 income?
- It's been on market 32 days. Have you received any prior offers? Is the seller open to a 29% concession, seller financing, or rate buy-down credit?
- Built in 1972 — when were the roof, HVAC, electrical panel, plumbing, and water heater last replaced?
- Is there a deadline driving the sale (1031 exchange, divorce, estate, relocation)? That informs how much negotiation room exists.
- Crime grade is F in this area — have there been break-ins, vandalism, or insurance claims at this property in the last 3 years? What carrier currently insures it and at what premium?
- The area grade is low — what's the realistic commute time and amenity access for the typical tenant pool here? Any planned neighborhood developments (good or bad) we should know about?
- What's the average days-on-market for RENTAL listings here right now (not sales)? A rising rental-DOM trend means longer vacancies and softer asking-rent achievability than the comps imply.
- What's the recent tenant-quality profile in this submarket — average credit score on applications, eviction rate, late-payment / NSF rate, and stable-employment percentage? A property-management company in the area should have these aggregated.
- How much new for-sale + rental construction is in the pipeline within 1–3 miles? Heavy new supply typically softens prices + rents 12–24 months out; constrained supply supports both.
Investment metrics
- 1% rule
- 0.71% ✗
- Cap rate
- 5.55%
- Cash-on-cash
- -2.66%
- DSCR
- 0.88
- GRM
- 11.8
CMA / ARV
- ARV (median comp)
- $352,535
- List price
- $299,000
- Delta
- -15.19%
- Verdict
- UNDERPRICED
- Comps
- 20 within 1.0 mi
Show comp detail 12 sales within ~0.75 mi
| Address | Dist | Beds/Ba | Sqft | Sold | Price | $/sf | Match |
|---|---|---|---|---|---|---|---|
| 652 Sonja Ave | 0.00mi | 4/2.0 | 1,995 (0%) | 1mo | $309,200 | $155 | 99 |
| 1013 Scott St | 0.28mi | 3/2.0 (-1) | 1,971 (-1%) | 2mo | $278,000 | $141 | 78 |
| 731 Randall St | 0.29mi | 4/2.0 | 1,893 (-5%) | 3mo | $195,000 | $103 | 76 |
| 817 Paradise Dr | 0.52mi | 4/2.0 | 1,972 (-1%) | 0mo | $419,000 | $212 | 73 |
| 964 Roosevelt St | 0.61mi | 4/2.0 | 1,919 (-4%) | 2mo | $338,000 | $176 | 63 |
| 515 N Las Posas St | 0.52mi | 4/2.0 | 1,815 (-9%) | 2mo | $275,000 | $152 | 59 |
| 905 Cimarron Ct | 0.50mi | 4/2.5 | 2,210 (+11%) | 1mo | $310,000 | $140 | 56 |
| 1208 Windy Lynn Ave | 0.69mi | 3/2.0 (-1) | 2,107 (+6%) | 0mo | $410,000 | $195 | 53 |
| 529 W Joyner Ave | 0.50mi | 3/2.0 (-1) | 1,750 (-12%) | 1mo | $340,000 | $194 | 51 |
| 438 W Ward Ave | 0.63mi | 3/2.0 (-1) | 1,789 (-10%) | 1mo | $295,000 | $165 | 48 |
| 934 Roosevelt St | 0.59mi | 3/2.5 (-1) | 1,749 (-12%) | 3mo | $305,000 | $174 | 42 |
| 1113 Evelyn Ct. Ct | 0.73mi | 3/2.0 (-1) | 1,710 (-14%) | 0mo | $260,000 | $152 | 37 |
Match score weights: distance 35% · size 25% · config 20% · recency 20%. Top-matched comps best support the ARV.
Projected returns pro-forma
-3.0% appreciation · 3.58% rent growth · sell at horizon
- IRR
- -20.2%
- Equity multiple
- 0.29×
- Total profit
- $-59,131
- Equity at exit
- $44,582
- IRR
- -12.2%
- Equity multiple
- 0.26×
- Total profit
- $-61,963
- Equity at exit
- $25,852
Cash invested: $83,720 (down + closing). Projections, not guarantees.
Landlord ↔ Tenant lean methodology
- Overall (STATE)
- 18 Strongly Tenant-Friendly
- State California
- 18 Strongly Tenant-Friendly · D+13
- County
- — inherits STATE
- City
- — inherits STATE
ZIP-level market 93555
- Home prices YoY
- -24.0%
- Rents YoY
- 3.6%
- Active inventory
- 332
- Price-to-rent
- 11.8×
Monthly cashflow live
- Estimated rent
- $2,113 high interval (Pro) →
- Mortgage (P&I)
- −$1,568
- Tax from tax record
- −$162 /mo · $1,946/yr
- Insurance
- −$125
- HOA
- −$0
- Vacancy / Maint / Mgmt
- −$444
- Net cashflow
- $-186
Break-even live
Sensitivity live
| Price | -10% $-16 | -5% $-101 | +0% $-186 | +5% $-270 | +10% $-355 |
|---|---|---|---|---|---|
| Rent | -10% $-353 | -5% $-269 | +0% $-186 | +5% $-102 | +10% $-19 |
| Rate | -1.0pp $-35 | -0.5pp $-110 | base $-186 | +0.5pp $-263 | +1.0pp $-342 |
UW: 25.0% down · 7.5% · 30yr · 1.5% tax · 5.0% vac · 8.0% maint · 8.0% mgmt
Financing live
Cash to close
- Down payment
- $74,750
- Closing costs
- $8,970
- Reserves months
- —
- Total cash needed
- —
Loan-product check · same deal, 3 products live
Conventional
25% down · 7.5% · 30yr
- Down + closing
- —
- Monthly P&I
- —
- Monthly cashflow
- —
- DSCR
- —
- Eligible?
- —
Personal DTI + credit; lowest rate.
DSCR
20% down · 8.5% · 30yr
- Down + closing
- —
- Monthly P&I
- —
- Monthly cashflow
- —
- DSCR
- —
- Eligible?
- —
No personal income docs; deal must DSCR.
Hard money
10% down · 12.0% · 12mo
- Down + closing
- —
- Monthly P&I
- —
- Monthly cashflow
- —
- DSCR
- —
- Eligible?
- —
Short-term bridge; refi at stabilization.
Rent comps 21 comps
| Address | Beds | Baths | Sqft | Rent | $/sqft | DOM | Units | Dist |
|---|---|---|---|---|---|---|---|---|
| 818 Sherri St Ridgecrest, CA | 4.0 | 2.0 | 2087 | $2,400 | $1.15 | 5d | 1 | 0.09mi |
| 1019 Peg St Ridgecrest, CA | 4.0 | 2.0 | 1458 | $1,800 | $1.23 | 5d | 1 | 0.24mi |
| 1019 Scott St Ridgecrest, CA | 3.0 | 2.0 | 1700 | $3,400 | $2.00 | 5d | 1 | 0.29mi |
| 401 Tepatitlan Ct Ridgecrest, CA | 4.0 | 3.0 | 2062 | $2,000 | $0.97 | 5d | 1 | 0.48mi |
| 1127 N Mono Ct Ridgecrest, CA | 3.0 | 2.0 | 1234 | $1,900 | $1.54 | 12d | 1 | 0.53mi |
| 1105 Rebecca Ave Ridgecrest, CA | 4.0 | 2.0 | 1807 | $2,400 | $1.33 | 21d | 1 | 0.56mi |
| 932 Kinnett Ave Ridgecrest, CA | 3.0 | 2.0 | 1236 | $1,550 | $1.25 | 5d | 1 | 0.57mi |
| 533 W Ward Ave Unit C Ridgecrest, CA | 3.0 | 2.5 | 1295 | $1,300 | $1.00 | 21d | 1 | 0.58mi |
| 401 N Norma St Ridgecrest, CA | 3.0 | 2.0 | 1360 | $1,500 | $1.10 | 5d | 1 | 0.58mi |
| 228 Yellowstone Pl Ridgecrest, CA | 3.0 | 2.0 | 1871 | $2,100 | $1.12 | 5d | 1 | 0.61mi |
| 212 Washington Way Ridgecrest, CA | 4.0 | 2.0 | 1785 | $1,880 | $1.05 | 5d | 1 | 0.61mi |
| 418 Mount Baldy Cir Ridgecrest, CA | 3.0 | 2.0 | 1497 | $1,950 | $1.30 | 5d | 1 | 0.63mi |
| 428 W Ward Ave Ridgecrest, CA | 3.0 | 2.0 | 1498 | $1,850 | $1.23 | 5d | 1 | 0.66mi |
| 247 Peg St Ridgecrest, CA | 3.0 | 2.0 | 1876 | $1,500 | $0.80 | 5d | 1 | 0.74mi |
| 225 N Helena St Ridgecrest, CA | 3.0 | 2.0 | 1527 | $1,750 | $1.15 | 5d | 1 | 0.83mi |
| 1128 Argus Ave Ridgecrest, CA | 3.0 | 2.0 | 1346 | $11,800 | $8.77 | 46d | 1 | 0.89mi |
| 604 W Perdew Ave Apt C Ridgecrest, CA | 3.0 | 2.0 | 1384 | $1,150 | $0.83 | 46d | 1 | 0.92mi |
| 419 Jean Ave Ridgecrest, CA | 3.0 | 2.0 | 1583 | $1,585 | $1.00 | 5d | 1 | 0.94mi |
| 740 W Church Ave Ridgecrest, CA | 4.0 | 2.0 | 1500 | $1,800 | $1.20 | 21d | 1 | 1.17mi |
| 320 Vista St Ridgecrest, CA | 4.0 | 2.0 | 1556 | $1,950 | $1.25 | 46d | 1 | 1.39mi |
| 432 Thomas St Ridgecrest, CA | 4.0 | 2.0 | 1904 | $2,500 | $1.31 | 5d | 1 | 1.49mi |
Listing history 2 events
-
2026-05-18status Pending 408-char remark
Show marketing remark (408 chars)
This home has great potential. Large 4/2 home in a desirable area of RIdgecrest. This home has RV parking and a built in pool. It needs some TLC to make you feel right at home. The home is freshly painted and newly remodeled kitchen w new appliances. The current owner left the carpet out of the rooms so you have time to pick your own color and seller will credit at escrow or have installed prior to close.
-
2026-04-16$299,000 Active 408-char remark
Show marketing remark (408 chars)
This home has great potential. Large 4/2 home in a desirable area of RIdgecrest. This home has RV parking and a built in pool. It needs some TLC to make you feel right at home. The home is freshly painted and newly remodeled kitchen w new appliances. The current owner left the carpet out of the rooms so you have time to pick your own color and seller will credit at escrow or have installed prior to close.
ⓘ Source: listings_history table (triggers on properties + properties_extension) + one-shot
backfill from property_details.listing_events for pre-trigger history.
Tax reassessment forecast CA · Resets to sale price
- Current annual tax
- $1,946 · $162/mo
- Projected year-2 tax
- $2,272 · $189/mo
- Expected delta
- +$327/yr (+$27/mo · 16.8%)
ⓘ Screening estimate from a state-policy table — verify with the county assessor before closing.
Nearby sold comps map
Loading sold comps map…
Walkable amenities ~0.75 mi
Loading nearby amenities…
Taxation est. · year 1
- Rental income
- $25,353
- − Mortgage interest
- −$16,749
- − Property taxes
- −$1,946
- − Insurance
- −$1,495
- − Repairs & maintenance
- −$2,028
- − Management
- −$2,028
- − Depreciation
- −$8,698
- Taxable loss
- −$7,591
- Est. tax savings @ 24.0%
- +$1,822
- After-tax cash flow
- $-406/yr
For passive investors: Depreciation is non-cash, so a rental often shows a tax loss while cash-flowing — sheltering income. Rental losses are passive: they offset passive income freely, and up to $25,000/yr can offset ordinary (W-2) income if you actively participate and your MAGI is under $100k (phasing out to $0 by $150k); unused losses carry forward. On sale, claimed depreciation is recaptured at up to 25%, and gains may owe capital-gains tax (a 1031 exchange can defer both). Figures are a year-1 estimate at your 24.0% rate — not tax advice; consult a CPA.
Schools (NCES district)
- District
- Sierra Sands Unified
- NCES district ID
- 0636800
- Math proficiency
- 25% ▼ -11.00%
- Reading proficiency
- 39% ▼ -11.00%
- Median HH income
- $58,937
- Composite
- 28.66/100
- National rank
- #6699
- State rank
- #294 of 517 in CA
Livability — Ridgecrest
- Score
- 70/100
- State rank
- #243
- US rank
- #8014
Category grades
Schools grade is shown separately in the Schools card above.
Census & demographics
- Census place
- Ridgecrest, CA
- County
- Kern County · 710,371 people
- City population
- 33,845
- Metro
- Bakersfield, CA
- Population (ZIP)
- 33,845
- Household income
- $86,700
- Rent vs Own
- Severe rent burden
- 975.0
Population outlook (Kern County) Hauer SSP2
- Today (2025)
- 947,286 people
- By 2030
- 978,984 · +3.3%
- By 2040
- 1,045,018 · +10.3%
- By 2050
- 1,105,232 · +16.7%
- By 2075
- 1,229,538 · +29.8%
- By 2100
- 1,238,059 · +30.7%
Race, ethnicity, and origin ACS 2023
- Neighborhood character
- Majority White (65%)
- Race & ethnicity
- White 65% Hispanic / Latino 20% Two or more races 12% Black 4% Asian 4% Native American 1%
- Hispanic origin (detail)
- Mexican 15%
- Common ancestry
- Italian 4% Lithuanian 2% Slovak 2%
- Foreign-born
- 7% · Canada
- Languages at home
- 84% English-only · Spanish 11% Other Indo-European 1% Other Asian/Pacific 1%
Political lean MEDSL · Kern
- 2024 margin
- Strong R (+21.1) · D 38.2% · R 59.3% · Other 2.5%
- 2008→2024 swing
- -3.3pp toward R · 2008: -17.8pp · 2024: -21.1pp
- All cycles
- 2024: R+21.1 2020: R+10.2 2016: R+15.0 2012: R+20.9 2008: R+17.8
Not yet ingested
- Civics
- —
Market trends
- HPI YoY
- ▼ -120.17%
- Current HPI
- 380.5208
- Rent YoY
- ▲ 3.58%
- Metro
- Bakersfield, CA
- State GDP YoY
- ▲ 3.21%
- F500 in state
- 116
Industry mix (Fortune 500 HQ in CA)
| Industry | F500 HQs | Revenue |
|---|---|---|
| Technology | 27 | $1,492B |
|
||
| Financial Services | 3 | $174B |
|
||
| Retail | 3 | $44B |
|
||
| Insurance | 3 | $26B |
|
||
| Media / Entertainment | 2 | $115B |
|
||
| Pharmaceuticals / Biotech | 2 | $62B |
|
||
Price history
2 events — show timeline
- 2026-05-18 Pending — GEMLS
- 2026-04-16 Listed $299,000 GEMLS
Property tax history
+2.8%/yrLatest (2025): $1,946 · +5.4% YoY. Source: county tax records.
Cash-flow waterfall
monthlySold comps — $/sqft
last 12 mo · ≤1 miLoading sold comps…