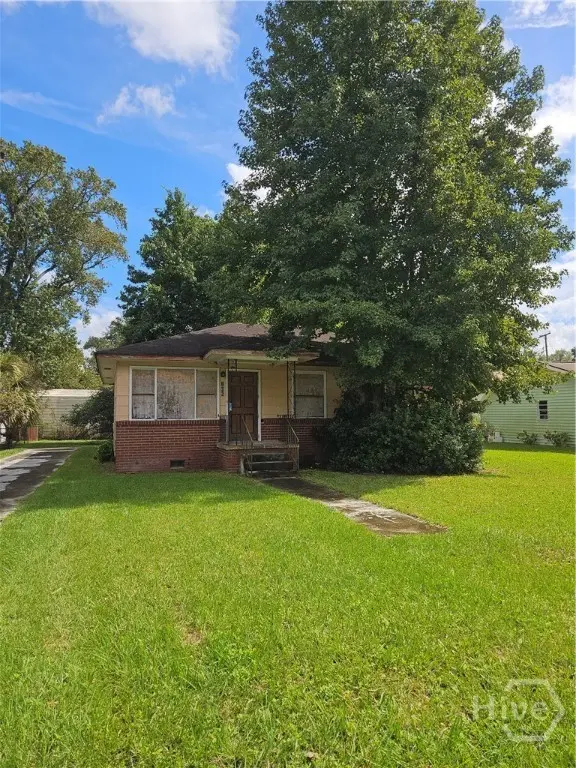
106 Gordon St · Port Wentworth, GA
Flood risk 1/10 · Minimal
- FEMA flood zone
- X (unshaded)
- Chance of flooding over 30 yrs
- 0.0%
- Est. flood insurance / yr
- $507 – $1,088
Fire risk 2/10 · Minimal
- Est. fire insurance / yr
- $963 – $1,789
Heat risk 9/10 · Severe
- Hot days now (above 109°F)
- 7 days/yr
- Hot days in 30 yrs
- 17 days/yr
Wind risk 8/10 · Major
- Chance of severe wind over 30 yrs
- 99.0%
Air-quality risk 5/10 · Moderate
- Unhealthy air days now
- 7 days/yr
- Unhealthy air days in 30 yrs
- 8 days/yr
Risk factors via First Street. Map © Google.
Why this score? — see what drove the B+ grade
The composite is a weighted blend of 9 inputs, each scored 0–100. Each bar is that input's sub-score; the figure is the points it added to the 100-point composite (weight × sub-score).
- Cash flow +30.0/30.0
- ARV discount +15.0/15.0
- 1% rule +10.0/10.0
- DSCR +10.0/10.0
- Appreciation +4.1/10.0
- Livability +3.4/5.0
- Condition / age +2.5/5.0
- Schools +2.0/10.0
- Rent growth +1.6/5.0
$106,500
🖨 Deal sheet 📄 Offer letter ✓ Due diligence
Listing remarks MLS
Calling all Investors, Builders and Renovators to transform this diamond in a rough into a prized jewel. This home is currently 1138 sqft 3 bed 2 bath yet has potential for more by adding on or tear down to rebuild a bigger and better home to accommodate a larger family. This property is situated on .20 ac lot with street and off street parking. This property is in walking distance to public transportation, parks, recreation center and Port City GA. Enjoy the short commute to Downtown Port Wentworth. Dont wait to take advantage of this grand opportunity for a grand investment. Place your offer today!!!
Key facts
- 8,712 sq ft lot
- Built 1955
- Listed 189 days
Neighborhood map
What this means for you Summary
Snapshot
- This is a 3-bed/2.0-bath single-family listed at $106k.
Deal economics
- At list price, monthly cash flow is $839 ($10k/yr) — positive.
- The deal already cash-flows at list — no discount required.
- Meets the 1% rule at list price ($2k rent vs $106k).
- Recommended offer: $94k (12.0% below list) — sets the bar for market timing.
- Cap rate 15.7% vs local median 4.1% in Port Wentworth — top-decile yield for the area; either an underpriced asset or a hidden risk that comps aren't pricing in. Stress-test before assuming the spread holds.
Location & tenants
- Location reads 67/100 on livability (#173 in GA) — a middle-class / working-renter tenant base. Strengths: housing A+, cost of living A, crime A-; Watch: schools F, amenities F, commute F.
- Savannah-Chatham County (urban): math 20% / reading 26% proficiency, ranked #134 of 174 in GA (top 77%) — low school quality limits family demand, transient renter base, plan for 1-2y turnover.
- Market conditions: Rents falling (-3.5%/yr); 379 active listings in the ZIP; 1 comparable units currently listed for rent nearby; solid renter incomes; 2,694 units permitted in Chatham County in 2024 (973 in 5+ unit buildings).
Forward outlook
- Local home prices are declining (-1.9%/yr); year-one equity from $736 of loan paydown is wiped out by about $2k of value loss. Plan a longer hold.
- Chatham County population projected at +33% by 2050 — long-run rental-demand tailwind backs the buy-and-hold thesis.
- At projected returns (-1.9% appreciation + 0.0% rent growth), your $30k cash investment doubles in ~4 years — after that, you're playing with house money.
Negotiation context
- It's been on market 189 days — a 12% lower offer ($94k) is reasonable based on typical stale-listing flexibility.
- 5 sale attempts since 3y ago with the ask held roughly flat each time — persistent listings suggest the price (not the market) is what's stuck; bring a comps-based counter.
Risks & watch-outs
- Watch-outs: built in 1955 — expect roof / HVAC / electrical / plumbing capex.
- Climate carrying-cost: severe wind risk, 99% chance of damaging wind over 30y; extreme-heat days projected 7→17/yr by 2055 (HVAC capex compounding) — expect insurance premiums to compound above CPI over the hold.
Questions for the listing agent
- It's been on market 189 days. Have you received any prior offers? Is the seller open to a 12% concession, seller financing, or rate buy-down credit?
- Built in 1955 — when were the roof, HVAC, electrical panel, plumbing, and water heater last replaced?
- Why hasn't it sold? Are there any deal-killer items the seller is aware of (foundation, flood, title, zoning, code violations)?
- Is there a deadline driving the sale (1031 exchange, divorce, estate, relocation)? That informs how much negotiation room exists.
- Schools are F-rated, which usually means shorter tenancies and higher turnover. Who's the typical renter profile here, and what's been the actual vacancy rate?
- What's the average days-on-market for RENTAL listings here right now (not sales)? A rising rental-DOM trend means longer vacancies and softer asking-rent achievability than the comps imply.
- What's the recent tenant-quality profile in this submarket — average credit score on applications, eviction rate, late-payment / NSF rate, and stable-employment percentage? A property-management company in the area should have these aggregated.
- How much new for-sale + rental construction is in the pipeline within 1–3 miles? Heavy new supply typically softens prices + rents 12–24 months out; constrained supply supports both.
Investment metrics
- 1% rule
- 1.88% ✓
- Cap rate
- 15.74%
- Cash-on-cash
- 33.76%
- DSCR
- 2.50
- GRM
- 4.4
CMA / ARV
- ARV (median comp)
- $205,398
- List price
- $106,500
- Delta
- -48.15%
- Verdict
- UNDERPRICED
- Comps
- 20 within 1.0 mi
Show comp detail 12 sales within ~0.75 mi
| Address | Dist | Beds/Ba | Sqft | Sold | Price | $/sf | Match |
|---|---|---|---|---|---|---|---|
| 111 Gordon St | 0.05mi | 3/2.0 | 1,154 (+1%) | 7mo | $227,000 | $197 | 89 |
| 115 Aberfeldy St | 0.33mi | 3/1.0 | 1,161 (+2%) | 7mo | $132,000 | $114 | 71 |
| 208 Turnberry St | 0.44mi | 3/1.0 | 1,100 (-3%) | 1mo | $172,000 | $156 | 70 |
| 404 Bonnybridge Rd | 0.55mi | 3/1.0 | 1,110 (-2%) | 1mo | $200,000 | $180 | 65 |
| 55 Warren Dr | 0.52mi | 3/1.0 | 1,232 (+8%) | 6mo | $225,000 | $183 | 53 |
| 109 Appleby Rd | 0.68mi | 3/2.0 | 1,207 (+6%) | 8mo | $229,000 | $190 | 52 |
| 21 Coleraine Dr | 0.65mi | 3/1.5 | 1,218 (+7%) | 7mo | $253,000 | $208 | 50 |
| 49 Warren Dr | 0.48mi | 3/1.0 | 1,264 (+11%) | 9mo | $220,000 | $174 | 48 |
| 110 Appleby Rd | 0.72mi | 3/2.0 | 1,240 (+9%) | 9mo | $238,000 | $192 | 44 |
| 11 Horne Pl | 0.66mi | 3/2.0 | 1,305 (+15%) | 2mo | $290,000 | $222 | 44 |
| 416 Pinehurst Pl | 0.69mi | 2/1.0 (-1) | 1,238 (+9%) | 4mo | $126,500 | $102 | 41 |
| 204 Antrim St | 0.73mi | 2/1.0 (-1) | 1,226 (+8%) | 7mo | $126,000 | $103 | 38 |
Match score weights: distance 35% · size 25% · config 20% · recency 20%. Top-matched comps best support the ARV.
Projected returns pro-forma
-1.89% appreciation · 0.0% rent growth · sell at horizon
- IRR
- 27.9%
- Equity multiple
- 2.19×
- Total profit
- $35,370
- Equity at exit
- $21,240
- IRR
- 32.1%
- Equity multiple
- 3.74×
- Total profit
- $81,567
- Equity at exit
- $18,685
Cash invested: $29,820 (down + closing). Projections, not guarantees.
Landlord ↔ Tenant lean methodology
- Overall (STATE)
- 90 Strongly Landlord-Friendly
- State Georgia
- 90 Strongly Landlord-Friendly · R+3
- County
- — inherits STATE
- City
- — inherits STATE
ZIP-level market 31407
- Home prices YoY
- -0.7%
- Rents YoY
- -3.5%
- Active inventory
- 379
- Price-to-rent
- 4.4×
Monthly cashflow live
- Estimated rent
- $2,003 medium interval (Pro) →
- Mortgage (P&I)
- −$558
- Tax from tax record
- −$141 /mo · $1,690/yr
- Insurance
- −$44
- HOA
- −$0
- Vacancy / Maint / Mgmt
- −$421
- Net cashflow
- $839
Break-even live
UW: 25.0% down · 7.5% · 30yr · 1.5% tax · 5.0% vac · 8.0% maint · 8.0% mgmt
Financing live
Cash to close
- Down payment
- $26,625
- Closing costs
- $3,195
- Reserves months
- —
- Total cash needed
- —
Loan-product check · same deal, 3 products live
Conventional
25% down · 7.5% · 30yr
- Down + closing
- —
- Monthly P&I
- —
- Monthly cashflow
- —
- DSCR
- —
- Eligible?
- —
Personal DTI + credit; lowest rate.
DSCR
20% down · 8.5% · 30yr
- Down + closing
- —
- Monthly P&I
- —
- Monthly cashflow
- —
- DSCR
- —
- Eligible?
- —
No personal income docs; deal must DSCR.
Hard money
10% down · 12.0% · 12mo
- Down + closing
- —
- Monthly P&I
- —
- Monthly cashflow
- —
- DSCR
- —
- Eligible?
- —
Short-term bridge; refi at stabilization.
Rent comps 1 comps
| Address | Beds | Baths | Sqft | Rent | $/sqft | DOM | Units | Dist |
|---|---|---|---|---|---|---|---|---|
| 416 Pinehurst Pl Port Wentworth, GA | 2.0 | 1.0 | 1238 | $1,800 | $1.45 | 43d | 1 | 0.67mi |
Listing history 24 events
-
2026-06-18days on market $106,500 Active 189 DOM
-
2026-06-17days on market $106,500 Active 188 DOM
-
2026-06-16days on market $106,500 Active 187 DOM
-
2026-06-15days on market $106,500 Active 186 DOM
-
2026-06-14days on market $106,500 Active 184 DOM
-
2026-06-13days on market $106,500 Active 183 DOM
-
2026-06-10days on market $106,500 Active 181 DOM
-
2026-06-09days on market $106,500 Active 180 DOM
-
2026-06-08days on market $106,500 Active 179 DOM
-
2026-06-07days on market $106,500 Active 178 DOM
-
2026-06-05days on market $106,500 Active 175 DOM
-
2026-06-03days on market $106,500 Active 174 DOM
-
2026-06-02days on market $106,500 Active 173 DOM
-
2026-06-01days on market $106,500 Active 172 DOM
-
2026-05-31days on market $106,500 Active 171 DOM
-
2026-05-30days on market $106,500 Active 170 DOM
-
2025-10-10$106,500 New 609-char remark
Show marketing remark (610 chars)
Calling all Investors, Builders and Renovators to transform this diamond in a rough into a prized jewel. This home is currently 1138 sqft 3 bed 2 bath yet has potential for more by adding on or tear down to rebuild a bigger and better home to accommodate a larger family. This property is situated on . 20 ac lot with street and off street parking. This property is in walking distance to public transportation, parks, recreation center and Port City GA. Enjoy the short commute to Downtown Port Wentworth. Dont wait to take advantage of this grand opportunity for a grand investment. Place your offer today!!!
-
2025-10-10$106,500 Active 610-char remark
Show marketing remark (610 chars)
Calling all Investors, Builders and Renovators to transform this diamond in a rough into a prized jewel. This home is currently 1138 sqft 3 bed 2 bath yet has potential for more by adding on or tear down to rebuild a bigger and better home to accommodate a larger family. This property is situated on . 20 ac lot with street and off street parking. This property is in walking distance to public transportation, parks, recreation center and Port City GA. Enjoy the short commute to Downtown Port Wentworth. Dont wait to take advantage of this grand opportunity for a grand investment. Place your offer today!!!
-
2025-03-12historical
-
2024-10-07$106,500
-
2024-04-15historical
-
2024-04-15historical
-
2023-05-28$95,000
-
2023-05-28$95,000
ⓘ Source: listings_history table (triggers on properties + properties_extension) + one-shot
backfill from property_details.listing_events for pre-trigger history.
Tax reassessment forecast GA · Resets to sale price
- Current annual tax
- $1,690 · $141/mo
- Projected year-2 tax
- $1,690 · $141/mo
- Expected delta
- $0/yr ($0/mo · -0.0%)
ⓘ Screening estimate from a state-policy table — verify with the county assessor before closing.
Climate risk First Street
- Flood 1/10 Low FEMA zone X (unshaded) · 0% chance over 30 yrs
- Wildfire 2/10 Low
- Heat 9/10 Extreme 7 d/yr ≥109°F today · 17 d/yr by 30 yrs out
- Wind 8/10 Severe 99% chance of damaging wind over 30 yrs
- Air quality 5/10 Major 7 unhealthy d/yr today · 8 by 30 yrs out
Nearby sold comps map
Loading sold comps map…
Walkable amenities ~0.75 mi
Loading nearby amenities…
Taxation est. · year 1
- Rental income
- $24,038
- − Mortgage interest
- −$5,966
- − Property taxes
- −$1,690
- − Insurance
- −$532
- − Repairs & maintenance
- −$1,923
- − Management
- −$1,923
- − Depreciation
- −$3,098
- Taxable income
- $8,906
- Est. tax owed @ 24.0%
- −$2,137
- After-tax cash flow
- $7,928/yr
For passive investors: Depreciation is non-cash, so a rental often shows a tax loss while cash-flowing — sheltering income. Rental losses are passive: they offset passive income freely, and up to $25,000/yr can offset ordinary (W-2) income if you actively participate and your MAGI is under $100k (phasing out to $0 by $150k); unused losses carry forward. On sale, claimed depreciation is recaptured at up to 25%, and gains may owe capital-gains tax (a 1031 exchange can defer both). Figures are a year-1 estimate at your 24.0% rate — not tax advice; consult a CPA.
Schools (NCES district)
- District
- Savannah-Chatham County
- NCES district ID
- 1301020
- Math proficiency
- 20% ▼ -11.00%
- Reading proficiency
- 26% ▼ -5.00%
- Median HH income
- $47,443
- Composite
- 20.14/100
- National rank
- #8639
- State rank
- #134 of 174 in GA
Livability — Port Wentworth
- Score
- 67/100
- State rank
- #173
- US rank
- #10910
Category grades
Schools grade is shown separately in the Schools card above.
Census & demographics
- Census place
- Port Wentworth, GA
- County
- Chatham County · 271,602 people
- City population
- 24,893
- Metro
- Savannah, GA
- Population (ZIP)
- 24,893
- Household income
- $81,124
- Rent vs Own
- Severe rent burden
- 1341.0
Population outlook (Chatham County) Hauer SSP2
- Today (2025)
- 332,584 people
- By 2030
- 355,508 · +6.9%
- By 2040
- 400,030 · +20.3%
- By 2050
- 443,019 · +33.2%
- By 2075
- 534,579 · +60.7%
- By 2100
- 583,863 · +75.6%
Race, ethnicity, and origin ACS 2023
- Neighborhood character
- Diverse neighborhood (Simpson 0.65)
- Race & ethnicity
- Black 43% White 38% Hispanic / Latino 13% Two or more races 6% Asian 2%
- Hispanic origin (detail)
- Mexican 5% Puerto Rican 3%
- Common ancestry
- Serbian 1% Romanian 1% Italian 1%
- Foreign-born
- 8% · Canada, Vietnam
- Languages at home
- 86% English-only · Spanish 11% Vietnamese 1% Other Asian/Pacific 1%
Political lean MEDSL · Chatham
- 2024 margin
- D (+18.0) · D 58.6% · R 40.6%
- 2008→2024 swing
- +3.6pp toward D · 2008: 14.4pp · 2024: 18.0pp
- All cycles
- 2024: D+18.0 2020: D+18.8 2016: D+14.5 2012: D+12.0 2008: D+14.4
Not yet ingested
- Civics
- —
Market trends
- HPI YoY
- ▼ -1.89%
- Current HPI
- 270.3529
- Rent YoY
- ▼ -3.47%
- Metro
- Savannah, GA
- State GDP YoY
- ▲ 2.66%
- F500 in state
- 28
Industry mix (Fortune 500 HQ in GA)
| Industry | F500 HQs | Revenue |
|---|---|---|
| Paper / Packaging | 2 | $29B |
|
||
| Retail | 1 | $160B |
|
||
| Transportation / Logistics | 1 | $91B |
|
||
| Airlines | 1 | $62B |
|
||
| Consumer Goods | 1 | $47B |
|
||
| Utilities | 1 | $25B |
|
||
Price history
+12.1% since first listed8 events — show timeline
- 2025-10-10 Listed $106,500 Hive MLS
- 2025-10-10 Listed $106,500 GAMLS
- 2025-03-12 Listing Removed — Hive MLS
- 2024-10-07 Listed $106,500 Hive MLS
- 2024-04-15 Listing Removed — Hive MLS
- 2024-04-15 Listing Removed — Hive MLS
- 2023-05-28 Listed $95,000 Hive MLS
- 2023-05-28 Listed $95,000 Hive MLS
Property tax history
+10.6%/yrLatest (2025): $1,690 · +26.0% YoY. Source: county tax records.
Cash-flow waterfall
monthlySold comps — $/sqft
last 12 mo · ≤1 miLoading sold comps…