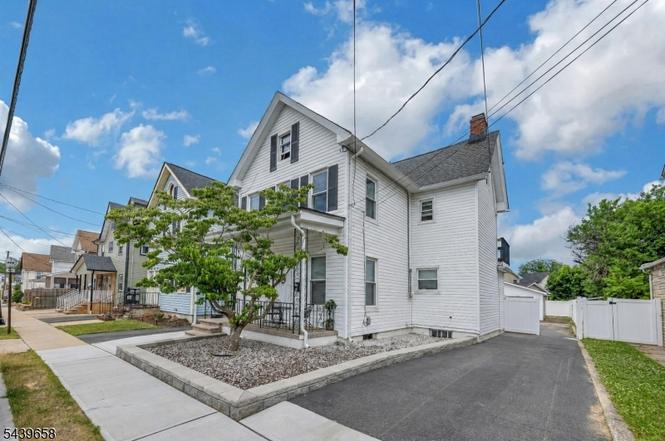
27 Thomas St · South River, NJ
Flood risk 4/10 · Minor
- FEMA flood zone
- X (unshaded)
- Chance of flooding over 30 yrs
- 0.23%
- Est. flood insurance / yr
- $507 – $1,088
Fire risk 3/10 · Minor
- Est. fire insurance / yr
- $526 – $976
Heat risk 7/10 · Major
- Hot days now (above 100°F)
- 7 days/yr
- Hot days in 30 yrs
- 15 days/yr
Wind risk 6/10 · Moderate
- Chance of severe wind over 30 yrs
- 27.0%
Air-quality risk 3/10 · Minor
- Unhealthy air days now
- 3 days/yr
- Unhealthy air days in 30 yrs
- 5 days/yr
Risk factors via First Street. Map © Google.
Why this score? — see what drove the F grade
The composite is a weighted blend of 9 inputs, each scored 0–100. Each bar is that input's sub-score; the figure is the points it added to the 100-point composite (weight × sub-score).
- Cash flow +5.3/30.0
- Livability +4.1/5.0
- Rent growth +2.5/5.0
- Condition / age +2.5/5.0
- Schools +2.2/10.0
- ARV discount +1.1/15.0
- 1% rule +0.5/10.0
- DSCR +0.0/10.0
- Appreciation +0.0/10.0
$599,999
🖨 Deal sheet (PDF) 📄 Offer letter ✓ Due diligence
Listing remarks MLS
Owner occupied 2 family..immaculate interior..replaced windows,,sided exterior..plenty of off street parking..Bonus feature of 1160 sq.ft.(approximate) separate building ready to be finished..close proximity to town and shopping..
Key facts
- Finished attic
- Private balcony
- Two family home
Tags
Property features AI
Finance
- Other: Expenses include: see remarks
- Financial info: Property is a 2-unit multi-family; Unit 2 has rent and security deposit listed (rent: $2,000; security deposit: $2,000); Net operating income, gross income, and operating expenses listed as 0 (see remarks)
Exterior
- Parking: Total 10 parking spaces; Detached finished oversize garage (2-car spaces); 1-car-width driveway with blacktop, exclusive driveway; On-street parking available; Fencing around parking area
- Utilities: All utilities underground; Natural gas available; Public water; Public sewer
- Home design: Two-story unit style; White exterior color; Approximate year built
- Construction: Vinyl siding construction; Roof: see remarks; Foundation includes crawl space; partial, unfinished basement
- Exterior features: Privacy fence; Vinyl siding; See remarks for additional exterior details
Interior
- Kitchen: Unit 1: Microwave, Refrigerator, Eat-in kitchen; Unit 2: Microwave, Range/Oven - Gas, Refrigerator, Eat-in kitchen
- Bedrooms: Unit 1: 1 bedroom (single-level); Unit 2: 1 bedroom (two-level)
- Bathrooms: Two full bathrooms total (one in each unit)
- Heating & cooling: Two heating units with baseboard hot water; Natural gas heating; Window air conditioning units
- Interior features: Fire extinguisher; Smoke detector; Carbon monoxide detector; Ceiling fan(s)
- Laundry & utility: Unit 1: Stackable washer/dryer; Unit 2: Laundry area (listed in room descriptions); Water heater (see remarks)
Neighborhood map
What this means for you Summary
Snapshot
- This is a 4-bed/4.0-bath single-family listed at $600k.
Deal economics
- At list price, monthly cash flow is $-1k ($-16k/yr) — negative.
- To cash-flow at today's rent, offer at most $364k (39.4% below list).
- To meet the 1% rule (rent ≥ 1% of price), the offer needs to be $330k (45.0% below list).
- Recommended offer: $330k (45.0% below list) — sets the bar for 1% rule.
Location & tenants
- Location reads 82/100 on livability (#43 in NJ, #1,117 nationally) — a professional / high-income tenant draw. Strengths: crime A+, commute A+, employment A+; Watch: amenities D, cost of living F.
- South River Public School District (suburban): math 12% / reading 35% proficiency, ranked #391 of 472 in NJ (top 83%) — low school quality limits family demand, transient renter base, plan for 1-2y turnover.
- Zoned schools: South River Elementary School (math 5% / reading 28%, grade F, #1,094 of 1,303 statewide, top 85%, 659 students, 57% FRL); South River Middle School (math 13% / reading 35%, grade F, #370 of 431 statewide, top 86%, 530 students, 60% FRL); South River High School (math 22% / reading 47%, grade F, #239 of 399 statewide, top 61%, 762 students, 53% FRL) — zoned schools average 57% FRL vs 33% district-wide (24 pts higher); higher-poverty schools than district average — tighter screening recommended.
- Market conditions: 38 active listings in the ZIP; 9 comparable units currently listed for rent nearby; rentals leasing fast (median 5d on market — plan ~1-2 weeks tenant-placement turnaround); 1,971 units permitted in Middlesex County in 2024 (1,193 in 5+ unit buildings).
Forward outlook
- Local home prices are declining (-3.0%/yr); year-one equity from $4k of loan paydown is wiped out by about $18k of value loss. Plan a longer hold.
- Middlesex County population projected at +15% by 2050 — long-run rental-demand tailwind backs the buy-and-hold thesis.
Negotiation context
- Only 6 days on market — expect competitive offers; lowballing is unlikely to land.
- 3 sale attempts since 11y ago with the ask held roughly flat each time — persistent listings suggest the price (not the market) is what's stuck; bring a comps-based counter.
- Current owner paid $214k; list at $600k implies a 180% gain — meaningful room to come down on a strong offer.
Risks & watch-outs
- Watch-outs: built in 1910 — expect roof / HVAC / electrical / plumbing capex.
- Climate carrying-cost: major wind risk, 27% chance of damaging wind over 30y; extreme-heat days projected 7→15/yr by 2055 (HVAC capex compounding) — expect insurance premiums to compound above CPI over the hold.
Questions for the listing agent
- What do current leases actually rent for vs. the listed asking? Can we see a recent rent roll and the last 12 months of T-12 income?
- Built in 1910 — when were the roof, HVAC, electrical panel, plumbing, and water heater last replaced?
- Is there a deadline driving the sale (1031 exchange, divorce, estate, relocation)? That informs how much negotiation room exists.
- Schools are D-rated, which usually means shorter tenancies and higher turnover. Who's the typical renter profile here, and what's been the actual vacancy rate?
- The area grade is low — what's the realistic commute time and amenity access for the typical tenant pool here? Any planned neighborhood developments (good or bad) we should know about?
- What's the average days-on-market for RENTAL listings here right now (not sales)? A rising rental-DOM trend means longer vacancies and softer asking-rent achievability than the comps imply.
- What's the recent tenant-quality profile in this submarket — average credit score on applications, eviction rate, late-payment / NSF rate, and stable-employment percentage? A property-management company in the area should have these aggregated.
- How much new for-sale + rental construction is in the pipeline within 1–3 miles? Heavy new supply typically softens prices + rents 12–24 months out; constrained supply supports both.
Investment metrics
- 1% rule
- 0.55% ✗
- Cap rate
- 3.62%
- Cash-on-cash
- -9.56%
- DSCR
- 0.57
- GRM
- 15.1
CMA / ARV
- ARV (on-the-fly)
- $524,875
- Comps found
- 12
Show comp detail 12 sales within ~0.75 mi
| Address | Dist | Beds/Ba | Sqft | Sold | Price | $/sf | Match |
|---|---|---|---|---|---|---|---|
| 2 John St | 0.27mi | 4/2.0 | 1,616 (+0%) | 0mo | $525,000 | $325 | 79 |
| 30 Leland Ave | 0.09mi | 4/1.5 | 1,560 (-3%) | 8mo | $535,000 | $343 | 73 |
| 141 E Prospect St | 0.25mi | 4/1.5 | 1,712 (+6%) | 1mo | $535,000 | $313 | 67 |
| 21 George St | 0.07mi | 3/2.0 (-1) | 1,407 (-13%) | 4mo | $405,000 | $288 | 58 |
| 67 Washington St | 0.23mi | 3/2.0 (-1) | 1,450 (-10%) | 3mo | $485,000 | $334 | 56 |
| 15 Leland Ave | 0.06mi | 4/1.0 | 1,380 (-15%) | 9mo | $445,000 | $322 | 53 |
| 12 Yates Ave | 0.65mi | 4/2.0 | 1,646 (+2%) | 6mo | $580,214 | $352 | 53 |
| 100 Jackson St | 0.33mi | 4/3.0 | 1,825 (+13%) | 8mo | $550,000 | $301 | 52 |
| 126 Prentice Ave | 0.74mi | 3/1.5 (-1) | 1,592 (-1%) | 1mo | $555,000 | $349 | 47 |
| 30 Burton Ave | 0.35mi | 3/1.0 (-1) | 1,372 (-15%) | 3mo | $375,000 | $273 | 40 |
| 30 Mageira St | 0.69mi | 3/2.0 (-1) | 1,450 (-10%) | 2mo | $350,000 | $241 | 36 |
| 77 Wilcox Ave | 0.67mi | 3/3.0 (-1) | 1,404 (-13%) | 7mo | $524,700 | $374 | 33 |
Match score weights: distance 35% · size 25% · config 20% · recency 20%. Top-matched comps best support the ARV.
Projected returns pro-forma
-3.0% appreciation · 3.0% rent growth · sell at horizon
- IRR
- -33.4%
- Equity multiple
- -0.09×
- Total profit
- $-182,527
- Equity at exit
- $89,462
- IRR
- -41.1%
- Equity multiple
- -0.60×
- Total profit
- $-268,984
- Equity at exit
- $51,877
Cash invested: $168,000 (down + closing). Projections, not guarantees.
Landlord ↔ Tenant lean methodology
- Overall (STATE)
- 21 Tenant-Leaning
- State New Jersey
- 21 Tenant-Leaning · D+6
- County
- — inherits STATE
- City
- — inherits STATE
ZIP-level market 08882
- Active inventory
- 38
- Price-to-rent
- 15.1×
Monthly cashflow live
- Estimated rent
- $3,301 high interval (Pro) →
- Mortgage (P&I)
- −$3,146
- Tax from tax record
- −$549 /mo · $6,590/yr
- Insurance
- −$250
- HOA
- −$0
- Vacancy / Maint / Mgmt
- −$693
- Net cashflow
- $-1,338
Break-even live
Sensitivity live
| Price | -10% $-999 | -5% $-1,168 | +0% $-1,338 | +5% $-1,508 | +10% $-1,678 |
|---|---|---|---|---|---|
| Rent | -10% $-1,599 | -5% $-1,469 | +0% $-1,338 | +5% $-1,208 | +10% $-1,077 |
| Rate | -1.0pp $-1,036 | -0.5pp $-1,186 | base $-1,338 | +0.5pp $-1,494 | +1.0pp $-1,652 |
UW: 25.0% down · 7.5% · 30yr · 1.5% tax · 5.0% vac · 8.0% maint · 8.0% mgmt
Financing live
Cash to close
- Down payment
- $150,000
- Closing costs
- $18,000
- Reserves months
- —
- Total cash needed
- —
Loan-product check · same deal, 3 products live
Conventional
25% down · 7.5% · 30yr
- Down + closing
- —
- Monthly P&I
- —
- Monthly cashflow
- —
- DSCR
- —
- Eligible?
- —
Personal DTI + credit; lowest rate.
DSCR
20% down · 8.5% · 30yr
- Down + closing
- —
- Monthly P&I
- —
- Monthly cashflow
- —
- DSCR
- —
- Eligible?
- —
No personal income docs; deal must DSCR.
Hard money
10% down · 12.0% · 12mo
- Down + closing
- —
- Monthly P&I
- —
- Monthly cashflow
- —
- DSCR
- —
- Eligible?
- —
Short-term bridge; refi at stabilization.
Rent comps 9 comps
| Address | Beds | Baths | Sqft | Rent | $/sqft | DOM | Units | Dist |
|---|---|---|---|---|---|---|---|---|
| 124 William St South River, NJ | 3.0 | 2.0 | 1920 | $2,600 | $1.35 | 26d | 1 | 0.38mi |
| 4 Wilcox Ave Unit B South River, NJ | 3.0 | 1.0 | 2080 | $3,000 | $1.44 | 26d | 1 | 0.42mi |
| 48 Johnson Pl South River, NJ | 3.0 | 2.0 | 1626 | $3,500 | $2.15 | 4d | 1 | 0.74mi |
| 5 Sussex Ct South River, NJ | 4.0 | 1.5 | 1695 | $3,500 | $2.06 | 22d | 1 | 0.79mi |
| 5 Sussex Ct South River, NJ | 4.0 | 1.5 | 1695 | $3,500 | $2.06 | 0d | 1 | 0.79mi |
| 29 Levinson Ave South River, NJ | 4.0 | 2.5 | 1232 | $3,100 | $2.52 | 18d | 1 | 0.87mi |
| 527 Old Bridge Tpke East Brunswick, NJ | 1.0–3.0 | 1.0–2.0 | 1131 | $4,187 | $3.70 | 0d | 41 | 0.88mi |
| 11A Foothills Dr South River, NJ | 4.0 | 2.0 | 1819 | $3,500 | $1.92 | 0d | 1 | 0.92mi |
| 1 Legacy Pl East Brunswick, NJ | 3.0 | 1.0–3.0 | 1416 | $4,095 | $2.89 | 0d | 16 | 1.14mi |
Listing history 6 events
-
2026-06-21days on market $599,999 Active 6 DOM
-
2026-06-18days on market $599,999 Active 3 DOM
-
2026-06-17days on market $599,999 Active 2 DOM
-
2026-06-15$599,999 Active 1 DOM
-
2026-06-15remarks 699-char remark
-
2026-06-15$599,999 Active 1 DOM
ⓘ Source: listings_history table (triggers on properties + properties_extension) + one-shot
backfill from property_details.listing_events for pre-trigger history.
Tax reassessment forecast NJ · Partial reset (capped growth)
- Current annual tax
- $6,590 · $549/mo
- Projected year-2 tax
- $10,765 · $897/mo
- Expected delta
- +$4,175/yr (+$348/mo · 63.4%)
ⓘ Screening estimate from a state-policy table — verify with the county assessor before closing.
Climate risk First Street
- Flood 4/10 Moderate FEMA zone X (unshaded) · 23% chance over 30 yrs
- Wildfire 3/10 Moderate
- Heat 7/10 Severe 7 d/yr ≥100°F today · 15 d/yr by 30 yrs out
- Wind 6/10 Major 27% chance of damaging wind over 30 yrs
- Air quality 3/10 Moderate 3 unhealthy d/yr today · 5 by 30 yrs out
Nearby sold comps map
Loading sold comps map…
Walkable amenities ~0.75 mi
Loading nearby amenities…
Taxation est. · year 1
- Rental income
- $39,607
- − Mortgage interest
- −$33,609
- − Property taxes
- −$6,590
- − Insurance
- −$3,000
- − Repairs & maintenance
- −$3,169
- − Management
- −$3,169
- − Depreciation
- −$17,455
- Taxable loss
- −$27,384
- Est. tax savings @ 24.0%
- +$6,572
- After-tax cash flow
- $-9,486/yr
For passive investors: Depreciation is non-cash, so a rental often shows a tax loss while cash-flowing — sheltering income. Rental losses are passive: they offset passive income freely, and up to $25,000/yr can offset ordinary (W-2) income if you actively participate and your MAGI is under $100k (phasing out to $0 by $150k); unused losses carry forward. On sale, claimed depreciation is recaptured at up to 25%, and gains may owe capital-gains tax (a 1031 exchange can defer both). Figures are a year-1 estimate at your 24.0% rate — not tax advice; consult a CPA.
Schools (NCES district)
- District
- South River Public School District
- NCES district ID
- 3415390
- Math proficiency
- 12% ▼ -20.00%
- Reading proficiency
- 35% ▼ -5.00%
- Median HH income
- $64,074
- Composite
- 22.07/100
- National rank
- #8190
- State rank
- #391 of 472 in NJ
Livability — South River
- Score
- 82/100
- State rank
- #43
- US rank
- #1117
Category grades
Schools grade is shown separately in the Schools card above.
Census & demographics
- Census place
- South River, NJ
- City population
- 16,007
- Population (ZIP)
- 16,007
Population outlook (Middlesex County) Hauer SSP2
- Today (2025)
- 901,713 people
- By 2030
- 930,661 · +3.2%
- By 2040
- 986,276 · +9.4%
- By 2050
- 1,038,920 · +15.2%
- By 2075
- 1,159,418 · +28.6%
- By 2100
- 1,221,973 · +35.5%
Race, ethnicity, and origin ACS 2023
- Neighborhood character
- Diverse neighborhood (Simpson 0.63)
- Race & ethnicity
- White 53% Hispanic / Latino 27% Black 10% Two or more races 9% Asian 4%
- Hispanic origin (detail)
- Mexican 7% Puerto Rican 5% Dominican 2%
- Common ancestry
- Romanian 9% Russian 9% Estonian 2%
- Foreign-born
- 25% · Canada, China, Jamaica
- Languages at home
- 57% English-only · Spanish 19% Other Indo-European 16% Russian/Polish/Slavic 3%
Political lean MEDSL · Middlesex
- 2024 margin
- Lean D (+8.0) · D 52.5% · R 44.5% · Other 3.0%
- 2008→2024 swing
- -13.8pp toward R · 2008: 21.8pp · 2024: 8.0pp
- All cycles
- 2024: D+8.0 2020: D+22.0 2016: D+19.8 2012: D+27.0 2008: D+21.8
Not yet ingested
- Civics
- —
Market trends
- HPI YoY
- ▼ -174.11%
- Current HPI
- 312.1881
- Rent YoY
- —
- Metro
- —
- State GDP YoY
- ▲ 2.05%
- F500 in state
- 34
Industry mix (Fortune 500 HQ in NJ)
| Industry | F500 HQs | Revenue |
|---|---|---|
| Consumer Goods | 3 | $31B |
|
||
| Pharmaceuticals | 2 | $153B |
|
||
| Technology | 2 | $21B |
|
||
| Insurance | 2 | $20B |
|
||
| Healthcare | 2 | $19B |
|
||
| Financial Services | 1 | $70B |
|
||
Price history
+118.2% since first listed11 events — show timeline
- 2026-06-14 Listed $599,999 GSMLS
- 2016-03-03 Sold (Public Records) $214,000 Public Records
- 2016-01-04 Sold (MLS) $215,000 GSMLS
- 2016-01-04 Sold (MLS) $215,000 CJMLS
- 2015-11-24 Delisted — GSMLS
- 2015-11-20 Delisted — CJMLS
- 2015-11-19 Contingent — CJMLS
- 2015-09-29 Price Changed $235,000 GSMLS
- 2015-09-29 Price Changed $235,000 CJMLS
- 2015-07-24 Listed $275,000 GSMLS
- 2015-07-24 Listed $275,000 CJMLS
Property tax history
+3.2%/yrLatest (2025): $6,590 · +4.8% YoY. Source: county tax records.
Cash-flow waterfall
monthlySold comps — $/sqft
last 12 mo · ≤1 miLoading sold comps…