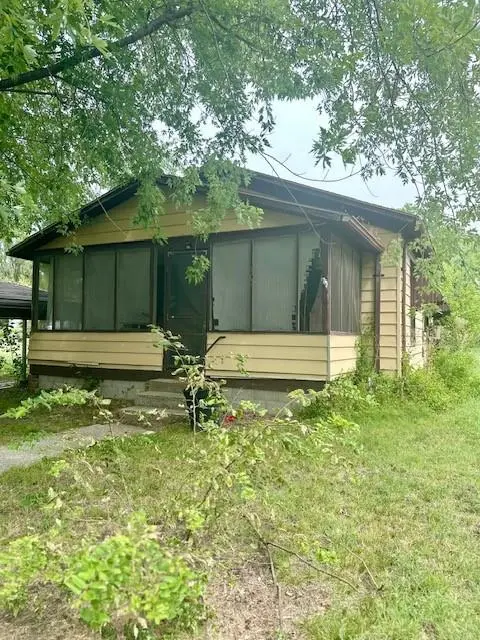
407 S State St · Caney, KS
Flood risk 1/10 · Minimal
- FEMA flood zone
- X (unshaded)
- Chance of flooding over 30 yrs
- 0.0%
- Est. flood insurance / yr
- $507 – $1,088
Fire risk 7/10 · Major
- Est. fire insurance / yr
- $1,154 – $2,142
Heat risk 6/10 · Moderate
- Hot days now (above 110°F)
- 7 days/yr
- Hot days in 30 yrs
- 18 days/yr
Wind risk 2/10 · Minimal
- Chance of severe wind over 30 yrs
- 3.0%
Air-quality risk 3/10 · Minor
- Unhealthy air days now
- 2 days/yr
- Unhealthy air days in 30 yrs
- 3 days/yr
Risk factors via First Street. Map © Google.
Why this score? — see what drove the B grade
The composite is a weighted blend of 9 inputs, each scored 0–100. Each bar is that input's sub-score; the figure is the points it added to the 100-point composite (weight × sub-score).
- Cash flow +30.0/30.0
- 1% rule +10.0/10.0
- DSCR +10.0/10.0
- ARV discount +7.5/15.0
- Appreciation +5.1/10.0
- Schools +3.7/10.0
- Livability +3.5/5.0
- Rent growth +2.5/5.0
- Condition / age +2.5/5.0
$16,990
🖨 Deal sheet 📄 Offer letter ✓ Due diligence
Key facts
- Screened in porch
- Large shed in back
- 6,969 sq ft lot
Tags
Property features AI
Finance
- Other: Lot approximately 0.16 acres (50 x 143.5); Living area reported as 888; Age listed as 101+ years; Directions provided by listing: Coming in Caney north or south on Hwy 75 turn west on 4th Street and go to State Street. Turn left and go to the address.
- HOA & community: No association fees
Exterior
- Parking: Off-street parking
- Utilities: City/public water (verify); Public sewer
- Home design: Single-family residence; Residential property; Bungalow style; Located inside city limits
- Construction: Frame construction; Other construction materials; Composition roof; Other roof materials
- Exterior features: Porch (screened); Shed(s); Paved road access; Not in flood plain
Interior
- Bedrooms: 2 bedrooms
- Flooring: Carpet
- Bathrooms: 1 full bathroom
- Heating & cooling: Wall furnace heating; Window AC unit(s)
- Interior features: Carpet flooring; Crawl space basement; Bungalow floor plan
- Laundry & utility: Dedicated laundry room
Neighborhood map
What this means for you Summary
Snapshot
- This is a 2-bed/1.0-bath single-family listed at $17k.
Deal economics
- At list price, monthly cash flow is $219 ($3k/yr) — positive.
- The deal already cash-flows at list — no discount required.
- Meets the 1% rule at list price ($450 rent vs $17k).
- Recommended offer: $16k (6.0% below list) — sets the bar for market timing.
Location & tenants
- Location reads 70/100 on livability (#161 in KS) — a middle-class / working-renter tenant base. Strengths: cost of living A+, health & safety A+, housing A-; Watch: schools D+, amenities F, commute F.
- Caney Valley (rural): math 42% / reading 46% proficiency, ranked #24 of 169 in KS (top 14%) — families likely to look elsewhere, expect single-tenant / working-renter base with shorter leases.
- Market conditions: 14 active listings in the ZIP; 1 comparable units currently listed for rent nearby; 10 units permitted in Montgomery County in 2024 (0 in 5+ unit buildings).
Forward outlook
- In year one you build about $152 of equity ($118 loan paydown + $34 appreciation (0.2% local appreciation)).
- Montgomery County population projected at -28% by 2050 — secular population decline; favor cash flow + early exit over multi-decade hold.
- At projected returns (0.2% appreciation + 3.0% rent growth), your $5k cash investment doubles in ~2 years — after that, you're playing with house money.
Negotiation context
- It's been on market 66 days — a 6% lower offer ($16k) is reasonable based on typical stale-listing flexibility.
- 4 sale attempts since 2y ago; this cycle's ask has dropped $7k (29%) from the opening price — seller is motivated, your offer sets the floor, not the list.
Risks & watch-outs
- Watch-outs: property tax is 2.8% of price; built in 1915 — expect roof / HVAC / electrical / plumbing capex.
- Climate carrying-cost: major wildfire risk; extreme-heat days projected 7→18/yr by 2055 (HVAC capex compounding) — expect insurance premiums to compound above CPI over the hold.
Questions for the listing agent
- It's been on market 66 days. Have you received any prior offers? Is the seller open to a 6% concession, seller financing, or rate buy-down credit?
- Built in 1915 — when were the roof, HVAC, electrical panel, plumbing, and water heater last replaced?
- Property tax is high relative to price — has the assessment been appealed recently, and will the sale trigger a re-assessment?
- Why hasn't it sold? Are there any deal-killer items the seller is aware of (foundation, flood, title, zoning, code violations)?
- Is there a deadline driving the sale (1031 exchange, divorce, estate, relocation)? That informs how much negotiation room exists.
- Schools are D-rated, which usually means shorter tenancies and higher turnover. Who's the typical renter profile here, and what's been the actual vacancy rate?
- What's the average days-on-market for RENTAL listings here right now (not sales)? A rising rental-DOM trend means longer vacancies and softer asking-rent achievability than the comps imply.
- What's the recent tenant-quality profile in this submarket — average credit score on applications, eviction rate, late-payment / NSF rate, and stable-employment percentage? A property-management company in the area should have these aggregated.
- How much new for-sale + rental construction is in the pipeline within 1–3 miles? Heavy new supply typically softens prices + rents 12–24 months out; constrained supply supports both.
Investment metrics
- 1% rule
- 2.65% ✓
- Cap rate
- 21.78%
- Cash-on-cash
- 55.30%
- DSCR
- 3.46
- GRM
- 3.1
CMA / ARV
- ARV (on-the-fly)
- $79,920
- Comps found
- 2
Show comp detail 2 sales within ~0.75 mi
| Address | Dist | Beds/Ba | Sqft | Sold | Price | $/sf | Match |
|---|---|---|---|---|---|---|---|
| 204 N Mcgee St | 0.63mi | 2/1.0 | 934 (+5%) | 6mo | $39,500 | $42 | 57 |
| 402 N Mcgee N/A | 0.71mi | 2/1.0 | 864 (-3%) | 8mo | $78,000 | $90 | 56 |
Match score weights: distance 35% · size 25% · config 20% · recency 20%. Top-matched comps best support the ARV.
Projected returns pro-forma
0.2% appreciation · 3.0% rent growth · sell at horizon
- IRR
- 57.2%
- Equity multiple
- 3.87×
- Total profit
- $13,644
- Equity at exit
- $5,103
- IRR
- 59.3%
- Equity multiple
- 7.80×
- Total profit
- $32,345
- Equity at exit
- $6,271
Cash invested: $4,757 (down + closing). Projections, not guarantees.
Landlord ↔ Tenant lean methodology
- Overall (STATE)
- 83 Strongly Landlord-Friendly
- State Kansas
- 83 Strongly Landlord-Friendly · R+10
- County
- — inherits STATE
- City
- — inherits STATE
ZIP-level market 67333
- Home prices YoY
- 0.1%
- Active inventory
- 14
- Price-to-rent
- 3.1×
Monthly cashflow live
- Estimated rent
- $450 medium interval (Pro) →
- Mortgage (P&I)
- −$89
- Tax from tax record
- −$40 /mo · $481/yr
- Insurance
- −$7
- HOA
- −$0
- Vacancy / Maint / Mgmt
- −$94
- Net cashflow
- $219
Break-even live
UW: 25.0% down · 7.5% · 30yr · 1.5% tax · 5.0% vac · 8.0% maint · 8.0% mgmt
Financing live
Cash to close
- Down payment
- $4,248
- Closing costs
- $510
- Reserves months
- —
- Total cash needed
- —
Loan-product check · same deal, 3 products live
Conventional
25% down · 7.5% · 30yr
- Down + closing
- —
- Monthly P&I
- —
- Monthly cashflow
- —
- DSCR
- —
- Eligible?
- —
Personal DTI + credit; lowest rate.
DSCR
20% down · 8.5% · 30yr
- Down + closing
- —
- Monthly P&I
- —
- Monthly cashflow
- —
- DSCR
- —
- Eligible?
- —
No personal income docs; deal must DSCR.
Hard money
10% down · 12.0% · 12mo
- Down + closing
- —
- Monthly P&I
- —
- Monthly cashflow
- —
- DSCR
- —
- Eligible?
- —
Short-term bridge; refi at stabilization.
Rent comps 1 comps
| Address | Beds | Baths | Sqft | Rent | $/sqft | DOM | Units | Dist |
|---|---|---|---|---|---|---|---|---|
| 804 N Wood St Unit 813 Caney, KS | 2.0 | 1.0 | 552 | $450 | $0.82 | 23d | 1 | 0.82mi |
Listing history 24 events
-
2026-06-18days on market $16,990 Active 66 DOM
-
2026-06-17days on market $16,990 Active 65 DOM
-
2026-06-16days on market $16,990 Active 64 DOM
-
2026-06-15days on market $16,990 Active 63 DOM
-
2026-06-13days on market $16,990 Active 61 DOM
-
2026-06-12days on market $16,990 Active 60 DOM
-
2026-06-09days on market $16,990 Active 57 DOM
-
2026-06-08days on market $16,990 Active 56 DOM
-
2026-06-07pricedays on market $16,990 Active 55 DOM
-
2026-06-05days on market $23,900 Active 53 DOM
-
2026-06-04days on market $23,900 Active 51 DOM
-
2026-06-02days on market $23,900 Active 50 DOM
-
2026-06-01days on market $23,900 Active 49 DOM
-
2026-05-31days on market $23,900 Active 48 DOM
-
2026-05-31days on market $23,900 Active 47 DOM
-
2026-04-13$23,900 Active
-
2025-02-28historical
-
2025-02-25status Active
-
2025-02-12status Pending
-
2024-12-06price $25,000
-
2024-12-05status Active
-
2024-11-03status Pending
-
2024-09-28price $29,000
-
2024-08-23$34,000 Active
ⓘ Source: listings_history table (triggers on properties + properties_extension) + one-shot
backfill from property_details.listing_events for pre-trigger history.
Tax reassessment forecast KS · Resets to sale price
- Current annual tax
- $481 · $40/mo
- Projected year-2 tax
- $481 · $40/mo
- Expected delta
- $0/yr ($0/mo · 0.0%)
ⓘ Screening estimate from a state-policy table — verify with the county assessor before closing.
Climate risk First Street
- Flood 1/10 Low FEMA zone X (unshaded) · 0% chance over 30 yrs
- Wildfire 7/10 Severe
- Heat 6/10 Major 7 d/yr ≥110°F today · 18 d/yr by 30 yrs out
- Wind 2/10 Low 3% chance of damaging wind over 30 yrs
- Air quality 3/10 Moderate 2 unhealthy d/yr today · 3 by 30 yrs out
Nearby sold comps map
Loading sold comps map…
Walkable amenities ~0.75 mi
Loading nearby amenities…
Taxation est. · year 1
- Rental income
- $5,400
- − Mortgage interest
- −$952
- − Property taxes
- −$481
- − Insurance
- −$85
- − Repairs & maintenance
- −$432
- − Management
- −$432
- − Depreciation
- −$494
- Taxable income
- $2,524
- Est. tax owed @ 24.0%
- −$606
- After-tax cash flow
- $2,025/yr
For passive investors: Depreciation is non-cash, so a rental often shows a tax loss while cash-flowing — sheltering income. Rental losses are passive: they offset passive income freely, and up to $25,000/yr can offset ordinary (W-2) income if you actively participate and your MAGI is under $100k (phasing out to $0 by $150k); unused losses carry forward. On sale, claimed depreciation is recaptured at up to 25%, and gains may owe capital-gains tax (a 1031 exchange can defer both). Figures are a year-1 estimate at your 24.0% rate — not tax advice; consult a CPA.
Schools (NCES district)
- District
- Caney Valley
- NCES district ID
- 2004410
- Math proficiency
- 42% ▲ 2.00%
- Reading proficiency
- 46% ▲ 6.00%
- Median HH income
- $43,168
- Composite
- 37.15/100
- National rank
- #4486
- State rank
- #24 of 169 in KS
Livability — Caney
- Score
- 70/100
- State rank
- #161
- US rank
- #7653
Category grades
Schools grade is shown separately in the Schools card above.
Census & demographics
- Census place
- Caney, KS
- Population (ZIP)
- 2,534
Population outlook (Montgomery County) Hauer SSP2
- Today (2025)
- 29,729 people
- By 2030
- 27,786 · -6.5%
- By 2040
- 24,201 · -18.6%
- By 2050
- 21,280 · -28.4%
- By 2075
- 16,754 · -43.6%
- By 2100
- 14,088 · -52.6%
Race, ethnicity, and origin ACS 2023
- Neighborhood character
- Predominantly White (85%)
- Race & ethnicity
- White 85% Two or more races 10% Hispanic / Latino 2% Native American 2%
- Common ancestry
- Iranian 2% Italian 2% Portuguese 1%
- Foreign-born
- 1% · Canada
- Languages at home
- 98% English-only · Spanish 2%
Political lean MEDSL · Montgomery
- 2024 margin
- Solid R (+51.1) · D 23.6% · R 74.7% · Other 1.8%
- 2008→2024 swing
- -15.3pp toward R · 2008: -35.8pp · 2024: -51.1pp
- All cycles
- 2024: R+51.1 2020: R+50.2 2016: R+50.8 2012: R+41.4 2008: R+35.8
Not yet ingested
- Civics
- —
Market trends
- HPI YoY
- ▲ 0.20%
- Current HPI
- 145.0094
- Rent YoY
- —
- Metro
- —
- State GDP YoY
- —
- F500 in state
- 0
Price history
-29.7% since first listed9 events — show timeline
- 2026-04-13 Listed $23,900 Heartland MLS as Distributed by MLS Grid
- 2025-02-28 Listing Removed — Heartland MLS as Distributed by MLS Grid
- 2025-02-25 Relisted — Heartland MLS as Distributed by MLS Grid
- 2025-02-12 Pending — Heartland MLS as Distributed by MLS Grid
- 2024-12-06 Price Changed $25,000 Heartland MLS as Distributed by MLS Grid
- 2024-12-05 Relisted — Heartland MLS as Distributed by MLS Grid
- 2024-11-03 Pending — Heartland MLS as Distributed by MLS Grid
- 2024-09-28 Price Changed $29,000 Heartland MLS as Distributed by MLS Grid
- 2024-08-23 Listed $34,000 Heartland MLS as Distributed by MLS Grid
Property tax history
+0.3%/yrLatest (2025): $481 · -5.8% YoY. Source: county tax records.
Cash-flow waterfall
monthlySold comps — $/sqft
last 12 mo · ≤1 miLoading sold comps…