 Fourplex
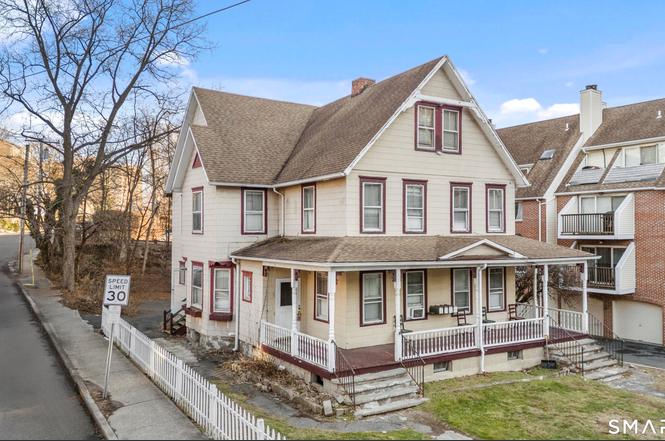
111 Grove St · Stamford, CT
Flood risk 1/10 · Minimal
- FEMA flood zone
- X (unshaded)
- Chance of flooding over 30 yrs
- 0.0%
- Est. flood insurance / yr
- $473 – $860
Fire risk 1/10 · Minimal
- Est. fire insurance / yr
- $829 – $1,539
Heat risk 6/10 · Moderate
- Hot days now (above 98°F)
- 7 days/yr
- Hot days in 30 yrs
- 16 days/yr
Wind risk 6/10 · Moderate
- Chance of severe wind over 30 yrs
- 69.0%
Air-quality risk 4/10 · Minor
- Unhealthy air days now
- 4 days/yr
- Unhealthy air days in 30 yrs
- 6 days/yr
Risk factors via First Street. Map © Google.
Why this score? — see what drove the A- grade
The composite is a weighted blend of 9 inputs, each scored 0–100. Each bar is that input's sub-score; the figure is the points it added to the 100-point composite (weight × sub-score).
- Cash flow +30.0/30.0
- ARV discount +14.3/15.0
- 1% rule +10.0/10.0
- DSCR +10.0/10.0
- Appreciation +6.3/10.0
- Schools +3.5/10.0
- Livability +3.5/5.0
- Rent growth +2.6/5.0
- Condition / age +2.5/5.0
$849,000
🖨 Deal sheet 📄 Offer letter ✓ Due diligence
Multi-family units
County records classify this as Multi-Family (5+ Unit). Listing-text estimate: 4 units. estimate disagrees with records
5+ unit building — per-unit beds/baths from public records are typically unavailable; the breakdown below (if shown) is an estimate from the listing text.
Listing remarks
Prime downtown Stamford redevelopment opportunity on a 0.21-acre lot located in an RMF zone. This 3,667 sq ft four-family building is being marketed primarily for its land value and long-term development potential, making it well-suited for builders, developers, and investors seeking to create new residential product in a high-demand urban location. The property is configured with four 1-bedroom, 1-bath units, with the fourth unit offering access to a finished attic that includes an additional full bathroom, providing flexibility in future design or redevelopment concepts. The site presents strong potential for townhouse-style or multi-unit redevelopment, subject to buyer due diligence, zon
Key facts
- Finished attic
- Four-family building
- 0.21-acre lot
Tags
Neighborhood map
What this means for you Summary
Snapshot
- This is a 4 × 4-bed/5.0-bath units multifamily listed at $849k.
Deal economics
- At list price, monthly cash flow is $7k ($84k/yr) — positive. Per door: $2k/mo.
- The deal already cash-flows at list — no discount required.
- Meets the 1% rule at list price ($16k rent vs $849k).
- Recommended offer: $836k (1.5% below list) — sets the bar for market timing.
- Cap rate 16.1% vs local median 3.0% in Stamford — top-decile yield for the area; either an underpriced asset or a hidden risk that comps aren't pricing in. Stress-test before assuming the spread holds.
Location & tenants
- Location reads 70/100 on livability (#98 in CT) — a middle-class / working-renter tenant base. Strengths: employment A+, health & safety A+, crime A-; Watch: amenities F, commute F, cost of living F.
- Stamford School District (urban): math 32% / reading 43% proficiency, ranked #103 of 153 in CT (top 67%) — families likely to look elsewhere, expect single-tenant / working-renter base with shorter leases.
- Zoned schools: Newfield School (math 28% / reading 37%, grade F, #358 of 553 statewide, top 65%, 525 students, 55% FRL); Stamford High School (math 31% / reading 56%, grade F, #98 of 194 statewide, top 51%, 2,048 students, 53% FRL).
- Market conditions: Rents flat; 23 active listings in the ZIP; 10 comparable units currently listed for rent nearby; rentals at typical pace (median 19d on market — plan ~3-4 weeks tenant-placement turnaround); solid renter incomes; 1,151 units permitted in Western Connecticut Planning Region in 2024 (714 in 5+ unit buildings).
Forward outlook
- In year one you build about $28k of equity ($6k loan paydown + $22k appreciation (2.6% local appreciation)).
- At projected returns (2.6% appreciation + 0.4% rent growth), your $238k cash investment doubles in ~3 years — after that, you're playing with house money.
- By year 3, paydown + projected appreciation supports a ~$69k cash-out refi (75% LTV) — recoverable capital for the next deal without selling this one.
Negotiation context
- It's been on market 28 days — a 2% lower offer ($836k) is reasonable based on typical stale-listing flexibility.
- 3 sale attempts since 17y ago with the ask held roughly flat each time — persistent listings suggest the price (not the market) is what's stuck; bring a comps-based counter.
- Current owner paid $410k; list at $849k implies a 107% gain — meaningful room to come down on a strong offer.
Risks & watch-outs
- Watch-outs: built in 1897 — expect roof / HVAC / electrical / plumbing capex.
- Climate carrying-cost: major wind risk, 69% chance of damaging wind over 30y; extreme-heat days projected 7→16/yr by 2055 (HVAC capex compounding) — expect insurance premiums to compound above CPI over the hold.
Questions for the listing agent
- Can we see the unit-by-unit rent roll, current vacancy, and any below-market leases? What's the average tenancy length?
- What capital expenditures (roof, boiler, parking lot, exteriors) have been made in the last 5 years, and what's planned in the next 2?
- Built in 1897 — when were the roof, HVAC, electrical panel, plumbing, and water heater last replaced?
- Is there a deadline driving the sale (1031 exchange, divorce, estate, relocation)? That informs how much negotiation room exists.
- Schools are B-rated — typically a magnet for longer-tenancy family renters. What's the average tenant stay here, and is there a school-zone premium baked into asking?
- What's the average days-on-market for RENTAL listings here right now (not sales)? A rising rental-DOM trend means longer vacancies and softer asking-rent achievability than the comps imply.
- What's the recent tenant-quality profile in this submarket — average credit score on applications, eviction rate, late-payment / NSF rate, and stable-employment percentage? A property-management company in the area should have these aggregated.
- How much new apartment / multifamily construction is in the pipeline within 1–3 miles? Heavy new supply (>2% of stock underway) typically softens rents 12–24 months out; light construction supports rent growth.
Investment metrics
- 1% rule
- 1.86% ✓
- Cap rate
- 16.14%
- Cash-on-cash
- 35.16%
- DSCR
- 2.56
- GRM
- 4.5
CMA / ARV
- ARV (on-the-fly)
- $1,001,091
- Comps found
- 3
Show comp detail 3 sales within ~0.75 mi
| Address | Dist | Beds/Ba | Sqft | Sold | Price | $/sf | Match |
|---|---|---|---|---|---|---|---|
| 111 Grove St | 0.00mi | 4/5.0 | 3,667 (0%) | 0mo | $920,000 | $251 | 96 |
| 147 Grove St | 0.08mi | 5/3.5 (+1) | 3,668 (0%) | 13mo | $1,000,000 | $273 | 78 |
| 31 Coolidge Ave | 0.72mi | 4/3.0 | 3,139 (-14%) | 22mo | $860,000 | $274 | 20 |
Match score weights: distance 35% · size 25% · config 20% · recency 20%. Top-matched comps best support the ARV.
Projected returns pro-forma
2.56% appreciation · 0.37% rent growth · sell at horizon
- IRR
- 37.9%
- Equity multiple
- 3.04×
- Total profit
- $485,622
- Equity at exit
- $360,908
- IRR
- 37.0%
- Equity multiple
- 5.56×
- Total profit
- $1,082,897
- Equity at exit
- $540,514
Cash invested: $237,720 (down + closing). Projections, not guarantees.
Landlord ↔ Tenant lean methodology
- Overall (STATE)
- 27 Tenant-Leaning
- State Connecticut
- 27 Tenant-Leaning · D+7
- County
- — inherits STATE
- City
- — inherits STATE
ZIP-level market 06901
- Home prices YoY
- 2.0%
- Rents YoY
- 0.4%
- Active inventory
- 23
- Price-to-rent
- 17.9×
Monthly cashflow live
- Estimated rent
- $15,804 high interval (Pro) →
- Mortgage (P&I)
- −$4,452
- Tax from tax record
- −$713 /mo · $8,559/yr
- Insurance
- −$354
- HOA
- −$0
- Vacancy / Maint / Mgmt
- −$3,319
- Net cashflow
- $6,966
Break-even live
4-unit breakdown (identical units grouped — click to expand)
| Units | Beds | Baths | Est. rent |
|---|---|---|---|
| 4× units | 4 | 5 | $15,804 |
| #1 | 4 | 5 | $3,951 |
| #2 | 4 | 5 | $3,951 |
| #3 | 4 | 5 | $3,951 |
| #4 | 4 | 5 | $3,951 |
| Total (4 units) | $15,804 | ||
UW: 25.0% down · 7.5% · 30yr · 1.5% tax · 5.0% vac · 8.0% maint · 8.0% mgmt
Financing live
Cash to close
- Down payment
- $212,250
- Closing costs
- $25,470
- Reserves months
- —
- Total cash needed
- —
Loan-product check · same deal, 3 products live
Conventional
25% down · 7.5% · 30yr
- Down + closing
- —
- Monthly P&I
- —
- Monthly cashflow
- —
- DSCR
- —
- Eligible?
- —
Personal DTI + credit; lowest rate.
DSCR
20% down · 8.5% · 30yr
- Down + closing
- —
- Monthly P&I
- —
- Monthly cashflow
- —
- DSCR
- —
- Eligible?
- —
No personal income docs; deal must DSCR.
Hard money
10% down · 12.0% · 12mo
- Down + closing
- —
- Monthly P&I
- —
- Monthly cashflow
- —
- DSCR
- —
- Eligible?
- —
Short-term bridge; refi at stabilization.
Rent comps 10 comps
| Address | Beds | Baths | Sqft | Rent | $/sqft | DOM | Units | Dist |
|---|---|---|---|---|---|---|---|---|
| 70 Forest St Stamford, CT | 3.0 | 3.5 | 3265 | $12,500 | $3.83 | 2d | 4 | 0.10mi |
| 100 Hope St #5 Stamford, CT | 3.0 | 3.0 | 2608 | $4,500 | $1.73 | 23d | 1 | 0.57mi |
| 59 Rock Spring Rd #28 Stamford, CT | 3.0 | 2.5 | 2783 | $3,800 | $1.37 | 19d | 1 | 0.60mi |
| 112 4th St Stamford, CT | 4.0 | 4.0 | 2998 | $5,550 | $1.85 | 14d | 1 | 0.66mi |
| 237 Strawberry Hill Ave #42 Stamford, CT | 3.0 | 3.5 | 2870 | $4,300 | $1.50 | 14d | 1 | 0.72mi |
| 10 Elmwood St Stamford, CT | 3.0 | 2.0 | 3350 | $4,250 | $1.27 | 19d | 1 | 1.32mi |
| 12 Westwood Dr Stamford, CT | 4.0 | 2.5 | 2734 | $6,500 | $2.38 | 23d | 1 | 1.38mi |
| 1093 Shippan Ave Stamford, CT | 4.0 | 2.0 | 2500 | $5,950 | $2.38 | 43d | 1 | 1.46mi |
| 82 Rippowam Rd Stamford, CT | 3.0 | 2.5 | 2555 | $6,999 | $2.74 | 3d | 1 | 1.47mi |
| 88 Maple Tree Ave Unit E Stamford, CT | 3.0 | 2.5 | 3505 | $5,600 | $1.60 | 43d | 1 | 1.48mi |
Listing history 7 events
-
2026-02-26status Under Contract
-
2026-01-29$849,000 Active
-
2014-07-18soldstatus $410,000
-
2009-06-26historical
-
2009-05-15$1,100,000
-
2009-03-12historical
-
2009-01-12$1,425,000
ⓘ Source: listings_history table (triggers on properties + properties_extension) + one-shot
backfill from property_details.listing_events for pre-trigger history.
Tax reassessment forecast CT · Partial reset (capped growth)
- Current annual tax
- $8,559 · $713/mo
- Projected year-2 tax
- $13,364 · $1,114/mo
- Expected delta
- +$4,805/yr (+$400/mo · 56.1%)
ⓘ Screening estimate from a state-policy table — verify with the county assessor before closing.
Climate risk First Street
- Flood 1/10 Low FEMA zone X (unshaded) · 0% chance over 30 yrs
- Wildfire 1/10 Low
- Heat 6/10 Major 7 d/yr ≥98°F today · 16 d/yr by 30 yrs out
- Wind 6/10 Major 69% chance of damaging wind over 30 yrs
- Air quality 4/10 Moderate 4 unhealthy d/yr today · 6 by 30 yrs out
Nearby sold comps map
Loading sold comps map…
Walkable amenities ~0.75 mi
Loading nearby amenities…
Taxation est. · year 1
- Rental income
- $189,648
- − Mortgage interest
- −$47,557
- − Property taxes
- −$8,559
- − Insurance
- −$4,245
- − Repairs & maintenance
- −$15,172
- − Management
- −$15,172
- − Depreciation
- −$24,698
- Taxable income
- $74,245
- Est. tax owed @ 24.0%
- −$17,819
- After-tax cash flow
- $65,772/yr
For passive investors: Depreciation is non-cash, so a rental often shows a tax loss while cash-flowing — sheltering income. Rental losses are passive: they offset passive income freely, and up to $25,000/yr can offset ordinary (W-2) income if you actively participate and your MAGI is under $100k (phasing out to $0 by $150k); unused losses carry forward. On sale, claimed depreciation is recaptured at up to 25%, and gains may owe capital-gains tax (a 1031 exchange can defer both). Figures are a year-1 estimate at your 24.0% rate — not tax advice; consult a CPA.
Schools (NCES district)
- District
- Stamford School District
- NCES district ID
- 0904320
- Math proficiency
- 32% ▼ -10.00%
- Reading proficiency
- 43% ▼ -7.00%
- Median HH income
- $78,843
- Composite
- 35.14/100
- National rank
- #5010
- State rank
- #103 of 153 in CT
Livability — Stamford
- Score
- 70/100
- State rank
- #98
- US rank
- #7716
Category grades
Schools grade is shown separately in the Schools card above.
Census & demographics
- Census place
- Stamford, CT
- County
- Fairfield County · 765,532 people
- City population
- 123,058
- Metro
- Bridgeport-Stamford-Norwalk, CT
- Population (ZIP)
- 11,037
- Household income
- $102,641
- Rent vs Own
- Severe rent burden
- 1139.0
Population outlook (Western Connecticut County) Hauer SSP2
- By 2040
- 685,031
Race, ethnicity, and origin ACS 2023
- Neighborhood character
- Highly diverse neighborhood (Simpson 0.72)
- Race & ethnicity
- White 41% Black 23% Hispanic / Latino 18% Asian 15% Two or more races 7% Native American 2%
- Hispanic origin (detail)
- Puerto Rican 7% Dominican 1%
- Common ancestry
- Hispanic 6% Romanian 3% Lithuanian 2%
- Foreign-born
- 30% · Canada, China, South Korea
- Languages at home
- 64% English-only · Spanish 13% French/Haitian/Cajun 6% Other Indo-European 5%
Political lean MEDSL · Western Connecticut
- 2024 margin
- D (+19.1) · D 58.8% · R 39.7% · Other 1.6%
- All cycles
- 2024: D+19.1
Not yet ingested
- Civics
- —
Market trends
- HPI YoY
- ▲ 2.56%
- Current HPI
- 132.891
- Rent YoY
- ▲ 0.37%
- Metro
- Bridgeport-Stamford-Norwalk, CT
- State GDP YoY
- ▲ 1.06%
- F500 in state
- 38
Industry mix (Fortune 500 HQ in CT)
| Industry | F500 HQs | Revenue |
|---|---|---|
| Industrial Machinery | 4 | $38B |
|
||
| Insurance | 3 | $71B |
|
||
| Financial Services | 2 | $25B |
|
||
| Transportation / Logistics | 2 | $18B |
|
||
| Healthcare | 1 | $247B |
|
||
| Telecommunications | 1 | $55B |
|
||
Price history
-40.4% since first listed7 events — show timeline
- 2026-02-26 Pending — Smart MLS
- 2026-01-29 Listed $849,000 Smart MLS
- 2014-07-18 Sold (Public Records) $410,000 Public Records
- 2009-06-26 Listing Removed — Smart MLS
- 2009-05-15 Listed $1,100,000 Smart MLS
- 2009-03-12 Listing Removed — Smart MLS
- 2009-01-12 Listed $1,425,000 Smart MLS
Property tax history
+4.5%/yrLatest (2022): $8,559 · +0.9% YoY. Source: county tax records.
Cash-flow waterfall
monthlySold comps — $/sqft
last 12 mo · ≤1 miLoading sold comps…