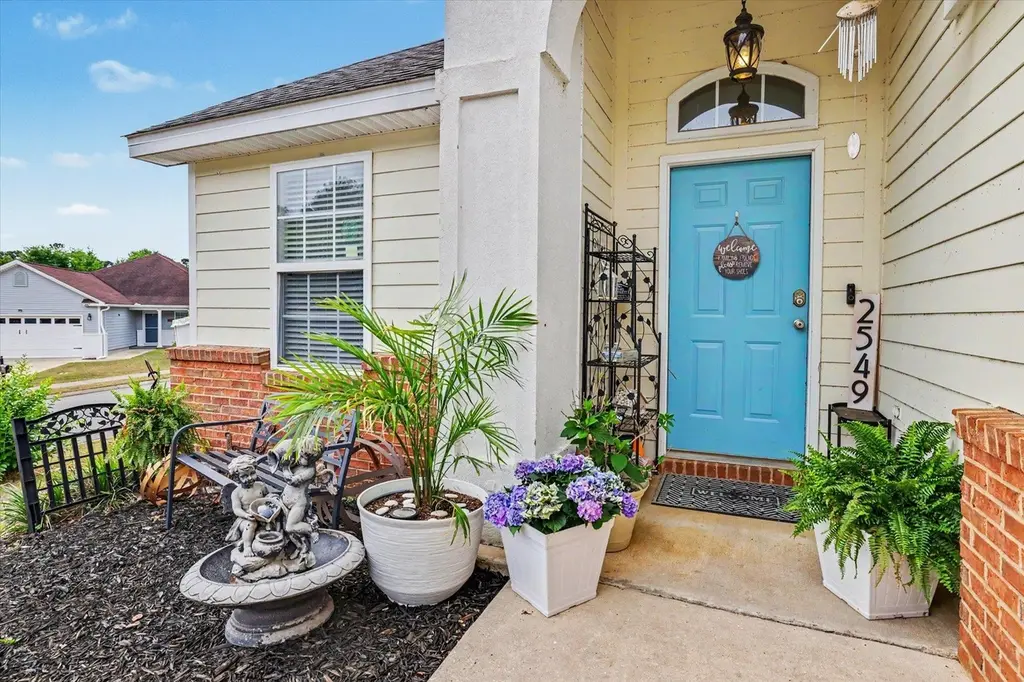
2549 Heathrow Dr · Bradfordville, FL
Flood risk 1/10 · Minimal
- FEMA flood zone
- X (unshaded)
- Chance of flooding over 30 yrs
- 0.0%
- Est. flood insurance / yr
- $507 – $1,088
Fire risk 4/10 · Minor
- Est. fire insurance / yr
- $947 – $1,759
Heat risk 8/10 · Major
- Hot days now (above 108°F)
- 7 days/yr
- Hot days in 30 yrs
- 22 days/yr
Wind risk 9/10 · Severe
- Chance of severe wind over 30 yrs
- 99.0%
Air-quality risk 4/10 · Minor
- Unhealthy air days now
- 6 days/yr
- Unhealthy air days in 30 yrs
- 6 days/yr
Risk factors via First Street. Map © Google.
Why this score? — see what drove the F grade
The composite is a weighted blend of 9 inputs, each scored 0–100. Each bar is that input's sub-score; the figure is the points it added to the 100-point composite (weight × sub-score).
- Cash flow +9.6/30.0
- ARV discount +5.8/15.0
- Schools +4.3/10.0
- Rent growth +3.0/5.0
- DSCR +2.7/10.0
- Livability +2.5/5.0
- Condition / age +2.5/5.0
- 1% rule +2.2/10.0
- Appreciation +0.0/10.0
$374,900
🖨 Deal sheet (PDF) 📄 Offer letter ✓ Due diligence
Listing remarks MLS
Incredible 4 bedroom home with fireplace in the highly desirable Glen of Golden Eagle neighborhood. This home has fantastic curb appeal on a corner lot nestled in the quiet rear portion of the subdivision. A++ school zone (Killearn Lakes, Deerlake, & Chiles). Home features a covered rear porch with a privacy fence, spacious bedrooms, large master bath with jetted tub and separate walk-in shower, vaulted and trey ceilings, laminate flooring throughout. NEW ROOF and NEW EXTERIOR PAINT in 2018. You have to see this home in person to truly appreciate it!!!! Home qualifies for the USDA Rural Development loan program. Home is being sold AS-IS with right to inspection.
Key facts
- Ample living space
- Convenient access
- Everyday amenities
Tags
Property features AI
Finance
- HOA & community: Association fee of $120 (covers common areas)
Exterior
- Parking: Attached 2-car garage
- Utilities: Central air conditioning
- Home design: Single-story; Brick and fiber cement exterior
- Construction: Built with brick and fiber cement; Single-story construction
- Exterior features: Fully fenced yard; Paved road access
Interior
- Kitchen: Dishwasher; Disposal; Microwave; Refrigerator; Stove
- Flooring: Engineered hardwood; Tile
- Bathrooms: 2 full bathrooms
- Heating & cooling: Central air; Ceiling fans
- Interior features: High ceilings; Window treatments; Garden tub / Roman tub; Split bedroom floorplan
Neighborhood map
What this means for you Summary
Snapshot
- This is a 3-bed/2.0-bath single-family listed at $375k.
Deal economics
- At list price, monthly cash flow is $-254 ($-3k/yr) — negative.
- To cash-flow at today's rent, offer at most $330k (12.0% below list).
- To meet the 1% rule (rent ≥ 1% of price), the offer needs to be $272k (27.5% below list).
- Recommended offer: $272k (27.5% below list) — sets the bar for 1% rule.
- Cap rate 5.5% vs local median 3.0% in Bradfordville — top-decile yield for the area; either an underpriced asset or a hidden risk that comps aren't pricing in. Stress-test before assuming the spread holds.
Location & tenants
- Location reads: area grade F — affects rentability + tenant quality, not the cash-flow math above.
- Leon (urban): math 48% / reading 53% proficiency, ranked #33 of 73 in FL (top 45%) — acceptable for families but not a draw, mixed tenant base, ~2y average lease.
- Market conditions: Rents rising (+1.9%/yr); 192 active listings in the ZIP; 2 comparable units currently listed for rent nearby; high-income renter base; 1,765 units permitted in Leon County in 2024 (975 in 5+ unit buildings).
Forward outlook
- Local home prices are declining (-3.0%/yr); year-one equity from $3k of loan paydown is wiped out by about $11k of value loss. Plan a longer hold.
- Leon County population projected at +23% by 2050 — long-run rental-demand tailwind backs the buy-and-hold thesis.
Negotiation context
- It's been on market 46 days — a 3% lower offer ($364k) is reasonable based on typical stale-listing flexibility.
- 2 sale attempts since 8y ago with the ask held roughly flat each time — persistent listings suggest the price (not the market) is what's stuck; bring a comps-based counter.
- Current owner paid $232k; list at $375k implies a 61% gain — meaningful room to come down on a strong offer.
Risks & watch-outs
- Climate carrying-cost: severe wind risk, 99% chance of damaging wind over 30y; extreme-heat days projected 7→22/yr by 2055 (HVAC capex compounding) — expect insurance premiums to compound above CPI over the hold.
Questions for the listing agent
- What do current leases actually rent for vs. the listed asking? Can we see a recent rent roll and the last 12 months of T-12 income?
- It's been on market 46 days. Have you received any prior offers? Is the seller open to a 28% concession, seller financing, or rate buy-down credit?
- What does the HOA fee cover, when was the last increase, and are there any pending special assessments or reserve-fund shortfalls?
- Is there a deadline driving the sale (1031 exchange, divorce, estate, relocation)? That informs how much negotiation room exists.
- The area grade is low — what's the realistic commute time and amenity access for the typical tenant pool here? Any planned neighborhood developments (good or bad) we should know about?
- What's the average days-on-market for RENTAL listings here right now (not sales)? A rising rental-DOM trend means longer vacancies and softer asking-rent achievability than the comps imply.
- What's the recent tenant-quality profile in this submarket — average credit score on applications, eviction rate, late-payment / NSF rate, and stable-employment percentage? A property-management company in the area should have these aggregated.
- How much new for-sale + rental construction is in the pipeline within 1–3 miles? Heavy new supply typically softens prices + rents 12–24 months out; constrained supply supports both.
Investment metrics
- 1% rule
- 0.72% ✗
- Cap rate
- 5.48%
- Cash-on-cash
- -2.90%
- DSCR
- 0.87
- GRM
- 11.5
CMA / ARV
- ARV (on-the-fly)
- $361,629
- Comps found
- 12
Show comp detail 12 sales within ~0.75 mi
| Address | Dist | Beds/Ba | Sqft | Sold | Price | $/sf | Match |
|---|---|---|---|---|---|---|---|
| 1766 Newman Ln | 0.31mi | 3/2.0 | 1,690 (-3%) | 2mo | $372,000 | $220 | 79 |
| 1991 Sunny Dale Dr | 0.14mi | 3/2.5 | 1,975 (+13%) | 4mo | $362,000 | $183 | 66 |
| 1899 Folkstone Rd | 0.42mi | 3/2.0 | 1,648 (-6%) | 6mo | $332,000 | $201 | 66 |
| 1790 Newman Ln | 0.35mi | 3/2.0 | 1,652 (-5%) | 10mo | $325,000 | $197 | 66 |
| 9504 Buck Haven Trl | 0.48mi | 3/2.0 | 1,878 (+8%) | 3mo | $460,000 | $245 | 62 |
| 1507 Breamstone Rdg | 0.50mi | 3/2.5 | 1,646 (-6%) | 3mo | $345,000 | $210 | 62 |
| 9112 Birch Run Ln | 0.54mi | 3/2.0 | 1,614 (-8%) | 1mo | $339,000 | $210 | 62 |
| 1624 Copperfield Cir | 0.59mi | 3/2.0 | 1,873 (+7%) | 2mo | $375,000 | $200 | 58 |
| 1835 Newman Ln | 0.31mi | 3/2.0 | 1,489 (-15%) | 6mo | $308,000 | $207 | 56 |
| 1644 Eagles Watch Way | 0.36mi | 4/2.0 (+1) | 1,948 (+12%) | 10mo | $400,000 | $205 | 51 |
| 1753 Copperfield Cir | 0.44mi | 3/2.0 | 1,992 (+14%) | 10mo | $370,000 | $186 | 48 |
| 1588 Copperfield Cir | 0.65mi | 4/2.5 (+1) | 1,955 (+12%) | 5mo | $448,500 | $229 | 39 |
Match score weights: distance 35% · size 25% · config 20% · recency 20%. Top-matched comps best support the ARV.
Projected returns pro-forma
-3.0% appreciation · 1.85% rent growth · sell at horizon
- IRR
- -22.4%
- Equity multiple
- 0.24×
- Total profit
- $-80,089
- Equity at exit
- $55,899
- IRR
- -19.4%
- Equity multiple
- 0.02×
- Total profit
- $-103,314
- Equity at exit
- $32,415
Cash invested: $104,972 (down + closing). Projections, not guarantees.
Landlord ↔ Tenant lean methodology
- Overall (STATE)
- 87 Strongly Landlord-Friendly
- State Florida
- 87 Strongly Landlord-Friendly · R+3
- County
- — inherits STATE
- City
- — inherits STATE
ZIP-level market 32312
- Rents YoY
- 1.9%
- Active inventory
- 192
- Price-to-rent
- 11.5×
Monthly cashflow live
- Estimated rent
- $2,717 medium interval (Pro) →
- Mortgage (P&I)
- −$1,966
- Tax from tax record
- −$268 /mo · $3,213/yr
- Insurance
- −$156
- HOA
- −$10
- Vacancy / Maint / Mgmt
- −$571
- Net cashflow
- $-254
Break-even live
Sensitivity live
| Price | -10% $-41 | -5% $-148 | +0% $-254 | +5% $-360 | +10% $-466 |
|---|---|---|---|---|---|
| Rent | -10% $-468 | -5% $-361 | +0% $-254 | +5% $-146 | +10% $-39 |
| Rate | -1.0pp $-65 | -0.5pp $-158 | base $-254 | +0.5pp $-351 | +1.0pp $-450 |
UW: 25.0% down · 7.5% · 30yr · 1.5% tax · 5.0% vac · 8.0% maint · 8.0% mgmt
Financing live
Cash to close
- Down payment
- $93,725
- Closing costs
- $11,247
- Reserves months
- —
- Total cash needed
- —
Loan-product check · same deal, 3 products live
Conventional
25% down · 7.5% · 30yr
- Down + closing
- —
- Monthly P&I
- —
- Monthly cashflow
- —
- DSCR
- —
- Eligible?
- —
Personal DTI + credit; lowest rate.
DSCR
20% down · 8.5% · 30yr
- Down + closing
- —
- Monthly P&I
- —
- Monthly cashflow
- —
- DSCR
- —
- Eligible?
- —
No personal income docs; deal must DSCR.
Hard money
10% down · 12.0% · 12mo
- Down + closing
- —
- Monthly P&I
- —
- Monthly cashflow
- —
- DSCR
- —
- Eligible?
- —
Short-term bridge; refi at stabilization.
Rent comps 2 comps
| Address | Beds | Baths | Sqft | Rent | $/sqft | DOM | Units | Dist |
|---|---|---|---|---|---|---|---|---|
| 9306 Tuscany Dr Unit NA Tallahassee, FL | 3.0 | 2.0 | 1472 | $2,700 | $1.83 | 21d | 1 | 0.18mi |
| 8311 Hunters Ridge Trl Tallahassee, FL | 3.0 | 2.0 | 1400 | $2,399 | $1.71 | 14d | 1 | 0.76mi |
HOA detail
- Monthly dues
- $10 · $120/yr
Listing history 20 events
-
2026-06-18days on market $374,900 Active 46 DOM
-
2026-06-17days on market $374,900 Active 45 DOM
-
2026-06-16days on market $374,900 Active 44 DOM
-
2026-06-15days on market $374,900 Active 43 DOM
-
2026-06-14days on market $374,900 Active 41 DOM
-
2026-06-10days on market $374,900 Active 38 DOM
-
2026-06-09days on market $374,900 Active 37 DOM
-
2026-06-08days on market $374,900 Active 36 DOM
-
2026-06-07remarks 454-char remark
-
2026-06-07days on market $374,900 Active 35 DOM
-
2026-06-05days on market $374,900 Active 32 DOM
-
2026-06-03days on market $374,900 Active 31 DOM
-
2026-06-02days on market $374,900 Active 30 DOM
-
2026-06-01days on market $374,900 Active 29 DOM
-
2026-05-31days on market $374,900 Active 28 DOM
-
2026-05-30days on market $374,900 Active 27 DOM
-
2026-05-03$374,900 Active
-
2018-10-02soldstatus $232,500 675-char remark
Show marketing remark (675 chars)
Incredible 4 bedroom home with fireplace in the highly desirable Glen of Golden Eagle neighborhood. This home has fantastic curb appeal on a corner lot nestled in the quiet rear portion of the subdivision. A++ school zone (Killearn Lakes, Deerlake, & Chiles). Home features a covered rear porch with a privacy fence, spacious bedrooms, large master bath with jetted tub and separate walk-in shower, vaulted and trey ceilings, laminate flooring throughout. NEW ROOF and NEW EXTERIOR PAINT in 2018. You have to see this home in person to truly appreciate it!!!! Home qualifies for the USDA Rural Development loan program. Home is being sold AS-IS with right to inspection.
-
2018-06-23$239,900 675-char remark
Show marketing remark (675 chars)
Incredible 4 bedroom home with fireplace in the highly desirable Glen of Golden Eagle neighborhood. This home has fantastic curb appeal on a corner lot nestled in the quiet rear portion of the subdivision. A++ school zone (Killearn Lakes, Deerlake, & Chiles). Home features a covered rear porch with a privacy fence, spacious bedrooms, large master bath with jetted tub and separate walk-in shower, vaulted and trey ceilings, laminate flooring throughout. NEW ROOF and NEW EXTERIOR PAINT in 2018. You have to see this home in person to truly appreciate it!!!! Home qualifies for the USDA Rural Development loan program. Home is being sold AS-IS with right to inspection.
-
2002-05-01soldstatus $1,400,000
ⓘ Source: listings_history table (triggers on properties + properties_extension) + one-shot
backfill from property_details.listing_events for pre-trigger history.
Tax reassessment forecast FL · Resets to sale price
- Current annual tax
- $3,213 · $268/mo
- Projected year-2 tax
- $3,213 · $268/mo
- Expected delta
- $0/yr ($0/mo · 0.0%)
ⓘ Screening estimate from a state-policy table — verify with the county assessor before closing.
Climate risk First Street
- Flood 1/10 Low FEMA zone X (unshaded) · 0% chance over 30 yrs
- Wildfire 4/10 Moderate
- Heat 8/10 Severe 7 d/yr ≥108°F today · 22 d/yr by 30 yrs out
- Wind 9/10 Extreme 99% chance of damaging wind over 30 yrs
- Air quality 4/10 Moderate 6 unhealthy d/yr today · 6 by 30 yrs out
Nearby sold comps map
Loading sold comps map…
Walkable amenities ~0.75 mi
Loading nearby amenities…
Taxation est. · year 1
- Rental income
- $32,603
- − Mortgage interest
- −$21,000
- − Property taxes
- −$3,213
- − Insurance
- −$1,874
- − Repairs & maintenance
- −$2,608
- − Management
- −$2,608
- − HOA
- −$120
- − Depreciation
- −$10,906
- Taxable loss
- −$9,728
- Est. tax savings @ 24.0%
- +$2,335
- After-tax cash flow
- $-709/yr
For passive investors: Depreciation is non-cash, so a rental often shows a tax loss while cash-flowing — sheltering income. Rental losses are passive: they offset passive income freely, and up to $25,000/yr can offset ordinary (W-2) income if you actively participate and your MAGI is under $100k (phasing out to $0 by $150k); unused losses carry forward. On sale, claimed depreciation is recaptured at up to 25%, and gains may owe capital-gains tax (a 1031 exchange can defer both). Figures are a year-1 estimate at your 24.0% rate — not tax advice; consult a CPA.
Schools (NCES district)
- District
- Leon
- NCES district ID
- 1201110
- Math proficiency
- 48% ▼ -13.00%
- Reading proficiency
- 53% ▼ -5.00%
- Median HH income
- $46,339
- Composite
- 42.84/100
- National rank
- #3131
- State rank
- #33 of 73 in FL
Livability — Bradfordville
No livability data for this city. (Only ~50 U.S. cities are tracked.)
Census & demographics
- Census place
- Bradfordville, FL
- County
- Leon County · 294,472 people
- City population
- 31,966
- Metro
- Tallahassee, FL
- Population (ZIP)
- 32,216
- Household income
- $123,032
- Rent vs Own
- Severe rent burden
- 630.0
Population outlook (Leon County) Hauer SSP2
- Today (2025)
- 315,507 people
- By 2030
- 330,677 · +4.8%
- By 2040
- 358,465 · +13.6%
- By 2050
- 386,804 · +22.6%
- By 2075
- 465,480 · +47.5%
- By 2100
- 519,959 · +64.8%
Race, ethnicity, and origin ACS 2023
- Neighborhood character
- Predominantly White (75%)
- Race & ethnicity
- White 75% Black 11% Hispanic / Latino 6% Two or more races 5% Asian 5%
- Hispanic origin (detail)
- Mexican 2%
- Common ancestry
- Slovak 4% Italian 4% Serbian 2%
- Foreign-born
- 9% · Canada, China
- Languages at home
- 90% English-only · Spanish 3% Chinese 2% Other Asian/Pacific 1%
Political lean MEDSL · Leon
- 2024 margin
- Strong D (+21.8) · D 60.3% · R 38.5% · Other 1.2%
- 2008→2024 swing
- -2.5pp toward R · 2008: 24.3pp · 2024: 21.8pp
- All cycles
- 2024: D+21.8 2020: D+28.3 2016: D+25.1 2012: D+23.6 2008: D+24.3
Not yet ingested
- Civics
- —
Market trends
- HPI YoY
- ▼ -211.79%
- Current HPI
- 240.8961
- Rent YoY
- ▲ 1.85%
- Metro
- Tallahassee, FL
- State GDP YoY
- ▲ 3.28%
- F500 in state
- 36
Industry mix (Fortune 500 HQ in FL)
| Industry | F500 HQs | Revenue |
|---|---|---|
| Industrial Technology | 2 | $29B |
|
||
| Insurance | 2 | $17B |
|
||
| Retail | 1 | $60B |
|
||
| Technology Distribution | 1 | $58B |
|
||
| Homebuilding | 1 | $35B |
|
||
| Technology Manufacturing | 1 | $35B |
|
||
Price history
-73.2% since first listed4 events — show timeline
- 2026-05-03 Listed $374,900 CATRS
- 2018-10-02 Sold (MLS) $232,500 CATRS
- 2018-06-23 Listed $239,900 CATRS
- 2002-05-01 Sold (Public Records) $1,400,000 Public Records
Property tax history
+3.9%/yrLatest (2025): $3,213 · +2.8% YoY. Source: county tax records.
Cash-flow waterfall
monthlySold comps — $/sqft
last 12 mo · ≤1 miLoading sold comps…