406 Debbie St · Little Elm, TX
Flood risk 1/10 · Minimal
- FEMA flood zone
- X (shaded)
- Chance of flooding over 30 yrs
- 0.0%
- Est. flood insurance / yr
- $507 – $1,088
Fire risk 3/10 · Minor
- Est. fire insurance / yr
- $1,222 – $2,270
Heat risk 7/10 · Major
- Hot days now (above 109°F)
- 7 days/yr
- Hot days in 30 yrs
- 23 days/yr
Wind risk 5/10 · Moderate
- Chance of severe wind over 30 yrs
- 26.0%
Air-quality risk 4/10 · Minor
- Unhealthy air days now
- 4 days/yr
- Unhealthy air days in 30 yrs
- 5 days/yr
Risk factors via First Street. Map © Google.
Why this score? — see what drove the B+ grade
The composite is a weighted blend of 9 inputs, each scored 0–100. Each bar is that input's sub-score; the figure is the points it added to the 100-point composite (weight × sub-score).
- Cash flow +30.0/30.0
- ARV discount +15.0/15.0
- 1% rule +10.0/10.0
- DSCR +10.0/10.0
- Schools +3.6/10.0
- Livability +3.2/5.0
- Condition / age +2.5/5.0
- Rent growth +2.1/5.0
- Appreciation +0.0/10.0
$117,000
🖨 Deal sheet (PDF) 📄 Offer letter ✓ Due diligence
Listing remarks MLS
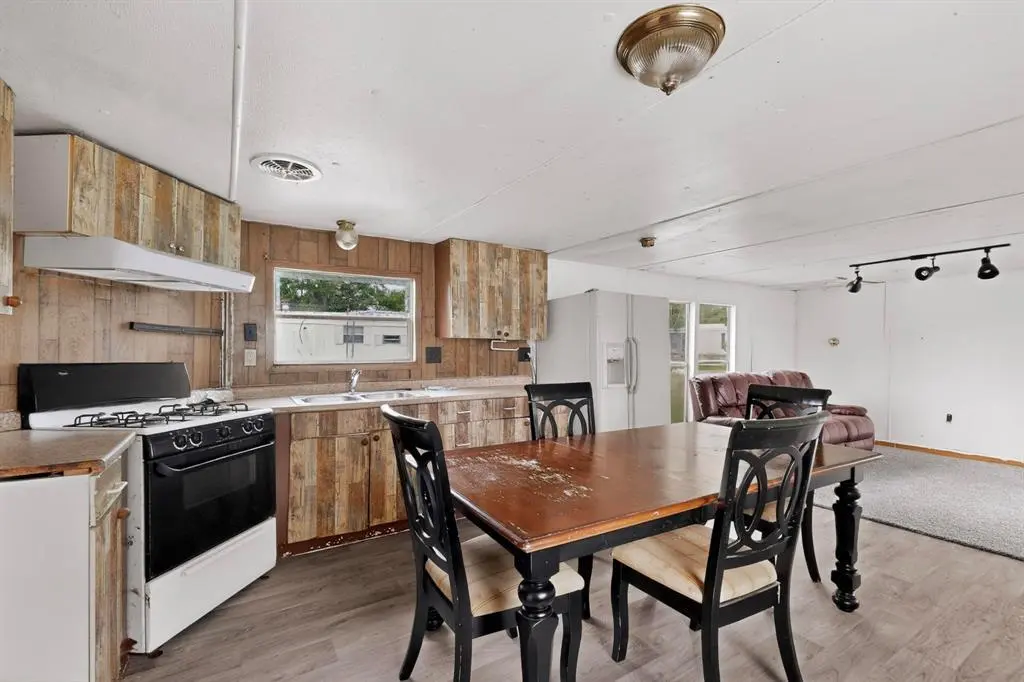
This property offers an excellent opportunity just minutes from the shores of Lake Lewisville. Enjoy the appeal of lakeside living with convenient access to boating, dining, and outdoor recreation. In addition to its prime location, freshly painted interior, new flooring throughout, the home is capable of generating significant rental income, making it a strong option for investors or buyers looking to offset their mortgage. Whether you’re seeking a weekend retreat, full-time residence, or income-producing property, this home delivers both lifestyle and value in a growing area. Buyer to verify square footage
Key facts
- Outdoor recreation
- Lakeside living
- Access to boating
Tags
Neighborhood map
What this means for you Summary
Snapshot
- This is a 3-bed/2.0-bath manufactured listed at $117k.
Deal economics
- At list price, monthly cash flow is $967 ($12k/yr) — positive.
- The deal already cash-flows at list — no discount required.
- Meets the 1% rule at list price ($2k rent vs $117k).
- Recommended offer: $113k (3.0% below list) — sets the bar for market timing.
- Cap rate 16.2% vs local median 3.0% in Little Elm — top-decile yield for the area; either an underpriced asset or a hidden risk that comps aren't pricing in. Stress-test before assuming the spread holds.
Location & tenants
- Location reads 64/100 on livability (#790 in TX) — a middle-class / working-renter tenant base. Strengths: crime A+, employment A+, housing A+; Watch: schools C-, amenities F, commute F.
- Little Elm ISD (suburban): math 36% / reading 42% proficiency, ranked #327 of 826 in TX (top 40%) — families likely to look elsewhere, expect single-tenant / working-renter base with shorter leases.
- Market conditions: Rents soft (-1.5%/yr); 1306 active listings in the ZIP; 1 comparable units currently listed for rent nearby; high-income renter base; 10,531 units permitted in Denton County in 2024 (2,713 in 5+ unit buildings).
Forward outlook
- Local home prices are declining (-3.0%/yr); year-one equity from $809 of loan paydown is wiped out by about $4k of value loss. Plan a longer hold.
- Denton County population projected at +66% by 2050 — long-run rental-demand tailwind backs the buy-and-hold thesis.
- At projected returns (-3.0% appreciation + 0.0% rent growth), your $33k cash investment doubles in ~4 years — after that, you're playing with house money.
Negotiation context
- It's been on market 53 days — a 3% lower offer ($113k) is reasonable based on typical stale-listing flexibility.
Risks & watch-outs
- Climate carrying-cost: moderate wind risk, 26% chance of damaging wind over 30y; extreme-heat days projected 7→23/yr by 2055 (HVAC capex compounding) — expect insurance premiums to compound above CPI over the hold.
Questions for the listing agent
- It's been on market 53 days. Have you received any prior offers? Is the seller open to a 3% concession, seller financing, or rate buy-down credit?
- Is there a deadline driving the sale (1031 exchange, divorce, estate, relocation)? That informs how much negotiation room exists.
- What's the average days-on-market for RENTAL listings here right now (not sales)? A rising rental-DOM trend means longer vacancies and softer asking-rent achievability than the comps imply.
- What's the recent tenant-quality profile in this submarket — average credit score on applications, eviction rate, late-payment / NSF rate, and stable-employment percentage? A property-management company in the area should have these aggregated.
- How much new for-sale + rental construction is in the pipeline within 1–3 miles? Heavy new supply typically softens prices + rents 12–24 months out; constrained supply supports both.
Investment metrics
- 1% rule
- 1.83% ✓
- Cap rate
- 16.21%
- Cash-on-cash
- 35.41%
- DSCR
- 2.58
- GRM
- 4.5
CMA / ARV
- ARV (median comp)
- $210,326
- List price
- $117,000
- Delta
- -44.37%
- Verdict
- UNDERPRICED
- Comps
- 1 within 2.0 mi
Show comp detail 1 sale within ~0.75 mi
| Address | Dist | Beds/Ba | Sqft | Sold | Price | $/sf | Match |
|---|---|---|---|---|---|---|---|
| 504 Allen St | 0.06mi | 3/2.0 | 1,008 (+5%) | 22mo | $209,000 | $207 | 70 |
Match score weights: distance 35% · size 25% · config 20% · recency 20%. Top-matched comps best support the ARV.
Projected returns pro-forma
-3.0% appreciation · 0.0% rent growth · sell at horizon
- IRR
- 27.7%
- Equity multiple
- 2.11×
- Total profit
- $36,307
- Equity at exit
- $17,445
- IRR
- 33.5%
- Equity multiple
- 3.64×
- Total profit
- $86,522
- Equity at exit
- $10,116
Cash invested: $32,760 (down + closing). Projections, not guarantees.
Landlord ↔ Tenant lean methodology
- Overall (STATE)
- 87 Strongly Landlord-Friendly
- State Texas
- 87 Strongly Landlord-Friendly · R+5
- County
- — inherits STATE
- City
- — inherits STATE
ZIP-level market 75068
- Home prices YoY
- -25.5%
- Rents YoY
- -1.5%
- Active inventory
- 1306
- Price-to-rent
- 4.5×
Monthly cashflow live
- Estimated rent
- $2,146 medium interval (Pro) →
- Mortgage (P&I)
- −$614
- Tax from tax record
- −$67 /mo · $800/yr
- Insurance
- −$49
- HOA
- −$0
- Vacancy / Maint / Mgmt
- −$451
- Net cashflow
- $967
Break-even live
Sensitivity live
| Price | -10% $1,033 | -5% $1,000 | +0% $967 | +5% $934 | +10% $901 |
|---|---|---|---|---|---|
| Rent | -10% $797 | -5% $882 | +0% $967 | +5% $1,052 | +10% $1,136 |
| Rate | -1.0pp $1,026 | -0.5pp $997 | base $967 | +0.5pp $936 | +1.0pp $906 |
UW: 25.0% down · 7.5% · 30yr · 1.5% tax · 5.0% vac · 8.0% maint · 8.0% mgmt
Financing live
Cash to close
- Down payment
- $29,250
- Closing costs
- $3,510
- Reserves months
- —
- Total cash needed
- —
Loan-product check · same deal, 3 products live
Conventional
25% down · 7.5% · 30yr
- Down + closing
- —
- Monthly P&I
- —
- Monthly cashflow
- —
- DSCR
- —
- Eligible?
- —
Personal DTI + credit; lowest rate.
DSCR
20% down · 8.5% · 30yr
- Down + closing
- —
- Monthly P&I
- —
- Monthly cashflow
- —
- DSCR
- —
- Eligible?
- —
No personal income docs; deal must DSCR.
Hard money
10% down · 12.0% · 12mo
- Down + closing
- —
- Monthly P&I
- —
- Monthly cashflow
- —
- DSCR
- —
- Eligible?
- —
Short-term bridge; refi at stabilization.
Rent comps 1 comps
| Address | Beds | Baths | Sqft | Rent | $/sqft | DOM | Units | Dist |
|---|---|---|---|---|---|---|---|---|
| 201 E Eldorado Pkwy Little Elm, TX | 2.0 | 1.0–2.0 | 1001 | $2,049 | $2.05 | 2d | 21 | 0.88mi |
Listing history 13 events
-
2026-06-13statusdays on market $117,000 Pending 53 DOM
-
2026-06-09days on market $117,000 Active Option Contract 50 DOM
-
2026-06-08days on market $117,000 Active Option Contract 49 DOM
-
2026-06-07statusdays on market $117,000 Active Option Contract 48 DOM
-
2026-06-04days on market $117,000 Active 45 DOM
-
2026-06-03days on market $117,000 Active 44 DOM
-
2026-06-02days on market $117,000 Active 43 DOM
-
2026-06-01days on market $117,000 Active 42 DOM
-
2026-05-31days on market $117,000 Active 41 DOM
-
2026-05-15price $127,499 625-char remark
Show marketing remark (625 chars)
This property offers an excellent opportunity just minutes from the shores of Lake Lewisville. Enjoy the appeal of lakeside living with convenient access to boating, dining, and outdoor recreation. In addition to its prime location, freshly painted interior, new flooring throughout, the home is capable of generating significant rental income, making it a strong option for investors or buyers looking to offset their mortgage. Whether you’re seeking a weekend retreat, full-time residence, or income-producing property, this home delivers both lifestyle and value in a growing area. Buyer to verify square footage
-
2026-04-27price $129,999 625-char remark
Show marketing remark (625 chars)
This property offers an excellent opportunity just minutes from the shores of Lake Lewisville. Enjoy the appeal of lakeside living with convenient access to boating, dining, and outdoor recreation. In addition to its prime location, freshly painted interior, new flooring throughout, the home is capable of generating significant rental income, making it a strong option for investors or buyers looking to offset their mortgage. Whether you’re seeking a weekend retreat, full-time residence, or income-producing property, this home delivers both lifestyle and value in a growing area. Buyer to verify square footage
-
2026-04-13$140,000 Active 625-char remark
Show marketing remark (625 chars)
This property offers an excellent opportunity just minutes from the shores of Lake Lewisville. Enjoy the appeal of lakeside living with convenient access to boating, dining, and outdoor recreation. In addition to its prime location, freshly painted interior, new flooring throughout, the home is capable of generating significant rental income, making it a strong option for investors or buyers looking to offset their mortgage. Whether you’re seeking a weekend retreat, full-time residence, or income-producing property, this home delivers both lifestyle and value in a growing area. Buyer to verify square footage
-
2025-08-05soldstatus
ⓘ Source: listings_history table (triggers on properties + properties_extension) + one-shot
backfill from property_details.listing_events for pre-trigger history.
Tax reassessment forecast TX · Resets to sale price
- Current annual tax
- $800 · $67/mo
- Projected year-2 tax
- $2,141 · $178/mo
- Expected delta
- +$1,341/yr (+$112/mo · 167.6%)
ⓘ Screening estimate from a state-policy table — verify with the county assessor before closing.
Climate risk First Street
- Flood 1/10 Low FEMA zone X (shaded) · 0% chance over 30 yrs
- Wildfire 3/10 Moderate
- Heat 7/10 Severe 7 d/yr ≥109°F today · 23 d/yr by 30 yrs out
- Wind 5/10 Major 26% chance of damaging wind over 30 yrs
- Air quality 4/10 Moderate 4 unhealthy d/yr today · 5 by 30 yrs out
Nearby sold comps map
Loading sold comps map…
Walkable amenities ~0.75 mi
Loading nearby amenities…
Taxation est. · year 1
- Rental income
- $25,758
- − Mortgage interest
- −$6,554
- − Property taxes
- −$800
- − Insurance
- −$585
- − Repairs & maintenance
- −$2,061
- − Management
- −$2,061
- − Depreciation
- −$3,404
- Taxable income
- $10,294
- Est. tax owed @ 24.0%
- −$2,471
- After-tax cash flow
- $9,130/yr
For passive investors: Depreciation is non-cash, so a rental often shows a tax loss while cash-flowing — sheltering income. Rental losses are passive: they offset passive income freely, and up to $25,000/yr can offset ordinary (W-2) income if you actively participate and your MAGI is under $100k (phasing out to $0 by $150k); unused losses carry forward. On sale, claimed depreciation is recaptured at up to 25%, and gains may owe capital-gains tax (a 1031 exchange can defer both). Figures are a year-1 estimate at your 24.0% rate — not tax advice; consult a CPA.
Schools (NCES district)
- District
- Little Elm ISD
- NCES district ID
- 4827720
- Math proficiency
- 36% ▼ -11.00%
- Reading proficiency
- 42% ▼ -5.00%
- Median HH income
- $76,400
- Composite
- 36.17/100
- National rank
- #4734
- State rank
- #327 of 826 in TX
Livability — Little Elm
- Score
- 64/100
- State rank
- #790
- US rank
- #14430
Category grades
Schools grade is shown separately in the Schools card above.
Census & demographics
- Census place
- Little Elm, TX
- County
- Denton County · 901,654 people
- City population
- 72,710
- Metro
- Dallas-Fort Worth-Arlington, TX
- Population (ZIP)
- 72,710
- Household income
- $126,635
- Rent vs Own
- Severe rent burden
- 829.0
Population outlook (Denton County) Hauer SSP2
- Today (2025)
- 1,053,010 people
- By 2030
- 1,192,269 · +13.2%
- By 2040
- 1,472,920 · +39.9%
- By 2050
- 1,746,506 · +65.9%
- By 2075
- 2,358,497 · +124.0%
- By 2100
- 2,779,183 · +163.9%
Race, ethnicity, and origin ACS 2023
- Neighborhood character
- Highly diverse neighborhood (Simpson 0.74)
- Race & ethnicity
- White 40% Hispanic / Latino 23% Black 19% Two or more races 15% Asian 12% Native American 1%
- Hispanic origin (detail)
- Mexican 17%
- Common ancestry
- Lithuanian 2% Italian 2% Slovak 1%
- Foreign-born
- 19% · Canada, South Korea, China
- Languages at home
- 71% English-only · Spanish 15% Other Asian/Pacific 5% Other Indo-European 4%
Political lean MEDSL · Denton
- 2024 margin
- R (+13.2) · D 42.7% · R 55.8% · Other 1.5%
- 2008→2024 swing
- +11.0pp toward D · 2008: -24.2pp · 2024: -13.2pp
- All cycles
- 2024: R+13.2 2020: R+8.1 2016: R+20.2 2012: R+31.7 2008: R+24.2
Not yet ingested
- Civics
- —
Market trends
- HPI YoY
- ▼ -85.41%
- Current HPI
- 249.755
- Rent YoY
- ▼ -1.50%
- Metro
- Dallas-Fort Worth-Arlington, TX
- State GDP YoY
- ▲ 3.95%
- F500 in state
- 110
Industry mix (Fortune 500 HQ in TX)
| Industry | F500 HQs | Revenue |
|---|---|---|
| Energy | 16 | $1,198B |
|
||
| Technology | 5 | $198B |
|
||
| Engineering / Construction | 4 | $72B |
|
||
| Energy Services | 3 | $60B |
|
||
| Utilities | 3 | $41B |
|
||
| Healthcare | 2 | $330B |
|
||
Price history
-8.9% since first listed4 events — show timeline
- 2026-05-15 Price Changed $127,499 NTREIS
- 2026-04-27 Price Changed $129,999 NTREIS
- 2026-04-13 Listed $140,000 NTREIS
- 2025-08-05 Sold (Public Records) — Public Records
Property tax history
+5.2%/yrLatest (2025): $800 · +19.3% YoY. Source: county tax records.
Cash-flow waterfall
monthlySold comps — $/sqft
last 12 mo · ≤1 miLoading sold comps…