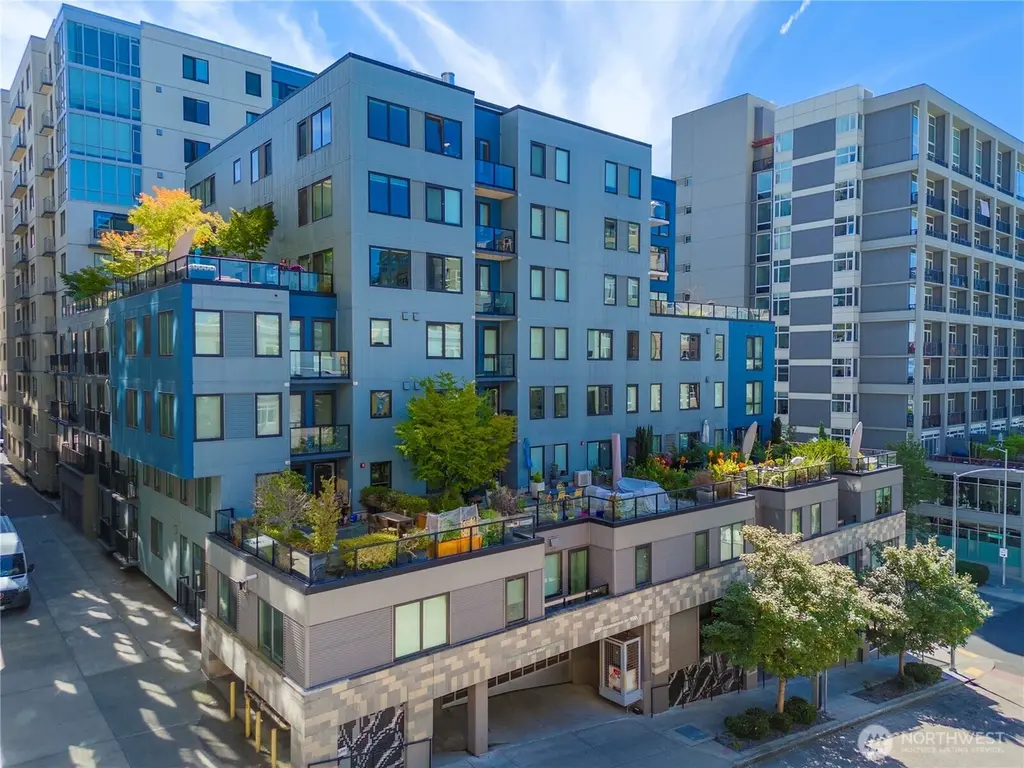
81 Clay St #224 · Seattle, WA
Flood risk 1/10 · Minimal
- FEMA flood zone
- X (unshaded)
- Chance of flooding over 30 yrs
- 0.0%
- Est. flood insurance / yr
- $507 – $1,088
Fire risk 1/10 · Minimal
- Est. fire insurance / yr
- $604 – $1,122
Heat risk 3/10 · Minor
- Hot days now (above 86°F)
- 7 days/yr
- Hot days in 30 yrs
- 15 days/yr
Wind risk 1/10 · Minimal
- Chance of severe wind over 30 yrs
- —
Air-quality risk 7/10 · Major
- Unhealthy air days now
- 11 days/yr
- Unhealthy air days in 30 yrs
- 12 days/yr
Risk factors via First Street. Map © Google.
Why this score? — see what drove the D- grade
The composite is a weighted blend of 9 inputs, each scored 0–100. Each bar is that input's sub-score; the figure is the points it added to the 100-point composite (weight × sub-score).
- ARV discount +15.0/15.0
- Schools +6.1/10.0
- Appreciation +4.6/10.0
- Livability +3.8/5.0
- Cash flow +3.0/30.0
- Rent growth +2.5/5.0
- Condition / age +2.5/5.0
- 1% rule +1.8/10.0
- DSCR +0.0/10.0
$380,000
🖨 Deal sheet 📄 Offer letter ✓ Due diligence
Listing remarks
Urban elegance comes alive in this spacious 1-bedroom + den home in the heart of Belltown. This light-filled residence features beautiful bamboo floors, custom kitchen cabinetry, and an oversized granite island—perfect for entertaining. The wide-open floor plan includes a custom den ideal for a home office or easily convertible to a Murphy bed for guests. The primary suite offers a full double-vanity bathroom and generous closet space. Enjoy premier amenities including a rooftop deck with breathtaking city, Sound, and mountain views, owners’ lounge, fitness center, courtyard, guest suite, and 24/7 concierge. A strong HOA, no rental cap, and 30-day minimum rental policy make this
Key facts
- Rooftop deck
- Bamboo floors
- $763 HOA
Tags
Neighborhood map
What this means for you Summary
Snapshot
- This is a 1-bed/1.0-bath condo listed at $380k.
Deal economics
- At list price, monthly cash flow is $-1k ($-15k/yr) — negative.
- To cash-flow at today's rent, offer at most $162k (57.3% below list).
- To meet the 1% rule (rent ≥ 1% of price), the offer needs to be $260k (31.6% below list).
- Recommended offer: $162k (57.3% below list) — sets the bar for cash-flow.
- Cap rate 2.4% vs local median 1.6% in Seattle — top-decile yield for the area; either an underpriced asset or a hidden risk that comps aren't pricing in. Stress-test before assuming the spread holds.
Location & tenants
- Location reads 75/100 on livability (#166 in WA, #4,033 nationally) — a middle-class / working-renter tenant base. Strengths: amenities A+, commute A+, employment A+; Watch: crime F, cost of living F.
- Seattle Public Schools (urban): math 64% / reading 72% proficiency, ranked #19 of 291 in WA (top 6%) — acceptable for families but not a draw, mixed tenant base, ~2y average lease.
- Market conditions: Rents flat; 229 active listings in the ZIP; 40 comparable units currently listed for rent nearby; rentals leasing fast (median 1d on market — plan ~1-2 weeks tenant-placement turnaround); high-income renter base; 10,555 units permitted in King County in 2024 (7,119 in 5+ unit buildings).
Forward outlook
- Local home prices are declining (-0.8%/yr); year-one equity from $3k of loan paydown is wiped out by about $3k of value loss. Plan a longer hold.
- King County population projected at +44% by 2050 — long-run rental-demand tailwind backs the buy-and-hold thesis.
Negotiation context
- It's been on market 130 days — a 12% lower offer ($334k) is reasonable based on typical stale-listing flexibility.
- 2 sale attempts since 13y ago; this cycle's ask has dropped $95k (20%) from the opening price — seller is motivated, your offer sets the floor, not the list.
- Current owner paid $314k; 21% above their basis — modest negotiation headroom, anchor on the comps not their cost.
Risks & watch-outs
- Watch-outs: HOA is 29% of rent.
Questions for the listing agent
- What do current leases actually rent for vs. the listed asking? Can we see a recent rent roll and the last 12 months of T-12 income?
- It's been on market 130 days. Have you received any prior offers? Is the seller open to a 57% concession, seller financing, or rate buy-down credit?
- What does the HOA fee cover, when was the last increase, and are there any pending special assessments or reserve-fund shortfalls?
- Any open or pending special assessments — roof, HVAC, plumbing, elevator, façade? What's the per-unit balance and payoff schedule, and is the seller paying it off at close or rolling it to the buyer?
- Why hasn't it sold? Are there any deal-killer items the seller is aware of (foundation, flood, title, zoning, code violations)?
- Is there a deadline driving the sale (1031 exchange, divorce, estate, relocation)? That informs how much negotiation room exists.
- Schools are A-rated — typically a magnet for longer-tenancy family renters. What's the average tenant stay here, and is there a school-zone premium baked into asking?
- Crime grade is F in this area — have there been break-ins, vandalism, or insurance claims at this property in the last 3 years? What carrier currently insures it and at what premium?
- The area grade is low — what's the realistic commute time and amenity access for the typical tenant pool here? Any planned neighborhood developments (good or bad) we should know about?
- What's the average days-on-market for RENTAL listings here right now (not sales)? A rising rental-DOM trend means longer vacancies and softer asking-rent achievability than the comps imply.
- What's the recent tenant-quality profile in this submarket — average credit score on applications, eviction rate, late-payment / NSF rate, and stable-employment percentage? A property-management company in the area should have these aggregated.
- How much new apartment / multifamily construction is in the pipeline within 1–3 miles? Heavy new supply (>2% of stock underway) typically softens rents 12–24 months out; light construction supports rent growth.
Investment metrics
- 1% rule
- 0.68% ✗
- Cap rate
- 2.40%
- Cash-on-cash
- -13.91%
- DSCR
- 0.38
- GRM
- 12.2
CMA / ARV
- ARV (median comp)
- $542,468
- List price
- $380,000
- Delta
- -29.95%
- Verdict
- UNDERPRICED
- Comps
- 20 within 1.0 mi
Projected returns pro-forma
-0.81% appreciation · 0.05% rent growth · sell at horizon
- IRR
- -25.1%
- Equity multiple
- -0.04×
- Total profit
- $-110,992
- Equity at exit
- $95,131
- IRR
- -21.9%
- Equity multiple
- -0.79×
- Total profit
- $-190,675
- Equity at exit
- $102,825
Cash invested: $106,400 (down + closing). Projections, not guarantees.
Landlord ↔ Tenant lean methodology
- Overall (CITY)
- 0 Strongly Tenant-Friendly
- State Washington
- 28 Tenant-Leaning · D+8
- County
- — inherits STATE
- City Seattle
- 0 Strongly Tenant-Friendly · D+52
ZIP-level market 98121
- Home prices YoY
- -0.5%
- Rents YoY
- 0.1%
- Active inventory
- 229
- Price-to-rent
- 12.2×
Monthly cashflow live
- Estimated rent
- $2,600 high interval (Pro) →
- Mortgage (P&I)
- −$1,993
- Tax from tax record
- −$373 /mo · $4,474/yr
- Insurance
- −$158
- HOA
- −$763
- Vacancy / Maint / Mgmt
- −$546
- Net cashflow
- $-1,233
Break-even live
UW: 25.0% down · 7.5% · 30yr · 1.5% tax · 5.0% vac · 8.0% maint · 8.0% mgmt
Financing live
Cash to close
- Down payment
- $95,000
- Closing costs
- $11,400
- Reserves months
- —
- Total cash needed
- —
Loan-product check · same deal, 3 products live
Conventional
25% down · 7.5% · 30yr
- Down + closing
- —
- Monthly P&I
- —
- Monthly cashflow
- —
- DSCR
- —
- Eligible?
- —
Personal DTI + credit; lowest rate.
DSCR
20% down · 8.5% · 30yr
- Down + closing
- —
- Monthly P&I
- —
- Monthly cashflow
- —
- DSCR
- —
- Eligible?
- —
No personal income docs; deal must DSCR.
Hard money
10% down · 12.0% · 12mo
- Down + closing
- —
- Monthly P&I
- —
- Monthly cashflow
- —
- DSCR
- —
- Eligible?
- —
Short-term bridge; refi at stabilization.
Rent comps 40 comps
| Address | Beds | Baths | Sqft | Rent | $/sqft | DOM | Units | Dist |
|---|---|---|---|---|---|---|---|---|
| 81 Clay St #526 Seattle, WA | 1.0 | 1.0 | 652 | $2,150 | $3.30 | 1d | 1 | 0.01mi |
| 2800 Western Ave Seattle, WA | 2.0 | 1.0–2.0 | 869 | $2,629 | $3.02 | 1d | 6 | 0.02mi |
| 2801 1st Ave Seattle, WA | 1.0 | 1.0 | 721 | $2,500 | $3.47 | 18d | 1 | 0.02mi |
| 2801 1st Ave Seattle, WA | 1.0 | 1.0 | 719 | $2,500 | $3.48 | 1d | 1 | 0.02mi |
| 2721 1st Ave Seattle, WA | 1.0 | 1.0 | 617 | $2,022 | $3.28 | 43d | 3 | 0.02mi |
| 2721 1st Ave Seattle, WA | 1.0 | 1.0 | 657 | $2,150 | $3.27 | 1d | 1 | 0.03mi |
| 2717 Western Ave #1116 Seattle, WA | 2.0 | 2.0 | 1070 | $4,250 | $3.97 | 1d | 1 | 0.05mi |
| 2717 Western Ave #1014 Seattle, WA | — | 1.0 | 720 | $2,400 | $3.33 | 43d | 1 | 0.05mi |
| 2801 Western Ave Seattle, WA | 3.0 | 1.0–2.0 | 1409 | $2,753 | $1.95 | 1d | 22 | 0.06mi |
| 62 Cedar St Seattle, WA | 1.0 | 1.0 | 701 | $3,270 | $4.66 | 18d | 5 | 0.08mi |
| 62 Cedar St #657 Seattle, WA | 1.0 | 1.0 | 565 | $3,400 | $6.02 | 1d | 2 | 0.08mi |
| 2716 Elliott Ave Seattle, WA | 1.0 | 2.0 | 1054 | $3,000 | $2.85 | 4d | 1 | 0.08mi |
| 2716 Elliott Ave Seattle, WA | 1.0 | 2.0 | 1054 | $3,200 | $3.04 | 17d | 1 | 0.08mi |
| 2716 Elliott Ave #402 Seattle, WA | 1.0 | 2.0 | 1054 | $3,200 | $3.04 | 21d | 1 | 0.08mi |
| 2922 Western Ave Seattle, WA | 2.0 | 1.0–2.0 | 684 | $2,118 | $3.10 | 1d | 12 | 0.10mi |
| 2900 1st Ave Seattle, WA | 1.0–2.0 | 1.0 | 732 | $2,629 | $3.59 | 1d | 3 | 0.10mi |
| 2607 Western Ave Seattle, WA | 1.0–2.0 | 1.0–2.0 | 895 | $2,450 | $2.74 | 2d | 2 | 0.11mi |
| 2607 Western Ave #710 Seattle, WA | 2.0 | 2.0 | 1025 | $3,650 | $3.56 | 1d | 1 | 0.11mi |
| 10 Clay St Seattle, WA | 1.0 | 1.0 | 625 | $2,895 | $4.63 | 1d | 2 | 0.11mi |
| 10 Clay St Seattle, WA | 2.0 | 1.0–2.0 | 830 | $1,975 | $2.38 | 13d | 1 | 0.11mi |
| 2911 2nd Ave Seattle, WA | 2.0 | 2.0 | 1066 | $3,600 | $3.38 | 18d | 1 | 0.11mi |
| 2911 2nd Ave Seattle, WA | 1.0 | 1.0 | 603 | $1,795 | $2.98 | 1d | 1 | 0.11mi |
| 2510 Western Ave Seattle, WA | 1.0 | 1.0 | 627 | $1,660 | $2.65 | 1d | 1 | 0.14mi |
| 75 Vine St Seattle, WA | 2.0 | 1.0–2.0 | 774 | $3,422 | $4.42 | 1d | 11 | 0.14mi |
| 121 Vine St #602 Seattle, WA | 1.0 | 1.0 | 661 | $2,550 | $3.86 | 1d | 1 | 0.15mi |
| 225 Cedar St Seattle, WA | 2.0 | 1.0–2.0 | 711 | $2,694 | $3.79 | 1d | 18 | 0.15mi |
| 2504 Western Ave Seattle, WA | 1.0 | 1.0 | 600 | $2,022 | $3.37 | 1d | 2 | 0.16mi |
| 2720 3rd Ave Seattle, WA | 1.0 | 1.0 | 650 | $2,350 | $3.62 | 1d | 1 | 0.16mi |
| 2720 3rd Ave Seattle, WA | 1.0 | 1.0 | 650 | $2,450 | $3.77 | 24d | 1 | 0.16mi |
| 210 Wall St Seattle, WA | 3.0 | 1.0–3.5 | 1176 | $4,092 | $3.48 | 1d | 1 | 0.17mi |
| 159 Denny Way Seattle, WA | 1.0 | 1.0–1.5 | 696 | $2,900 | $4.16 | 1d | 3 | 0.18mi |
| 311 Cedar St Seattle, WA | 1.0–2.0 | 1.0 | 724 | $1,876 | $2.59 | 1d | 14 | 0.19mi |
| 3028 1st Ave Seattle, WA | — | 1.0 | 794 | $1,402 | $1.77 | 43d | 5 | 0.20mi |
| 2414 1st Ave Seattle, WA | 1.0 | 1.0 | 553 | $1,948 | $3.52 | 1d | 1 | 0.21mi |
| 2440 Western Ave Apt 408 Seattle, WA | 1.0 | 1.0 | 650 | $1,900 | $2.92 | 43d | 1 | 0.21mi |
| 2400 Elliott Ave Seattle, WA | 1.0–2.0 | 1.0–2.0 | 997 | $1,971 | $1.98 | 1d | 16 | 0.21mi |
| 351 Broad St Seattle, WA | 1.0 | 1.0 | 640 | $1,800 | $2.81 | 23d | 1 | 0.22mi |
| 351 Broad St Seattle, WA | 2.0 | 2.0 | 1016 | $3,850 | $3.79 | 1d | 1 | 0.22mi |
| 105 Warren Ave N Seattle, WA | 1.0–2.0 | 1.0–2.0 | 767 | $1,809 | $2.36 | 1d | 5 | 0.22mi |
| 116 Warren Ave N Seattle, WA | 2.0 | 2.0 | 1012 | $3,095 | $3.06 | 7d | 1 | 0.23mi |
HOA detail condo
- Monthly dues
- $763 · $9,156/yr
- Likely covers
- gymdoorman
- Assessments
- None detected in remarks — confirm with the listing agent.
Listing history 26 events
-
2026-06-19days on market $380,000 Active 130 DOM
-
2026-06-18days on market $380,000 Active 129 DOM
-
2026-06-17days on market $380,000 Active 128 DOM
-
2026-06-16days on market $380,000 Active 127 DOM
-
2026-06-15days on market $380,000 Active 126 DOM
-
2026-06-15days on market $380,000 Active 125 DOM
-
2026-06-13days on market $380,000 Active 124 DOM
-
2026-06-12days on market $380,000 Active 123 DOM
-
2026-06-10days on market $380,000 Active 121 DOM
-
2026-06-09days on market $380,000 Active 120 DOM
-
2026-06-08days on market $380,000 Active 119 DOM
-
2026-06-07days on market $380,000 Active 118 DOM
-
2026-06-07days on market $380,000 Active 117 DOM
-
2026-06-04days on market $380,000 Active 115 DOM
-
2026-06-03days on market $380,000 Active 114 DOM
-
2026-06-02days on market $380,000 Active 113 DOM
-
2026-06-01days on market $380,000 Active 112 DOM
-
2026-05-31days on market $380,000 Active 111 DOM
-
2026-04-15price $380,000
-
2026-02-16price $425,000
-
2026-02-09$475,000 Active
-
2013-09-11historical
-
2013-09-10soldstatus $314,000 Sold
-
2013-09-10soldstatus $314,000
-
2013-08-27status Pending
-
2013-08-14$335,000 Active
ⓘ Source: listings_history table (triggers on properties + properties_extension) + one-shot
backfill from property_details.listing_events for pre-trigger history.
Tax reassessment forecast WA · Resets to sale price
- Current annual tax
- $4,474 · $373/mo
- Projected year-2 tax
- $4,474 · $373/mo
- Expected delta
- $0/yr ($0/mo · 0.0%)
ⓘ Screening estimate from a state-policy table — verify with the county assessor before closing.
Climate risk First Street
- Flood 1/10 Low FEMA zone X (unshaded) · 0% chance over 30 yrs
- Wildfire 1/10 Low
- Heat 3/10 Moderate 7 d/yr ≥86°F today · 15 d/yr by 30 yrs out
- Wind 1/10 Low
- Air quality 7/10 Severe 11 unhealthy d/yr today · 12 by 30 yrs out
Nearby sold comps map
Loading sold comps map…
Walkable amenities ~0.75 mi
Loading nearby amenities…
Taxation est. · year 1
- Rental income
- $31,199
- − Mortgage interest
- −$21,286
- − Property taxes
- −$4,474
- − Insurance
- −$1,900
- − Repairs & maintenance
- −$2,496
- − Management
- −$2,496
- − HOA
- −$9,156
- − Depreciation
- −$11,055
- Taxable loss
- −$21,663
- Est. tax savings @ 24.0%
- +$5,199
- After-tax cash flow
- $-9,596/yr
For passive investors: Depreciation is non-cash, so a rental often shows a tax loss while cash-flowing — sheltering income. Rental losses are passive: they offset passive income freely, and up to $25,000/yr can offset ordinary (W-2) income if you actively participate and your MAGI is under $100k (phasing out to $0 by $150k); unused losses carry forward. On sale, claimed depreciation is recaptured at up to 25%, and gains may owe capital-gains tax (a 1031 exchange can defer both). Figures are a year-1 estimate at your 24.0% rate — not tax advice; consult a CPA.
Schools (NCES district)
- District
- Seattle Public Schools
- NCES district ID
- 5307710
- Math proficiency
- 64% ▼ -1.00%
- Reading proficiency
- 72% ▬ 0.00%
- Median HH income
- $68,695
- Composite
- 60.76/100
- National rank
- #1649
- State rank
- #19 of 291 in WA
Livability — Seattle
- Score
- 75/100
- State rank
- #166
- US rank
- #4033
Category grades
Schools grade is shown separately in the Schools card above.
Census & demographics
- Census place
- Seattle, WA
- County
- King County · 2,251,916 people
- City population
- 706,262
- Metro
- Seattle-Tacoma-Bellevue, WA
- Population (ZIP)
- 21,166
- Household income
- $152,019
- Rent vs Own
- Severe rent burden
- 1835.0
Population outlook (King County) Hauer SSP2
- Today (2025)
- 2,576,485 people
- By 2030
- 2,803,316 · +8.8%
- By 2040
- 3,255,921 · +26.4%
- By 2050
- 3,706,444 · +43.9%
- By 2075
- 4,746,063 · +84.2%
- By 2100
- 5,407,730 · +109.9%
Race, ethnicity, and origin ACS 2023
- Neighborhood character
- Diverse neighborhood (Simpson 0.65)
- Race & ethnicity
- White 47% Asian 34% Two or more races 9% Hispanic / Latino 8% Black 3%
- Hispanic origin (detail)
- Mexican 6%
- Common ancestry
- Portuguese 3% Italian 3% Slovak 2%
- Foreign-born
- 40% · China, Canada, South Korea
- Languages at home
- 59% English-only · Other Indo-European 13% Chinese 10% Spanish 5%
Political lean MEDSL · King
- 2024 margin
- Solid D (+51.7) · D 74.2% · R 22.5% · Other 3.4%
- 2008→2024 swing
- +9.6pp toward D · 2008: 42.1pp · 2024: 51.7pp
- All cycles
- 2024: D+51.7 2020: D+52.7 2016: D+50.4 2012: D+39.9 2008: D+42.1
Not yet ingested
- Civics
- —
Market trends
- HPI YoY
- ▼ -0.81%
- Current HPI
- 165.0124
- Rent YoY
- ▬ 0.05%
- Metro
- Seattle-Tacoma-Bellevue, WA
- State GDP YoY
- ▲ 4.65%
- F500 in state
- 22
Industry mix (Fortune 500 HQ in WA)
| Industry | F500 HQs | Revenue |
|---|---|---|
| Retail | 2 | $269B |
|
||
| Technology / Retail | 1 | $638B |
|
||
| Technology | 1 | $245B |
|
||
| Telecommunications | 1 | $38B |
|
||
| Food / Beverage | 1 | $36B |
|
||
| Automotive / Trucks | 1 | $34B |
|
||
Price history
+13.4% since first listed8 events — show timeline
- 2026-04-15 Price Changed $380,000 NWMLS as Distributed by MLS Grid
- 2026-02-16 Price Changed $425,000 NWMLS as Distributed by MLS Grid
- 2026-02-09 Listed $475,000 NWMLS as Distributed by MLS Grid
- 2013-09-11 Delisted — NWMLS as Distributed by MLS Grid
- 2013-09-10 Sold (Public Records) $314,000 Public Records
- 2013-09-10 Sold (MLS) $314,000 NWMLS as Distributed by MLS Grid
- 2013-08-27 Pending — NWMLS as Distributed by MLS Grid
- 2013-08-14 Listed $335,000 NWMLS as Distributed by MLS Grid
Property tax history
+2.3%/yrLatest (2025): $4,474 · -10.0% YoY. Source: county tax records.
Cash-flow waterfall
monthlySold comps — $/sqft
last 12 mo · ≤1 miLoading sold comps…