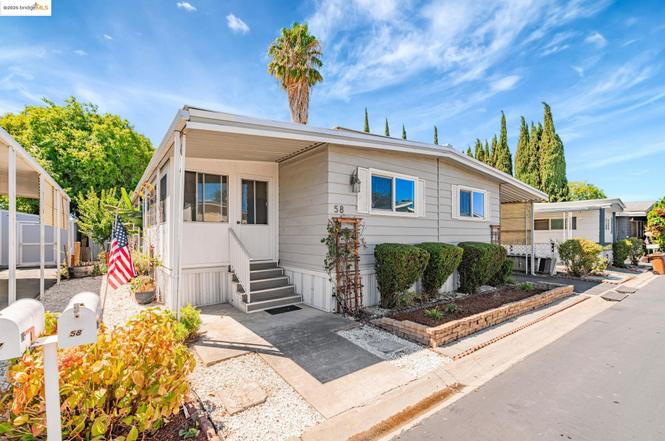
4603 Balfour Rd #58 · Brentwood, CA
Flood risk 5/10 · Moderate
- FEMA flood zone
- X (unshaded)
- Chance of flooding over 30 yrs
- 0.59%
- Est. flood insurance / yr
- $507 – $1,088
Fire risk 1/10 · Minimal
- Est. fire insurance / yr
- $659 – $1,223
Heat risk 6/10 · Moderate
- Hot days now (above 102°F)
- 7 days/yr
- Hot days in 30 yrs
- 13 days/yr
Wind risk 1/10 · Minimal
- Chance of severe wind over 30 yrs
- —
Air-quality risk 9/10 · Severe
- Unhealthy air days now
- 17 days/yr
- Unhealthy air days in 30 yrs
- 19 days/yr
Risk factors via First Street. Map © Google.
Why this score? — see what drove the B+ grade
The composite is a weighted blend of 9 inputs, each scored 0–100. Each bar is that input's sub-score; the figure is the points it added to the 100-point composite (weight × sub-score).
- Cash flow +30.0/30.0
- ARV discount +15.0/15.0
- 1% rule +10.0/10.0
- DSCR +10.0/10.0
- Schools +5.3/10.0
- Rent growth +3.8/5.0
- Livability +3.1/5.0
- Condition / age +2.5/5.0
- Appreciation +0.0/10.0
$159,000
🖨 Deal sheet (PDF) 📄 Offer letter ✓ Due diligence
Listing remarks MLS
Spacious 3 bedroom 2 bath dining room and living room with additional sun porch. New carpet, new vinyl flooring in kitchen, laundry & porch. Washer, dryer, & fridge included w/o warranty. Separate laundry room. New paint through most of home. Enclosed sun porch not included in square footage.
Key facts
- Move-in ready
- Screened-in porch
- Space for gardening
Tags
Property features AI
Finance
- HOA & community: Pets allowed; Senior community; Community amenities include clubhouse, greenbelt, and pool; Park name: Woodgate Park
Exterior
- Parking: Carport
- Utilities: 220 volts available in kitchen
- Home design: Manufactured in-park (mobile home); Double-wide; Faces north
- Construction: Masonite exterior
- Exterior features: Screened-in patio; Shed(s); Community pool; Clubhouse; Greenbelt
Interior
- Kitchen: Stone counters; Kitchen island; Built-in oven; Microwave; Dishwasher; Refrigerator; 220 volt outlet in kitchen
- Bedrooms: 3 bedrooms (street level)
- Flooring: Laminate; Carpet
- Bathrooms: 2 full bathrooms
- Heating & cooling: Forced air heating; Central air; Ceiling fans
- Interior features: Updated kitchen; Double pane windows; Sun porch
- Laundry & utility: Washer and dryer (in-unit laundry)
Neighborhood map
What this means for you Summary
Snapshot
- This is a 3-bed/2.0-bath manufactured listed at $159k.
Deal economics
- At list price, monthly cash flow is $2k ($19k/yr) — positive.
- The deal already cash-flows at list — no discount required.
- Meets the 1% rule at list price ($3k rent vs $159k).
- Recommended offer: $140k (12.0% below list) — sets the bar for market timing.
- Cap rate 18.0% vs local median 2.7% in Brentwood — top-decile yield for the area; either an underpriced asset or a hidden risk that comps aren't pricing in. Stress-test before assuming the spread holds.
Location & tenants
- Location reads 61/100 on livability (#525 in CA) — a middle-class / working-renter tenant base. Strengths: employment A+, housing A+; Watch: amenities F, commute F, cost of living F.
- Brentwood Union Elementary (suburban): math 51% / reading 59% proficiency, ranked #268 of 1,400 in CA (top 19%) — acceptable for families but not a draw, mixed tenant base, ~2y average lease.
- Zoned schools: Garin Elementary (790 students, 25% FRL); Edna Hill Middle (995 students, 24% FRL); Liberty High (2,786 students, 23% FRL) — zoned schools at 24% FRL track the district average.
- Market conditions: Rents rising fast (+5.2%/yr); 359 active listings in the ZIP; 10 comparable units currently listed for rent nearby; rentals leasing fast (median 12d on market — plan ~1-2 weeks tenant-placement turnaround); high-income renter base; 2,169 units permitted in Contra Costa County in 2024 (896 in 5+ unit buildings).
Forward outlook
- Local home prices are declining (-3.0%/yr); year-one equity from $1k of loan paydown is wiped out by about $5k of value loss. Plan a longer hold.
- Contra Costa County population projected at +26% by 2050 — long-run rental-demand tailwind backs the buy-and-hold thesis.
- At projected returns (-3.0% appreciation + 5.2% rent growth), your $45k cash investment doubles in ~3 years — after that, you're playing with house money.
Negotiation context
- It's been on market 254 days — a 12% lower offer ($140k) is reasonable based on typical stale-listing flexibility.
- 6 sale attempts since 22y ago; this cycle's ask has dropped $17k (10%) from the opening price — seller is motivated, your offer sets the floor, not the list.
- Current owner paid $95k; list at $159k implies a 68% gain — meaningful room to come down on a strong offer.
Risks & watch-outs
- Climate carrying-cost: moderate flood risk; extreme-heat days projected 7→13/yr by 2055 (HVAC capex compounding) — expect insurance premiums to compound above CPI over the hold.
Questions for the listing agent
- It's been on market 254 days. Have you received any prior offers? Is the seller open to a 12% concession, seller financing, or rate buy-down credit?
- Why hasn't it sold? Are there any deal-killer items the seller is aware of (foundation, flood, title, zoning, code violations)?
- Is there a deadline driving the sale (1031 exchange, divorce, estate, relocation)? That informs how much negotiation room exists.
- What's the average days-on-market for RENTAL listings here right now (not sales)? A rising rental-DOM trend means longer vacancies and softer asking-rent achievability than the comps imply.
- What's the recent tenant-quality profile in this submarket — average credit score on applications, eviction rate, late-payment / NSF rate, and stable-employment percentage? A property-management company in the area should have these aggregated.
- How much new for-sale + rental construction is in the pipeline within 1–3 miles? Heavy new supply typically softens prices + rents 12–24 months out; constrained supply supports both.
Investment metrics
- 1% rule
- 2.11% ✓
- Cap rate
- 18.04%
- Cash-on-cash
- 41.94%
- DSCR
- 2.87
- GRM
- 3.9
CMA / ARV
- ARV (on-the-fly)
- $243,360
- Comps found
- 12
Show comp detail 12 sales within ~0.75 mi
| Address | Dist | Beds/Ba | Sqft | Sold | Price | $/sf | Match |
|---|---|---|---|---|---|---|---|
| 4603 Balfour Rd #47 | 0.01mi | 3/2.0 | 1,388 (-4%) | 0mo | $246,000 | $177 | 94 |
| 3660 Walnut Blvd #40 | 0.12mi | 3/2.0 | 1,440 (0%) | 7mo | $245,000 | $170 | 88 |
| 4603 Balfour #29 | 0.00mi | 2/2.0 (-1) | 1,440 (0%) | 12mo | $200,000 | $139 | 85 |
| 4603 Balfour Rd #83 | 0.00mi | 2/2.0 (-1) | 1,392 (-3%) | 6mo | $151,499 | $109 | 84 |
| 4603 Balfour Rd #86 | 0.01mi | 2/2.0 (-1) | 1,536 (+7%) | 0mo | $197,000 | $128 | 84 |
| 4603 Balfour Rd #68 | 0.01mi | 3/2.0 | 1,493 (+4%) | 13mo | $226,500 | $152 | 83 |
| 4603 Balfour Rd #11 | 0.01mi | 2/2.0 (-1) | 1,345 (-7%) | 4mo | $235,000 | $175 | 80 |
| 4603 Balfour Rd #97 | 0.01mi | 3/2.0 | 1,554 (+8%) | 9mo | $269,900 | $174 | 79 |
| 3660 Walnut Blvd #53 | 0.12mi | 3/2.0 | 1,540 (+7%) | 10mo | $260,000 | $169 | 75 |
| 3660 Walnut Blvd #46 | 0.11mi | 2/2.0 (-1) | 1,346 (-6%) | 7mo | $172,500 | $128 | 73 |
| 4603 Balfour Rd Trlr 4 | 0.01mi | 2/2.0 (-1) | 1,248 (-13%) | 2mo | $160,000 | $128 | 71 |
| 3660 Walnut Blvd #57 | 0.12mi | 2/2.0 (-1) | 1,251 (-13%) | 10mo | $235,000 | $188 | 59 |
Match score weights: distance 35% · size 25% · config 20% · recency 20%. Top-matched comps best support the ARV.
Projected returns pro-forma
-3.0% appreciation · 5.22% rent growth · sell at horizon
- IRR
- 41.1%
- Equity multiple
- 2.82×
- Total profit
- $81,066
- Equity at exit
- $23,707
- IRR
- 48.4%
- Equity multiple
- 6.20×
- Total profit
- $231,362
- Equity at exit
- $13,747
Cash invested: $44,520 (down + closing). Projections, not guarantees.
Landlord ↔ Tenant lean methodology
- Overall (STATE)
- 18 Strongly Tenant-Friendly
- State California
- 18 Strongly Tenant-Friendly · D+13
- County
- — inherits STATE
- City
- — inherits STATE
ZIP-level market 94513
- Rents YoY
- 5.2%
- Active inventory
- 359
- Price-to-rent
- 3.9×
Monthly cashflow live
- Estimated rent
- $3,361 high interval (Pro) →
- Mortgage (P&I)
- −$834
- Tax est. 1.5%
- −$199 /mo · $2,385/yr
- Insurance
- −$66
- HOA
- −$0
- Vacancy / Maint / Mgmt
- −$706
- Net cashflow
- $1,556
Break-even live
Sensitivity live
| Price | -10% $1,666 | -5% $1,611 | +0% $1,556 | +5% $1,501 | +10% $1,446 |
|---|---|---|---|---|---|
| Rent | -10% $1,291 | -5% $1,423 | +0% $1,556 | +5% $1,689 | +10% $1,822 |
| Rate | -1.0pp $1,636 | -0.5pp $1,597 | base $1,556 | +0.5pp $1,515 | +1.0pp $1,473 |
UW: 25.0% down · 7.5% · 30yr · 1.5% tax · 5.0% vac · 8.0% maint · 8.0% mgmt
Financing live
Cash to close
- Down payment
- $39,750
- Closing costs
- $4,770
- Reserves months
- —
- Total cash needed
- —
Loan-product check · same deal, 3 products live
Conventional
25% down · 7.5% · 30yr
- Down + closing
- —
- Monthly P&I
- —
- Monthly cashflow
- —
- DSCR
- —
- Eligible?
- —
Personal DTI + credit; lowest rate.
DSCR
20% down · 8.5% · 30yr
- Down + closing
- —
- Monthly P&I
- —
- Monthly cashflow
- —
- DSCR
- —
- Eligible?
- —
No personal income docs; deal must DSCR.
Hard money
10% down · 12.0% · 12mo
- Down + closing
- —
- Monthly P&I
- —
- Monthly cashflow
- —
- DSCR
- —
- Eligible?
- —
Short-term bridge; refi at stabilization.
Rent comps 10 comps
| Address | Beds | Baths | Sqft | Rent | $/sqft | DOM | Units | Dist |
|---|---|---|---|---|---|---|---|---|
| 18 Canterbury Ct Brentwood, CA | 3.0 | 2.0 | 1480 | $3,200 | $2.16 | 0d | 1 | 0.53mi |
| 611 Ash Ct Brentwood, CA | 3.0 | 2.0 | 1389 | $2,995 | $2.16 | 0d | 1 | 0.58mi |
| 128 Kingfisher St Brentwood, CA | 3.0 | 2.5 | 1667 | $2,990 | $1.79 | 12d | 1 | 0.93mi |
| 1275 Central Blvd Brentwood, CA | 3.0 | 2.0 | 1050 | $3,650 | $3.48 | 12d | 1 | 0.95mi |
| 720 Winding Creek Ter Brentwood, CA | 3.0 | 2.5 | 1531 | $2,900 | $1.89 | 12d | 1 | 1.12mi |
| 955 Bighorn Ter Brentwood, CA | 3.0 | 2.5 | 1531 | $3,400 | $2.22 | 21d | 1 | 1.23mi |
| 1015 Dellwood Ct Brentwood, CA | 3.0 | 3.0 | 1645 | $3,200 | $1.95 | 26d | 1 | 1.23mi |
| 1290 Business Center Dr Brentwood, CA | 2.0 | 2.0 | 1124 | $3,236 | $2.88 | 0d | 7 | 1.29mi |
| 1100 Twinbridge Ct Brentwood, CA | 3.0 | 2.5 | 1158 | $3,250 | $2.81 | 0d | 1 | 1.32mi |
| 1377 Reagan Way Brentwood, CA | 3.0 | 2.5 | 1573 | $3,100 | $1.97 | 0d | 1 | 1.40mi |
Listing history 30 events
-
2026-06-21days on market $159,000 Active 254 DOM
-
2026-06-18days on market $159,000 Active 251 DOM
-
2026-06-17days on market $159,000 Active 250 DOM
-
2026-06-16days on market $159,000 Active 249 DOM
-
2026-06-15days on market $159,000 Active 248 DOM
-
2026-06-13days on market $159,000 Active 246 DOM
-
2026-06-13days on market $159,000 Active 245 DOM
-
2026-06-09days on market $159,000 Active 242 DOM
-
2026-06-08days on market $159,000 Active 241 DOM
-
2026-06-07days on market $159,000 Active 240 DOM
-
2026-06-04days on market $159,000 Active 237 DOM
-
2026-06-03days on market $159,000 Active 236 DOM
-
2026-06-02days on market $159,000 Active 235 DOM
-
2026-06-01days on market $159,000 Active 234 DOM
-
2026-05-31days on market $159,000 Active 233 DOM
-
2026-05-06status Active
-
2026-04-28status Pending
-
2026-03-24price $159,000
-
2026-02-26price $169,000
-
2025-12-05status Active
-
2025-11-16status Pending
-
2025-11-06status Active
-
2025-10-15status Pending
-
2025-08-22$176,000 Active
-
2017-05-16soldstatus $94,900 Sold 301-char remark
Show marketing remark (301 chars)
Spacious 3 bedroom 2 bath dining room and living room with additional sun porch. New carpet, new vinyl flooring in kitchen, laundry & porch. Washer, dryer, & fridge included w/o warranty. Separate laundry room. New paint through most of home. Enclosed sun porch not included in square footage.
-
2017-05-01status Pending - Show for Backups 301-char remark
Show marketing remark (301 chars)
Spacious 3 bedroom 2 bath dining room and living room with additional sun porch. New carpet, new vinyl flooring in kitchen, laundry & porch. Washer, dryer, & fridge included w/o warranty. Separate laundry room. New paint through most of home. Enclosed sun porch not included in square footage.
-
2017-04-01$99,900 New 301-char remark
Show marketing remark (301 chars)
Spacious 3 bedroom 2 bath dining room and living room with additional sun porch. New carpet, new vinyl flooring in kitchen, laundry & porch. Washer, dryer, & fridge included w/o warranty. Separate laundry room. New paint through most of home. Enclosed sun porch not included in square footage.
-
2004-03-16soldstatus $76,000 222-char remark
Show marketing remark (222 chars)
Hard to find-3 bedrooms!Loads of upgrades & TLC.Light&Bright-Freshly painted interior. New carpet in front bedrooms. Spacious living Room.Formal Dining Area. 2 yr new oven. Large Master Suite. VERY NICE-WON'T LAST.
-
2004-02-25historical 222-char remark
Show marketing remark (222 chars)
Hard to find-3 bedrooms!Loads of upgrades & TLC.Light&Bright-Freshly painted interior. New carpet in front bedrooms. Spacious living Room.Formal Dining Area. 2 yr new oven. Large Master Suite. VERY NICE-WON'T LAST.
-
2004-02-21$78,500 222-char remark
Show marketing remark (222 chars)
Hard to find-3 bedrooms!Loads of upgrades & TLC.Light&Bright-Freshly painted interior. New carpet in front bedrooms. Spacious living Room.Formal Dining Area. 2 yr new oven. Large Master Suite. VERY NICE-WON'T LAST.
ⓘ Source: listings_history table (triggers on properties + properties_extension) + one-shot
backfill from property_details.listing_events for pre-trigger history.
Climate risk First Street
- Flood 5/10 Major FEMA zone X (unshaded) · 59% chance over 30 yrs
- Wildfire 1/10 Low
- Heat 6/10 Major 7 d/yr ≥102°F today · 13 d/yr by 30 yrs out
- Wind 1/10 Low
- Air quality 9/10 Extreme 17 unhealthy d/yr today · 19 by 30 yrs out
Nearby sold comps map
Loading sold comps map…
Walkable amenities ~0.75 mi
Loading nearby amenities…
Taxation est. · year 1
- Rental income
- $40,327
- − Mortgage interest
- −$8,906
- − Property taxes
- −$2,385
- − Insurance
- −$795
- − Repairs & maintenance
- −$3,226
- − Management
- −$3,226
- − Depreciation
- −$4,625
- Taxable income
- $17,163
- Est. tax owed @ 24.0%
- −$4,119
- After-tax cash flow
- $14,554/yr
For passive investors: Depreciation is non-cash, so a rental often shows a tax loss while cash-flowing — sheltering income. Rental losses are passive: they offset passive income freely, and up to $25,000/yr can offset ordinary (W-2) income if you actively participate and your MAGI is under $100k (phasing out to $0 by $150k); unused losses carry forward. On sale, claimed depreciation is recaptured at up to 25%, and gains may owe capital-gains tax (a 1031 exchange can defer both). Figures are a year-1 estimate at your 24.0% rate — not tax advice; consult a CPA.
Schools (NCES district)
- District
- Brentwood Union Elementary
- NCES district ID
- 0605910
- Math proficiency
- 51% ▲ 1.00%
- Reading proficiency
- 59% ▬ 0.00%
- Median HH income
- $91,644
- Composite
- 52.7/100
- National rank
- #3320
- State rank
- #268 of 1400 in CA
Livability — Brentwood
- Score
- 61/100
- State rank
- #525
- US rank
- #17696
Category grades
Schools grade is shown separately in the Schools card above.
Census & demographics
- Census place
- Brentwood, CA
- County
- Contra Costa County · 1,059,880 people
- City population
- 69,755
- Metro
- San Francisco-Oakland-Berkeley, CA
- Population (ZIP)
- 69,755
- Household income
- $142,223
- Rent vs Own
- Severe rent burden
- 1056.0
Population outlook (Contra Costa County) Hauer SSP2
- Today (2025)
- 1,287,720 people
- By 2030
- 1,364,937 · +6.0%
- By 2040
- 1,506,209 · +17.0%
- By 2050
- 1,624,373 · +26.1%
- By 2075
- 1,853,193 · +43.9%
- By 2100
- 1,901,231 · +47.6%
Race, ethnicity, and origin ACS 2023
- Neighborhood character
- Highly diverse neighborhood (Simpson 0.71)
- Race & ethnicity
- White 43% Hispanic / Latino 25% Asian 16% Two or more races 14% Black 9%
- Hispanic origin (detail)
- Mexican 17%
- Common ancestry
- Italian 3% Russian 2% Romanian 2%
- Foreign-born
- 19% · Canada, China, South Korea
- Languages at home
- 71% English-only · Spanish 13% Other Indo-European 5% Tagalog/Filipino 4%
Political lean MEDSL · Contra Costa
- 2024 margin
- Solid D (+38.0) · D 67.3% · R 29.4% · Other 3.3%
- 2008→2024 swing
- +0.2pp no change · 2008: 37.8pp · 2024: 38.0pp
- All cycles
- 2024: D+38.0 2020: D+45.3 2016: D+43.5 2012: D+33.7 2008: D+37.8
Not yet ingested
- Civics
- —
Market trends
- HPI YoY
- ▼ -245.60%
- Current HPI
- 249.5513
- Rent YoY
- ▲ 5.22%
- Metro
- San Francisco-Oakland-Berkeley, CA
- State GDP YoY
- ▲ 3.21%
- F500 in state
- 116
Industry mix (Fortune 500 HQ in CA)
| Industry | F500 HQs | Revenue |
|---|---|---|
| Technology | 27 | $1,492B |
|
||
| Financial Services | 3 | $174B |
|
||
| Retail | 3 | $44B |
|
||
| Insurance | 3 | $26B |
|
||
| Media / Entertainment | 2 | $115B |
|
||
| Pharmaceuticals / Biotech | 2 | $62B |
|
||
Price history
+102.5% since first listed15 events — show timeline
- 2026-05-06 Relisted — bridgeMLS, Bay East AOR, or Contra Costa AOR
- 2026-04-28 Pending — bridgeMLS, Bay East AOR, or Contra Costa AOR
- 2026-03-24 Price Changed $159,000 bridgeMLS, Bay East AOR, or Contra Costa AOR
- 2026-02-26 Price Changed $169,000 bridgeMLS, Bay East AOR, or Contra Costa AOR
- 2025-12-05 Relisted — bridgeMLS, Bay East AOR, or Contra Costa AOR
- 2025-11-16 Pending — bridgeMLS, Bay East AOR, or Contra Costa AOR
- 2025-11-06 Relisted — bridgeMLS, Bay East AOR, or Contra Costa AOR
- 2025-10-15 Pending — bridgeMLS, Bay East AOR, or Contra Costa AOR
- 2025-08-22 Listed $176,000 bridgeMLS, Bay East AOR, or Contra Costa AOR
- 2017-05-16 Sold (MLS) $94,900 bridgeMLS, Bay East AOR, or Contra Costa AOR
- 2017-05-01 Pending — bridgeMLS, Bay East AOR, or Contra Costa AOR
- 2017-04-01 Listed $99,900 bridgeMLS, Bay East AOR, or Contra Costa AOR
- 2004-03-16 Sold (MLS) $76,000 bridgeMLS, Bay East AOR, or Contra Costa AOR
- 2004-02-25 Listing Removed — bridgeMLS, Bay East AOR, or Contra Costa AOR
- 2004-02-21 Listed $78,500 bridgeMLS, Bay East AOR, or Contra Costa AOR
Cash-flow waterfall
monthlySold comps — $/sqft
last 12 mo · ≤1 miLoading sold comps…