53 Ann Dr · Fort Oglethorpe, GA
Flood risk 1/10 · Minimal
- FEMA flood zone
- X (unshaded)
- Chance of flooding over 30 yrs
- 0.0%
- Est. flood insurance / yr
- $507 – $1,088
Fire risk 4/10 · Minor
- Est. fire insurance / yr
- $963 – $1,789
Heat risk 6/10 · Moderate
- Hot days now (above 104°F)
- 7 days/yr
- Hot days in 30 yrs
- 20 days/yr
Wind risk 4/10 · Minor
- Chance of severe wind over 30 yrs
- 12.0%
Air-quality risk 3/10 · Minor
- Unhealthy air days now
- 2 days/yr
- Unhealthy air days in 30 yrs
- 2 days/yr
Risk factors via First Street. Map © Google.
Why this score? — see what drove the D+ grade
The composite is a weighted blend of 9 inputs, each scored 0–100. Each bar is that input's sub-score; the figure is the points it added to the 100-point composite (weight × sub-score).
- ARV discount +14.8/15.0
- Cash flow +13.1/30.0
- Rent growth +4.4/5.0
- DSCR +3.9/10.0
- Livability +3.4/5.0
- Schools +3.3/10.0
- 1% rule +2.5/10.0
- Condition / age +2.5/5.0
- Appreciation +0.0/10.0
$232,000
🖨 Deal sheet 📄 Offer letter ✓ Due diligence
Listing remarks
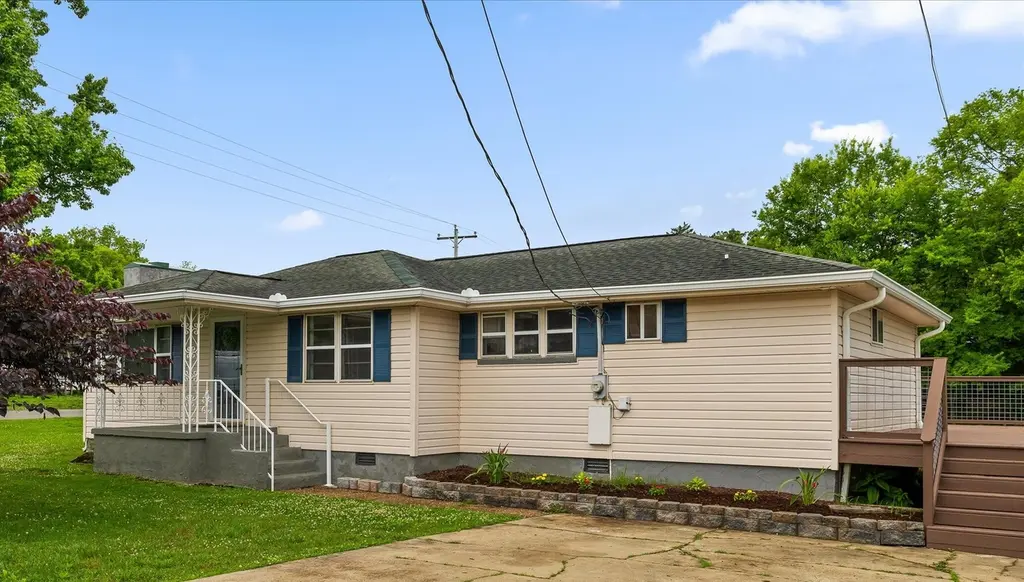
Welcome home to this move-in ready 3BR/1.5BA home in desirable Catoosa County, situated on a large, level corner lot and zoned for top-rated Catoosa County schools. This updated home features a split-bedroom floor plan, new white kitchen cabinets, granite countertops, stainless steel appliances, fresh paint, new carpet, and a brand-new electrical system. Unique character and charm shine throughout with a stunning stone fireplace accent wall and matching stone flooring in the living and dining areas, creating warmth and timeless appeal. Enjoy outdoor living on the spacious wraparound deck -- perfect for entertaining, grilling, or relaxing while overlooking the large yard. The oversized corne
Key facts
- Granite countertops
- Stone flooring
- 0.52 acre lot
Tags
Property features AI
Exterior
- Parking: Concrete driveway
- Utilities: Public water; Public sewer; Electricity connected; Water service connected
- Home design: Single-family house; One story; Updated / remodeled
- Construction: Vinyl siding; Block foundation; Shingle roof; Built as a residential single-family home
- Exterior features: Private yard; Back yard; Front yard; Level lot; Corner lot; Wrap-around covered porch with deck
Interior
- Kitchen: Stainless steel appliances; Microwave; Electric range; Dishwasher; Granite counters
- Bedrooms: Master bedroom located downstairs
- Flooring: Carpet; Stone; Vinyl
- Bathrooms: 1 full bathroom; 1 half bathroom
- Heating & cooling: Central heating (electric); Central air conditioning (electric); Ceiling fans
- Interior features: Ceiling fans; Granite counters; Walk-in closet(s); Master suite on main level; Aluminum-framed windows; Fireplace in the family room
- Laundry & utility: Dedicated laundry room on the main level
Neighborhood map
What this means for you Summary
Snapshot
- This is a 3-bed/1.0-bath single-family listed at $232k.
Deal economics
- At list price, monthly cash flow is $-10 ($-121/yr) — negative.
- To cash-flow at today's rent, offer at most $230k (0.8% below list).
- To meet the 1% rule (rent ≥ 1% of price), the offer needs to be $174k (25.0% below list).
- Recommended offer: $174k (25.0% below list) — sets the bar for 1% rule.
- Cap rate 6.2% vs local median 3.4% in Fort Oglethorpe — top-decile yield for the area; either an underpriced asset or a hidden risk that comps aren't pricing in. Stress-test before assuming the spread holds.
Location & tenants
- Location reads 67/100 on livability (#166 in GA) — a middle-class / working-renter tenant base. Strengths: cost of living A+, housing A+; Watch: amenities F, commute F, employment D-.
- Catoosa County (suburban): math 36% / reading 41% proficiency, ranked #49 of 174 in GA (top 28%) — families likely to look elsewhere, expect single-tenant / working-renter base with shorter leases.
- Zoned schools: West Side Elementary School (math 37% / reading 27%, grade F, #582 of 1,228 statewide, top 50%, 508 students, 73% FRL); Lakeview Middle School (math 24% / reading 32%, grade F, #265 of 470 statewide, top 57%, 690 students, 67% FRL); Lakeview-Fort Oglethorpe High School (math 14% / reading 22%, grade F, #258 of 424 statewide, top 62%, 1,023 students, 55% FRL) — zoned schools average 65% FRL vs 41% district-wide (24 pts higher); higher-poverty schools than district average — tighter screening recommended.
- Zoned-school proficiency averages 26% at this address vs 38% district-wide (-12 pts) — the specific schools serving this property underperform the Catoosa County average; the district grade overstates school quality for this exact location.
- Market conditions: Rents rising fast (+7.4%/yr); 425 active listings in the ZIP; 15 comparable units currently listed for rent nearby; rentals at typical pace (median 24d on market — plan ~3-4 weeks tenant-placement turnaround); 848 units permitted in Catoosa County in 2024 (256 in 5+ unit buildings).
- This rent runs 36% of the median local income ($59k/yr) — at the standard rent-burdened threshold; future hikes will face affordability resistance.
Forward outlook
- Local home prices are declining (-3.0%/yr); year-one equity from $2k of loan paydown is wiped out by about $7k of value loss. Plan a longer hold.
- Catoosa County population projected at +5% by 2050 — modest demand growth; plan on rents tracking national, not racing it.
Negotiation context
- It's been on market 21 days — a 2% lower offer ($229k) is reasonable based on typical stale-listing flexibility.
- Current owner paid $100k; list at $232k implies a 132% gain — meaningful room to come down on a strong offer.
Risks & watch-outs
- Watch-outs: built in 1957 — expect roof / HVAC / electrical / plumbing capex.
- Climate carrying-cost: extreme-heat days projected 7→20/yr by 2055 (HVAC capex compounding) — expect insurance premiums to compound above CPI over the hold.
Questions for the listing agent
- What do current leases actually rent for vs. the listed asking? Can we see a recent rent roll and the last 12 months of T-12 income?
- Built in 1957 — when were the roof, HVAC, electrical panel, plumbing, and water heater last replaced?
- Is there a deadline driving the sale (1031 exchange, divorce, estate, relocation)? That informs how much negotiation room exists.
- Schools are D-rated, which usually means shorter tenancies and higher turnover. Who's the typical renter profile here, and what's been the actual vacancy rate?
- The area grade is low — what's the realistic commute time and amenity access for the typical tenant pool here? Any planned neighborhood developments (good or bad) we should know about?
- What's the average days-on-market for RENTAL listings here right now (not sales)? A rising rental-DOM trend means longer vacancies and softer asking-rent achievability than the comps imply.
- What's the recent tenant-quality profile in this submarket — average credit score on applications, eviction rate, late-payment / NSF rate, and stable-employment percentage? A property-management company in the area should have these aggregated.
- How much new for-sale + rental construction is in the pipeline within 1–3 miles? Heavy new supply typically softens prices + rents 12–24 months out; constrained supply supports both.
Investment metrics
- 1% rule
- 0.75% ✗
- Cap rate
- 6.24%
- Cash-on-cash
- -0.19%
- DSCR
- 0.99
- GRM
- 11.1
CMA / ARV
- ARV (on-the-fly)
- $277,290
- Comps found
- 12
Show comp detail 12 sales within ~0.75 mi
| Address | Dist | Beds/Ba | Sqft | Sold | Price | $/sf | Match |
|---|---|---|---|---|---|---|---|
| 27 May St | 0.19mi | 3/2.0 | 1,196 (+2%) | 6mo | $273,500 | $229 | 78 |
| 145 Lillian Dr | 0.14mi | 2/1.5 (-1) | 1,224 (+5%) | 3mo | $75,000 | $61 | 76 |
| 175 Evergreen Cir | 0.44mi | 3/2.0 | 1,183 (+1%) | 1mo | $263,590 | $223 | 73 |
| 14 Evergreen Cir | 0.50mi | 3/2.0 | 1,183 (+1%) | 3mo | $257,450 | $218 | 69 |
| 115 Morning Mist Dr | 0.70mi | 2/2.0 (-1) | 1,184 (+1%) | 0mo | $288,000 | $243 | 56 |
| 166 Sunset Cove Dr Unit 49a | 0.62mi | 2/2.0 (-1) | 1,207 (+3%) | 4mo | $286,400 | $237 | 54 |
| 172 Idle Place Cir Lot 79 | 0.63mi | 2/2.0 (-1) | 1,086 (-7%) | 2mo | $325,000 | $299 | 48 |
| 114 Clara Lee Dr | 0.60mi | 3/2.0 | 1,274 (+9%) | 7mo | $248,500 | $195 | 48 |
| 313 Walker Rd | 0.58mi | 3/2.0 | 1,320 (+13%) | 0mo | $190,000 | $144 | 48 |
| 211 Idle Place Cir | 0.68mi | 2/2.0 (-1) | 1,090 (-7%) | 6mo | $320,000 | $294 | 43 |
| 164 Idle Place Cir Lot 80 | 0.63mi | 2/2.0 (-1) | 1,023 (-13%) | 2mo | $290,000 | $283 | 39 |
| 402 Idle Place Cir Lot 56 | 0.68mi | 2/2.0 (-1) | 1,023 (-13%) | 0mo | $300,000 | $293 | 38 |
Match score weights: distance 35% · size 25% · config 20% · recency 20%. Top-matched comps best support the ARV.
Projected returns pro-forma
-3.0% appreciation · 7.44% rent growth · sell at horizon
- IRR
- -12.4%
- Equity multiple
- 0.53×
- Total profit
- $-30,216
- Equity at exit
- $34,592
- IRR
- 1.7%
- Equity multiple
- 1.14×
- Total profit
- $8,975
- Equity at exit
- $20,059
Cash invested: $64,960 (down + closing). Projections, not guarantees.
Landlord ↔ Tenant lean methodology
- Overall (STATE)
- 90 Strongly Landlord-Friendly
- State Georgia
- 90 Strongly Landlord-Friendly · R+3
- County
- — inherits STATE
- City
- — inherits STATE
ZIP-level market 30741
- Home prices YoY
- -30.7%
- Rents YoY
- 7.4%
- Active inventory
- 425
- Price-to-rent
- 11.1×
Monthly cashflow live
- Estimated rent
- $1,741 high interval (Pro) →
- Mortgage (P&I)
- −$1,217
- Tax from tax record
- −$72 /mo · $866/yr
- Insurance
- −$97
- HOA
- −$0
- Vacancy / Maint / Mgmt
- −$366
- Net cashflow
- $-10
Break-even live
UW: 25.0% down · 7.5% · 30yr · 1.5% tax · 5.0% vac · 8.0% maint · 8.0% mgmt
Financing live
Cash to close
- Down payment
- $58,000
- Closing costs
- $6,960
- Reserves months
- —
- Total cash needed
- —
Loan-product check · same deal, 3 products live
Conventional
25% down · 7.5% · 30yr
- Down + closing
- —
- Monthly P&I
- —
- Monthly cashflow
- —
- DSCR
- —
- Eligible?
- —
Personal DTI + credit; lowest rate.
DSCR
20% down · 8.5% · 30yr
- Down + closing
- —
- Monthly P&I
- —
- Monthly cashflow
- —
- DSCR
- —
- Eligible?
- —
No personal income docs; deal must DSCR.
Hard money
10% down · 12.0% · 12mo
- Down + closing
- —
- Monthly P&I
- —
- Monthly cashflow
- —
- DSCR
- —
- Eligible?
- —
Short-term bridge; refi at stabilization.
Rent comps 15 comps
| Address | Beds | Baths | Sqft | Rent | $/sqft | DOM | Units | Dist |
|---|---|---|---|---|---|---|---|---|
| 22 Ann Dr Rossville, GA | 2.0 | 1.0 | 800 | $1,250 | $1.56 | 14d | 1 | 0.06mi |
| 686 Mack Smith Rd Rossville, GA | 3.0 | 2.0 | 1443 | $2,500 | $1.73 | 44d | 1 | 0.09mi |
| 2426 Cloud Springs Rd Rossville, GA | 2.0 | 1.0 | 1456 | $1,200 | $0.82 | 44d | 1 | 0.75mi |
| 105 Biscayne Blvd Rossville, GA | 2.0 | 2.0 | 1000 | $1,650 | $1.65 | 44d | 1 | 1.14mi |
| 34 Biscayne Blvd Rossville, GA | 3.0 | 1.0 | 1100 | $1,399 | $1.27 | 14d | 1 | 1.21mi |
| 183 Bunker Dr Rossville, GA | 3.0 | 2.0 | 1454 | $1,978 | $1.36 | 23d | 1 | 1.24mi |
| 5700 Roper St Chattanooga, TN | 1.0–2.0 | 1.0–1.5 | 795 | $1,120 | $1.41 | 23d | 1 | 1.36mi |
| 1640 Keeble St East Ridge, TN | 2.0 | 1.5 | 800 | $1,095 | $1.37 | 23d | 1 | 1.38mi |
| 1638 Keeble St Unit 1640 Chattanooga, TN | 2.0 | 1.5 | 800 | $1,095 | $1.37 | 23d | 1 | 1.38mi |
| 80 Savannah Way Unit 38 Amelia Fort Oglethorpe, GA | 2.0 | 1.5 | 1302 | $1,300 | $1.00 | 23d | 1 | 1.40mi |
| 304 Fort Town Dr Fort Oglethorpe, GA | 1.0–2.0 | 1.0–2.0 | 870 | $1,486 | $1.71 | 14d | 23 | 1.42mi |
| 134 S Cedar Ln Fort Oglethorpe, GA | 2.0 | 1.5 | 946 | $1,050 | $1.11 | 14d | 1 | 1.43mi |
| 76 S Cedar Ln Fort Oglethorpe, GA | 2.0 | 1.5 | 1050 | $1,050 | $1.00 | 23d | 1 | 1.45mi |
| 132 S Cedar Ln Fort Oglethorpe, GA | 2.0 | 1.5 | 946 | $1,100 | $1.16 | 44d | 1 | 1.48mi |
| 1502 Prater Rd Chattanooga, TN | 4.0 | 1.5 | 1280 | $2,340 | $1.83 | 23d | 1 | 1.48mi |
Listing history 17 events
-
2026-06-18days on market $232,000 Active 21 DOM
-
2026-06-17days on market $232,000 Active 20 DOM
-
2026-06-16days on market $232,000 Active 19 DOM
-
2026-06-15days on market $232,000 Active 18 DOM
-
2026-06-14days on market $232,000 Active 16 DOM
-
2026-06-10days on market $232,000 Active 13 DOM
-
2026-06-09days on market $232,000 Active 12 DOM
-
2026-06-08days on market $232,000 Active 11 DOM
-
2026-06-07days on market $232,000 Active 10 DOM
-
2026-06-03days on market $232,000 Active 6 DOM
-
2026-06-02days on market $232,000 Active 5 DOM
-
2026-06-01days on market $232,000 Active 4 DOM
-
2026-05-31days on market $232,000 Active 3 DOM
-
2026-05-30days on market $232,000 Active 2 DOM
-
2026-05-22$232,000 Active
-
2026-03-10soldstatus $100,000
-
1978-08-01soldstatus $26,000
ⓘ Source: listings_history table (triggers on properties + properties_extension) + one-shot
backfill from property_details.listing_events for pre-trigger history.
Tax reassessment forecast GA · Resets to sale price
- Current annual tax
- $866 · $72/mo
- Projected year-2 tax
- $2,134 · $178/mo
- Expected delta
- +$1,268/yr (+$106/mo · 146.4%)
ⓘ Screening estimate from a state-policy table — verify with the county assessor before closing.
Climate risk First Street
- Flood 1/10 Low FEMA zone X (unshaded) · 0% chance over 30 yrs
- Wildfire 4/10 Moderate
- Heat 6/10 Major 7 d/yr ≥104°F today · 20 d/yr by 30 yrs out
- Wind 4/10 Moderate 12% chance of damaging wind over 30 yrs
- Air quality 3/10 Moderate 2 unhealthy d/yr today · 2 by 30 yrs out
Nearby sold comps map
Loading sold comps map…
Walkable amenities ~0.75 mi
Loading nearby amenities…
Taxation est. · year 1
- Rental income
- $20,892
- − Mortgage interest
- −$12,996
- − Property taxes
- −$866
- − Insurance
- −$1,160
- − Repairs & maintenance
- −$1,671
- − Management
- −$1,671
- − Depreciation
- −$6,749
- Taxable loss
- −$4,221
- Est. tax savings @ 24.0%
- +$1,013
- After-tax cash flow
- $892/yr
For passive investors: Depreciation is non-cash, so a rental often shows a tax loss while cash-flowing — sheltering income. Rental losses are passive: they offset passive income freely, and up to $25,000/yr can offset ordinary (W-2) income if you actively participate and your MAGI is under $100k (phasing out to $0 by $150k); unused losses carry forward. On sale, claimed depreciation is recaptured at up to 25%, and gains may owe capital-gains tax (a 1031 exchange can defer both). Figures are a year-1 estimate at your 24.0% rate — not tax advice; consult a CPA.
Schools (NCES district)
- District
- Catoosa County
- NCES district ID
- 1300930
- Math proficiency
- 36% ▼ -15.00%
- Reading proficiency
- 41% ▼ -8.00%
- Median HH income
- $48,913
- Composite
- 33.13/100
- National rank
- #5558
- State rank
- #49 of 174 in GA
Livability — Fort Oglethorpe
- Score
- 67/100
- State rank
- #166
- US rank
- #10498
Category grades
Schools grade is shown separately in the Schools card above.
Census & demographics
- County
- Walker County · 48,831 people
- City population
- 7,745
- Metro
- Chattanooga, TN-GA
- Population (ZIP)
- 30,041
- Household income
- $58,834
- Rent vs Own
- Severe rent burden
- 834.0
Population outlook (Catoosa County) Hauer SSP2
- Today (2025)
- 70,112 people
- By 2030
- 71,621 · +2.2%
- By 2040
- 73,595 · +5.0%
- By 2050
- 73,921 · +5.4%
- By 2075
- 72,135 · +2.9%
- By 2100
- 65,979 · -5.9%
Race, ethnicity, and origin ACS 2023
- Neighborhood character
- Predominantly White (86%)
- Race & ethnicity
- White 86% Black 5% Two or more races 5% Hispanic / Latino 5%
- Common ancestry
- Slovak 3% Iranian 2% Italian 1%
- Foreign-born
- 2% · Canada
- Languages at home
- 96% English-only · Spanish 3%
Political lean MEDSL · Catoosa
- 2024 margin
- Solid R (+55.5) · D 22.0% · R 77.5%
- 2008→2024 swing
- -5.7pp toward R · 2008: -49.8pp · 2024: -55.5pp
- All cycles
- 2024: R+55.5 2020: R+56.0 2016: R+60.7 2012: R+52.8 2008: R+49.8
Not yet ingested
- Civics
- —
Market trends
- HPI YoY
- ▼ -118.05%
- Current HPI
- 267.0047
- Rent YoY
- ▲ 7.44%
- Metro
- Chattanooga, TN-GA
- State GDP YoY
- ▲ 2.66%
- F500 in state
- 28
Industry mix (Fortune 500 HQ in GA)
| Industry | F500 HQs | Revenue |
|---|---|---|
| Paper / Packaging | 2 | $29B |
|
||
| Retail | 1 | $160B |
|
||
| Transportation / Logistics | 1 | $91B |
|
||
| Airlines | 1 | $62B |
|
||
| Consumer Goods | 1 | $47B |
|
||
| Utilities | 1 | $25B |
|
||
Price history
+792.3% since first listed3 events — show timeline
- 2026-05-22 Listed $232,000 GCAR
- 2026-03-10 Sold (Public Records) $100,000 Public Records
- 1978-08-01 Sold (Public Records) $26,000 Public Records
Property tax history
+6.3%/yrLatest (2025): $866 · +139.4% YoY. Source: county tax records.
Cash-flow waterfall
monthlySold comps — $/sqft
last 12 mo · ≤1 miLoading sold comps…