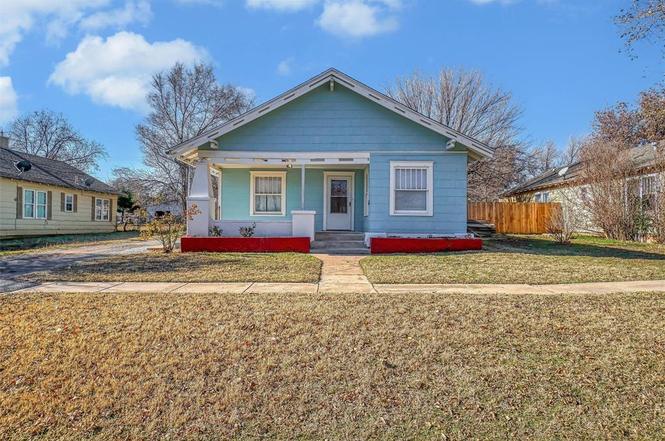
412 S 11th St · Clinton, OK
Flood risk 1/10 · Minimal
- FEMA flood zone
- X (unshaded)
- Chance of flooding over 30 yrs
- 0.0%
- Est. flood insurance / yr
- $507 – $1,088
Fire risk 6/10 · Moderate
- Est. fire insurance / yr
- $2,463 – $4,575
Heat risk 6/10 · Moderate
- Hot days now (above 107°F)
- 7 days/yr
- Hot days in 30 yrs
- 20 days/yr
Wind risk 2/10 · Minimal
- Chance of severe wind over 30 yrs
- 2.0%
Air-quality risk 1/10 · Minimal
- Unhealthy air days now
- 0 days/yr
- Unhealthy air days in 30 yrs
- 0 days/yr
Risk factors via First Street. Map © Google.
Why this score? — see what drove the D+ grade
The composite is a weighted blend of 9 inputs, each scored 0–100. Each bar is that input's sub-score; the figure is the points it added to the 100-point composite (weight × sub-score).
- Cash flow +20.6/30.0
- DSCR +6.6/10.0
- 1% rule +4.3/10.0
- Appreciation +3.8/10.0
- ARV discount +3.2/15.0
- Livability +3.2/5.0
- Rent growth +2.5/5.0
- Condition / age +2.5/5.0
- Schools +1.9/10.0
$119,000
🖨 Deal sheet 📄 Offer letter ✓ Due diligence
Listing remarks
Motivated Seller-Bring A Fair Offer! Charming Updated Bungalow-Style Home for Sale in Clinton, Oklahoma Welcome to 412 S 11th Street in Clinton, Oklahoma! This recently updated 3-bedroom, 2-bathroom bungalow-style home combines timeless charm with modern comfort. From the moment you arrive, you’ll fall in love with the inviting curb appeal and spacious front porch, perfect for sipping your morning coffee or relaxing in the evening. Step inside to discover a home filled with natural light and thoughtful updates. The open layout flows seamlessly, creating a warm and welcoming atmosphere. The kitchen boasts modern fixtures and finishes while maintaining the cozy charm of a bungalow. E
Key facts
- Spacious front porch
- Covered back patio
- 7,000 sq ft lot
Tags
Property features AI
Finance
- Financial info: Listing accepts cash and conventional offers; Loan qualification allowed
- HOA & community: No mandatory association dues
Exterior
- Parking: 1-car garage
- Home design: Single-family residence; One story; Existing property
- Construction: Frame construction; Composition roof
- Exterior features: Covered patio; Porch; Interior lot
Interior
- Bedrooms: 3 bedrooms
- Bathrooms: 2 full bathrooms
- Interior features: One living area; No fireplace; Below-ground storm shelter; Post-tension foundation
Neighborhood map
What this means for you Summary
Snapshot
- This is a 2-bed/2.0-bath single-family listed at $119k.
Deal economics
- At list price, monthly cash flow is $160 ($2k/yr) — positive.
- The deal already cash-flows at list — no discount required.
- To meet the 1% rule (rent ≥ 1% of price), the offer needs to be $110k (7.2% below list).
- Recommended offer: $105k (12.0% below list) — sets the bar for market timing.
- Cap rate 7.9% vs local median 6.1% in Clinton — meaningfully above typical; check what's discounted (condition, days-on-market, listing class) to confirm the premium yield is real.
Location & tenants
- Location reads 63/100 on livability (#196 in OK) — a middle-class / working-renter tenant base. Strengths: cost of living A+, housing A-; Watch: crime D+, amenities F, commute F.
- Clinton (town): math 21% / reading 23% proficiency, ranked #149 of 270 in OK (top 55%) — low school quality limits family demand, transient renter base, plan for 1-2y turnover; 67% free/reduced lunch — lower-income household profile, screen leases tightly.
- Zoned schools: Southwest Es (math 20% / reading 14%, grade F, #540 of 845 statewide, top 68%, 468 students, 0% FRL); Clinton Hs (math 8% / reading 22%, grade F, #332 of 447 statewide, top 78%, 629 students, 0% FRL) — zoned schools average 0% FRL vs 67% district-wide (67 pts lower); this property's tenant base skews higher-income than the district average.
- Market conditions: 77 active listings in the ZIP; 28 units permitted in Custer County in 2024 (5 in 5+ unit buildings).
Forward outlook
- Local home prices are declining (-2.4%/yr); year-one equity from $823 of loan paydown is wiped out by about $3k of value loss. Plan a longer hold.
- Custer County population projected at +47% by 2050 — long-run rental-demand tailwind backs the buy-and-hold thesis.
Negotiation context
- It's been on market 539 days — a 12% lower offer ($105k) is reasonable based on typical stale-listing flexibility.
- 4 sale attempts since 19y ago; this cycle's ask has dropped $26k (18%) from the opening price — seller is motivated, your offer sets the floor, not the list.
- Current owner paid $50k; list at $119k implies a 140% gain — meaningful room to come down on a strong offer.
Risks & watch-outs
- Watch-outs: built in 1930 — expect roof / HVAC / electrical / plumbing capex.
- Climate carrying-cost: major wildfire risk; extreme-heat days projected 7→20/yr by 2055 (HVAC capex compounding) — expect insurance premiums to compound above CPI over the hold.
Questions for the listing agent
- It's been on market 539 days. Have you received any prior offers? Is the seller open to a 12% concession, seller financing, or rate buy-down credit?
- Built in 1930 — when were the roof, HVAC, electrical panel, plumbing, and water heater last replaced?
- Why hasn't it sold? Are there any deal-killer items the seller is aware of (foundation, flood, title, zoning, code violations)?
- Is there a deadline driving the sale (1031 exchange, divorce, estate, relocation)? That informs how much negotiation room exists.
- Schools are F-rated, which usually means shorter tenancies and higher turnover. Who's the typical renter profile here, and what's been the actual vacancy rate?
- Crime grade is D in this area — have there been break-ins, vandalism, or insurance claims at this property in the last 3 years? What carrier currently insures it and at what premium?
- The area grade is low — what's the realistic commute time and amenity access for the typical tenant pool here? Any planned neighborhood developments (good or bad) we should know about?
- What's the average days-on-market for RENTAL listings here right now (not sales)? A rising rental-DOM trend means longer vacancies and softer asking-rent achievability than the comps imply.
- What's the recent tenant-quality profile in this submarket — average credit score on applications, eviction rate, late-payment / NSF rate, and stable-employment percentage? A property-management company in the area should have these aggregated.
- How much new for-sale + rental construction is in the pipeline within 1–3 miles? Heavy new supply typically softens prices + rents 12–24 months out; constrained supply supports both.
Investment metrics
- 1% rule
- 0.93% ✗
- Cap rate
- 7.91%
- Cash-on-cash
- 5.76%
- DSCR
- 1.26
- GRM
- 9.0
CMA / ARV
- ARV (on-the-fly)
- $108,704
- Comps found
- 12
Show comp detail 12 sales within ~0.75 mi
| Address | Dist | Beds/Ba | Sqft | Sold | Price | $/sf | Match |
|---|---|---|---|---|---|---|---|
| 501 S 11th St | 0.07mi | 3/2.0 (+1) | 1,433 (+4%) | 12mo | $112,000 | $78 | 75 |
| 517 S 12th St | 0.11mi | 3/1.5 (+1) | 1,472 (+7%) | 11mo | $107,000 | $73 | 67 |
| 323 N 8th St | 0.51mi | 2/2.0 | 1,246 (-9%) | 2mo | $89,000 | $71 | 59 |
| 313 S 15th St | 0.27mi | 3/2.0 (+1) | 1,261 (-8%) | 12mo | $142,000 | $113 | 58 |
| 1105 S 13th St | 0.56mi | 3/2.0 (+1) | 1,272 (-8%) | 1mo | $100,000 | $79 | 56 |
| 322 S 5th St | 0.41mi | 2/2.0 | 1,498 (+9%) | 20mo | $110,000 | $73 | 50 |
| 418 S 17th St | 0.44mi | 3/2.0 (+1) | 1,543 (+12%) | 6mo | $134,000 | $87 | 50 |
| 619 S 18th St | 0.53mi | 3/2.0 (+1) | 1,416 (+3%) | 21mo | $69,300 | $49 | 48 |
| 1108 S 13th St | 0.61mi | 3/2.0 (+1) | 1,524 (+11%) | 4mo | $142,500 | $94 | 45 |
| 717 S 7th St | 0.40mi | 3/2.0 (+1) | 1,206 (-12%) | 16mo | $79,900 | $66 | 42 |
| 902 Opal Ave | 0.35mi | 3/2.0 (+1) | 1,568 (+14%) | 21mo | $128,000 | $82 | 38 |
| 1204 Camelot Dr | 0.74mi | 3/2.0 (+1) | 1,556 (+13%) | 4mo | $224,000 | $144 | 35 |
Match score weights: distance 35% · size 25% · config 20% · recency 20%. Top-matched comps best support the ARV.
Projected returns pro-forma
-2.36% appreciation · 3.0% rent growth · sell at horizon
- IRR
- -4.5%
- Equity multiple
- 0.82×
- Total profit
- $-5,928
- Equity at exit
- $21,159
- IRR
- 4.0%
- Equity multiple
- 1.32×
- Total profit
- $10,570
- Equity at exit
- $16,253
Cash invested: $33,320 (down + closing). Projections, not guarantees.
Landlord ↔ Tenant lean methodology
- Overall (STATE)
- 83 Strongly Landlord-Friendly
- State Oklahoma
- 83 Strongly Landlord-Friendly · R+20
- County
- — inherits STATE
- City
- — inherits STATE
ZIP-level market 73601
- Home prices YoY
- -1.0%
- Active inventory
- 77
- Price-to-rent
- 9.0×
Monthly cashflow live
- Estimated rent
- $1,105 medium interval (Pro) →
- Mortgage (P&I)
- −$624
- Tax from tax record
- −$39 /mo · $470/yr
- Insurance
- −$50
- HOA
- −$0
- Vacancy / Maint / Mgmt
- −$232
- Net cashflow
- $160
Break-even live
UW: 25.0% down · 7.5% · 30yr · 1.5% tax · 5.0% vac · 8.0% maint · 8.0% mgmt
Financing live
Cash to close
- Down payment
- $29,750
- Closing costs
- $3,570
- Reserves months
- —
- Total cash needed
- —
Loan-product check · same deal, 3 products live
Conventional
25% down · 7.5% · 30yr
- Down + closing
- —
- Monthly P&I
- —
- Monthly cashflow
- —
- DSCR
- —
- Eligible?
- —
Personal DTI + credit; lowest rate.
DSCR
20% down · 8.5% · 30yr
- Down + closing
- —
- Monthly P&I
- —
- Monthly cashflow
- —
- DSCR
- —
- Eligible?
- —
No personal income docs; deal must DSCR.
Hard money
10% down · 12.0% · 12mo
- Down + closing
- —
- Monthly P&I
- —
- Monthly cashflow
- —
- DSCR
- —
- Eligible?
- —
Short-term bridge; refi at stabilization.
Listing history 26 events
-
2026-06-18days on market $119,000 Active 539 DOM
-
2026-06-17days on market $119,000 Active 538 DOM
-
2026-06-16days on market $119,000 Active 537 DOM
-
2026-06-15days on market $119,000 Active 536 DOM
-
2026-06-13days on market $119,000 Active 534 DOM
-
2026-06-12days on market $119,000 Active 533 DOM
-
2026-06-09days on market $119,000 Active 530 DOM
-
2026-06-08days on market $119,000 Active 529 DOM
-
2026-06-08days on market $119,000 Active 528 DOM
-
2026-06-07days on market $119,000 Active 527 DOM
-
2026-06-04days on market $119,000 Active 524 DOM
-
2026-06-02days on market $119,000 Active 523 DOM
-
2026-06-01days on market $119,000 Active 522 DOM
-
2026-05-31days on market $119,000 Active 521 DOM
-
2026-03-31price $119,000
-
2025-11-10price $125,000
-
2025-07-07price $129,000
-
2025-05-28price $139,000
-
2024-12-26$145,000 Active
-
2020-12-17historical
-
2020-07-28$40,000
-
2020-07-24historical
-
2020-01-24$40,000
-
2007-11-16soldstatus $49,500
-
2007-11-16soldstatus $49,500
-
2007-09-04$49,500
ⓘ Source: listings_history table (triggers on properties + properties_extension) + one-shot
backfill from property_details.listing_events for pre-trigger history.
Tax reassessment forecast OK · Resets to sale price
- Current annual tax
- $470 · $39/mo
- Projected year-2 tax
- $1,071 · $89/mo
- Expected delta
- +$601/yr (+$50/mo · 127.9%)
ⓘ Screening estimate from a state-policy table — verify with the county assessor before closing.
Climate risk First Street
- Flood 1/10 Low FEMA zone X (unshaded) · 0% chance over 30 yrs
- Wildfire 6/10 Major
- Heat 6/10 Major 7 d/yr ≥107°F today · 20 d/yr by 30 yrs out
- Wind 2/10 Low 2% chance of damaging wind over 30 yrs
- Air quality 1/10 Low 0 unhealthy d/yr today · 0 by 30 yrs out
Nearby sold comps map
Loading sold comps map…
Walkable amenities ~0.75 mi
Loading nearby amenities…
Taxation est. · year 1
- Rental income
- $13,259
- − Mortgage interest
- −$6,666
- − Property taxes
- −$470
- − Insurance
- −$595
- − Repairs & maintenance
- −$1,061
- − Management
- −$1,061
- − Depreciation
- −$3,462
- Taxable loss
- −$55
- Est. tax savings @ 24.0%
- +$13
- After-tax cash flow
- $1,934/yr
For passive investors: Depreciation is non-cash, so a rental often shows a tax loss while cash-flowing — sheltering income. Rental losses are passive: they offset passive income freely, and up to $25,000/yr can offset ordinary (W-2) income if you actively participate and your MAGI is under $100k (phasing out to $0 by $150k); unused losses carry forward. On sale, claimed depreciation is recaptured at up to 25%, and gains may owe capital-gains tax (a 1031 exchange can defer both). Figures are a year-1 estimate at your 24.0% rate — not tax advice; consult a CPA.
Schools (NCES district)
- District
- Clinton
- NCES district ID
- 4008070
- Math proficiency
- 21% ▼ -7.00%
- Reading proficiency
- 23% ▼ -7.00%
- Median HH income
- $43,693
- Composite
- 18.97/100
- National rank
- #8853
- State rank
- #149 of 270 in OK
Livability — Clinton
- Score
- 63/100
- State rank
- #196
- US rank
- #14999
Category grades
Schools grade is shown separately in the Schools card above.
Census & demographics
- Census place
- Clinton, OK
- Population (ZIP)
- 9,489
Population outlook (Custer County) Hauer SSP2
- Today (2025)
- 34,356 people
- By 2030
- 37,162 · +8.2%
- By 2040
- 43,354 · +26.2%
- By 2050
- 50,458 · +46.9%
- By 2075
- 71,075 · +106.9%
- By 2100
- 91,129 · +165.2%
Race, ethnicity, and origin ACS 2023
- Neighborhood character
- Diverse neighborhood (Simpson 0.61)
- Race & ethnicity
- White 52% Hispanic / Latino 34% Two or more races 17% Native American 5% Black 5%
- Hispanic origin (detail)
- Mexican 32%
- Common ancestry
- Slovak 1% Lithuanian 1% Scottish 1%
- Foreign-born
- 9% · Canada
- Languages at home
- 76% English-only · Spanish 23% Chinese 1%
Political lean MEDSL · Custer
- 2024 margin
- Solid R (+53.2) · D 22.4% · R 75.7% · Other 1.9%
- 2008→2024 swing
- -3.9pp toward R · 2008: -49.3pp · 2024: -53.2pp
- All cycles
- 2024: R+53.2 2020: R+53.2 2016: R+54.3 2012: R+51.9 2008: R+49.3
Not yet ingested
- Civics
- —
Market trends
- HPI YoY
- ▼ -2.36%
- Current HPI
- 244.5526
- Rent YoY
- —
- Metro
- —
- State GDP YoY
- ▲ 1.55%
- F500 in state
- 6
Industry mix (Fortune 500 HQ in OK)
| Industry | F500 HQs | Revenue |
|---|---|---|
| Energy | 3 | $48B |
|
||
Price history
+140.4% since first listed12 events — show timeline
- 2026-03-31 Price Changed $119,000 MLSOK
- 2025-11-10 Price Changed $125,000 MLSOK
- 2025-07-07 Price Changed $129,000 MLSOK
- 2025-05-28 Price Changed $139,000 MLSOK
- 2024-12-26 Listed $145,000 MLSOK
- 2020-12-17 Listing Removed — MLSOK
- 2020-07-28 Listed $40,000 MLSOK
- 2020-07-24 Listing Removed — MLSOK
- 2020-01-24 Listed $40,000 MLSOK
- 2007-11-16 Sold (Public Records) $49,500 Public Records
- 2007-11-16 Sold (MLS) $49,500 MLSOK
- 2007-09-04 Listed $49,500 MLSOK
Property tax history
+2.2%/yrLatest (2025): $470 · -24.6% YoY. Source: county tax records.
Cash-flow waterfall
monthlySold comps — $/sqft
last 12 mo · ≤1 miLoading sold comps…