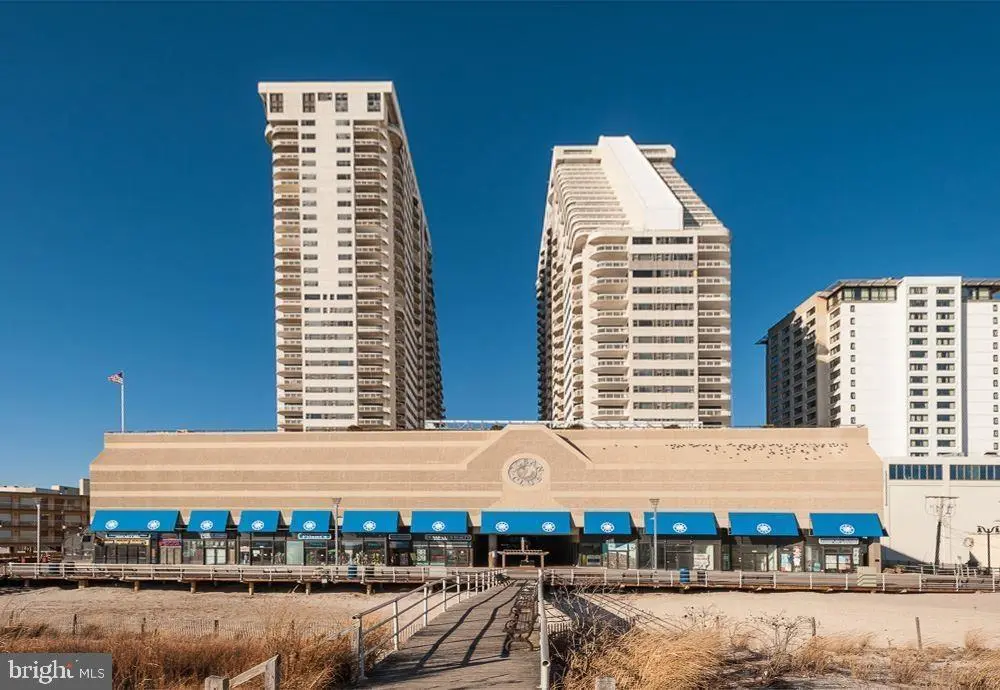
3101 Boardwalk Unit 3003A-1 · Atlantic City, NJ
Flood risk No data
- FEMA flood zone
- —
- Chance of flooding over 30 yrs
- —
- Est. flood insurance / yr
- —
Fire risk No data
- Est. fire insurance / yr
- —
Heat risk No data
- Hot days now (above threshold)
- —
- Hot days in 30 yrs
- —
Wind risk No data
- Chance of severe wind over 30 yrs
- —
Air-quality risk No data
- Unhealthy air days now
- —
- Unhealthy air days in 30 yrs
- —
Risk factors via First Street. Map © Google.
Why this score? — see what drove the D grade
The composite is a weighted blend of 9 inputs, each scored 0–100. Each bar is that input's sub-score; the figure is the points it added to the 100-point composite (weight × sub-score).
- Cash flow +12.8/30.0
- ARV discount +7.5/15.0
- 1% rule +5.9/10.0
- Condition / age +4.0/5.0
- Rent growth +3.9/5.0
- DSCR +3.8/10.0
- Livability +2.8/5.0
- Schools +1.4/10.0
- Appreciation +0.0/10.0
$219,000
🖨 Deal sheet 📄 Offer letter ✓ Due diligence
Key facts
- $394 HOA
- 679 garage spots
- Community pool
Neighborhood map
What this means for you Summary
Snapshot
- This is a 1-bed/1.5-bath condo listed at $219k. Condition is rated good.
Deal economics
- At list price, monthly cash flow is $-19 ($-231/yr) — negative.
- To cash-flow at today's rent, offer at most $216k (1.3% below list).
- Meets the 1% rule at list price ($2k rent vs $219k).
- Recommended offer: $206k (6.0% below list) — sets the bar for market timing.
- Cap rate 6.2% vs local median 3.7% in Atlantic City — top-decile yield for the area; either an underpriced asset or a hidden risk that comps aren't pricing in. Stress-test before assuming the spread holds.
Location & tenants
- Location reads 55/100 on livability (#525 in NJ) — a working-class tenant base; expect higher turnover. Strengths: health & safety A; Watch: commute D, schools F, crime F.
- Atlantic City School District (urban): math 9% / reading 26% proficiency, ranked #454 of 472 in NJ (top 96%) — low school quality limits family demand, transient renter base, plan for 1-2y turnover; 85% free/reduced lunch — lower-income household profile, screen leases tightly.
- Market conditions: Rents rising fast (+5.5%/yr); 482 active listings in the ZIP; 15 comparable units currently listed for rent nearby; rentals leasing fast (median 13d on market — plan ~1-2 weeks tenant-placement turnaround); lower-income renter base — watch delinquency; 672 units permitted in Atlantic County in 2024 (258 in 5+ unit buildings).
- At $2,390/mo this rent would consume 70% of the median local household income ($41k/yr) (locally 3414% of renters already pay >50% of income on rent) — very limited rent-growth headroom before tenants either downsize or default.
Forward outlook
- Local home prices are declining (-3.0%/yr); year-one equity from $2k of loan paydown is wiped out by about $7k of value loss. Plan a longer hold.
- Atlantic County population projected at -12% by 2050 — secular population decline; favor cash flow + early exit over multi-decade hold.
Negotiation context
- It's been on market 78 days — a 6% lower offer ($206k) is reasonable based on typical stale-listing flexibility.
Questions for the listing agent
- What do current leases actually rent for vs. the listed asking? Can we see a recent rent roll and the last 12 months of T-12 income?
- It's been on market 78 days. Have you received any prior offers? Is the seller open to a 6% concession, seller financing, or rate buy-down credit?
- What does the HOA fee cover, when was the last increase, and are there any pending special assessments or reserve-fund shortfalls?
- Any open or pending special assessments — roof, HVAC, plumbing, elevator, façade? What's the per-unit balance and payoff schedule, and is the seller paying it off at close or rolling it to the buyer?
- Why hasn't it sold? Are there any deal-killer items the seller is aware of (foundation, flood, title, zoning, code violations)?
- Is there a deadline driving the sale (1031 exchange, divorce, estate, relocation)? That informs how much negotiation room exists.
- Schools are F-rated, which usually means shorter tenancies and higher turnover. Who's the typical renter profile here, and what's been the actual vacancy rate?
- Crime grade is F in this area — have there been break-ins, vandalism, or insurance claims at this property in the last 3 years? What carrier currently insures it and at what premium?
- The area grade is low — what's the realistic commute time and amenity access for the typical tenant pool here? Any planned neighborhood developments (good or bad) we should know about?
- What's the average days-on-market for RENTAL listings here right now (not sales)? A rising rental-DOM trend means longer vacancies and softer asking-rent achievability than the comps imply.
- What's the recent tenant-quality profile in this submarket — average credit score on applications, eviction rate, late-payment / NSF rate, and stable-employment percentage? A property-management company in the area should have these aggregated.
- How much new apartment / multifamily construction is in the pipeline within 1–3 miles? Heavy new supply (>2% of stock underway) typically softens rents 12–24 months out; light construction supports rent growth.
Investment metrics
- 1% rule
- 1.09% ✓
- Cap rate
- 6.19%
- Cash-on-cash
- -0.38%
- DSCR
- 0.98
- GRM
- 7.6
CMA / ARV
No comps found within radius.
Projected returns pro-forma
-3.0% appreciation · 5.52% rent growth · sell at horizon
- IRR
- -13.3%
- Equity multiple
- 0.51×
- Total profit
- $-30,220
- Equity at exit
- $32,654
- IRR
- 0.0%
- Equity multiple
- 1.00×
- Total profit
- $85
- Equity at exit
- $18,935
Cash invested: $61,320 (down + closing). Projections, not guarantees.
Landlord ↔ Tenant lean methodology
- Overall (STATE)
- 21 Tenant-Leaning
- State New Jersey
- 21 Tenant-Leaning · D+6
- County
- — inherits STATE
- City
- — inherits STATE
ZIP-level market 08401
- Home prices YoY
- -7.0%
- Rents YoY
- 5.5%
- Active inventory
- 482
- Price-to-rent
- 7.6×
Monthly cashflow live
- Estimated rent
- $2,390 high interval (Pro) →
- Mortgage (P&I)
- −$1,148
- Tax est. 1.5%
- −$274 /mo · $3,285/yr
- Insurance
- −$91
- HOA
- −$394
- Vacancy / Maint / Mgmt
- −$502
- Net cashflow
- $-19
Break-even live
UW: 25.0% down · 7.5% · 30yr · 1.5% tax · 5.0% vac · 8.0% maint · 8.0% mgmt
Financing live
Cash to close
- Down payment
- $54,750
- Closing costs
- $6,570
- Reserves months
- —
- Total cash needed
- —
Loan-product check · same deal, 3 products live
Conventional
25% down · 7.5% · 30yr
- Down + closing
- —
- Monthly P&I
- —
- Monthly cashflow
- —
- DSCR
- —
- Eligible?
- —
Personal DTI + credit; lowest rate.
DSCR
20% down · 8.5% · 30yr
- Down + closing
- —
- Monthly P&I
- —
- Monthly cashflow
- —
- DSCR
- —
- Eligible?
- —
No personal income docs; deal must DSCR.
Hard money
10% down · 12.0% · 12mo
- Down + closing
- —
- Monthly P&I
- —
- Monthly cashflow
- —
- DSCR
- —
- Eligible?
- —
Short-term bridge; refi at stabilization.
Rent comps 15 comps
| Address | Beds | Baths | Sqft | Rent | $/sqft | DOM | Units | Dist |
|---|---|---|---|---|---|---|---|---|
| 3101 Boardwalk Unit 1110-2 Atlantic City, NJ | 1.0 | 1.5 | 872 | $14,500 | $16.63 | 21d | 1 | 0.06mi |
| 2834 Atlantic Ave Atlantic City, NJ | 1.0 | 1.0 | 639 | $1,675 | $2.62 | 21d | 3 | 0.25mi |
| 2834 Atlantic Ave Atlantic City, NJ | 1.0 | 1.0 | 823 | $1,688 | $2.05 | 13d | 3 | 0.25mi |
| 38 N Boston Ave Unit B Atlantic City, NJ | 2.0 | 2.0 | 800 | $2,400 | $3.00 | 13d | 1 | 0.33mi |
| 3813 Atlantic Ave Unit 1309001P Atlantic City, NJ | 1.0 | 2.0 | 592 | $4,333 | $7.32 | 13d | 1 | 0.42mi |
| 108 Lincoln Pl Apt A4 Atlantic City, NJ | 2.0 | 1.0 | 800 | $5,000 | $6.25 | 21d | 1 | 0.42mi |
| 3851 Boardwalk Atlantic City, NJ | 2.0 | 1.0–2.0 | 785 | $19,700 | $25.10 | 21d | 5 | 0.42mi |
| 21 S Windsor Ave Unit b1 Atlantic City, NJ | 2.0 | 1.0 | 640 | $1,650 | $2.58 | 13d | 1 | 0.61mi |
| 101 S Raleigh Ave Atlantic City, NJ | 2.0 | 1.0 | 735 | $10,125 | $13.78 | 13d | 7 | 0.67mi |
| 1724 Atlantic Ave Unit B2 Atlantic City, NJ | 2.0 | 1.0 | 750 | $1,495 | $1.99 | 21d | 1 | 1.04mi |
| 1710 Atlantic Ave Apt A Atlantic City, NJ | 2.0 | 1.0 | 600 | $4,500 | $7.50 | 21d | 1 | 1.06mi |
| 5101 Ventnor Ave Unit 2 Ventnor City, NJ | 2.0 | 1.0 | 1000 | $1,950 | $1.95 | 13d | 1 | 1.26mi |
| 5200 Boardwalk Unit 10A Ventnor City, NJ | 1.0 | 2.0 | 1104 | $21,000 | $19.02 | 13d | 1 | 1.32mi |
| 23 S Little Rock Ave Unit 2 Ventnor City, NJ | 2.0 | 2.0 | 1000 | $2,500 | $2.50 | 43d | 1 | 1.36mi |
| 101 S Victoria Ave Unit B1 Ventnor City, NJ | 1.0 | 1.0 | 550 | $2,100 | $3.82 | 13d | 1 | 1.39mi |
HOA detail condo
- Monthly dues
- $394 · $4,728/yr
- Assessments
- None detected in remarks — confirm with the listing agent.
Listing history 16 events
-
2026-06-19days on market $219,000 Active 78 DOM
-
2026-06-18days on market $219,000 Active 77 DOM
-
2026-06-17days on market $219,000 Active 76 DOM
-
2026-06-16days on market $219,000 Active 75 DOM
-
2026-06-15days on market $219,000 Active 74 DOM
-
2026-06-14days on market $219,000 Active 72 DOM
-
2026-06-13days on market $219,000 Active 71 DOM
-
2026-06-10days on market $219,000 Active 69 DOM
-
2026-06-09days on market $219,000 Active 68 DOM
-
2026-06-08days on market $219,000 Active 67 DOM
-
2026-06-07days on market $219,000 Active 66 DOM
-
2026-06-02days on market $219,000 Active 61 DOM
-
2026-06-01days on market $219,000 Active 60 DOM
-
2026-05-31days on market $219,000 Active 59 DOM
-
2026-05-30days on market $219,000 Active 58 DOM
-
2026-04-02$219,000 Active
ⓘ Source: listings_history table (triggers on properties + properties_extension) + one-shot
backfill from property_details.listing_events for pre-trigger history.
Nearby sold comps map
Loading sold comps map…
Walkable amenities ~0.75 mi
Loading nearby amenities…
Taxation est. · year 1
- Rental income
- $28,682
- − Mortgage interest
- −$12,267
- − Property taxes
- −$3,285
- − Insurance
- −$1,095
- − Repairs & maintenance
- −$2,295
- − Management
- −$2,295
- − HOA
- −$4,728
- − Depreciation
- −$6,371
- Taxable loss
- −$3,653
- Est. tax savings @ 24.0%
- +$877
- After-tax cash flow
- $646/yr
For passive investors: Depreciation is non-cash, so a rental often shows a tax loss while cash-flowing — sheltering income. Rental losses are passive: they offset passive income freely, and up to $25,000/yr can offset ordinary (W-2) income if you actively participate and your MAGI is under $100k (phasing out to $0 by $150k); unused losses carry forward. On sale, claimed depreciation is recaptured at up to 25%, and gains may owe capital-gains tax (a 1031 exchange can defer both). Figures are a year-1 estimate at your 24.0% rate — not tax advice; consult a CPA.
Condition & rehab AI · 12 photos
This well-maintained, oceanfront condo is in good condition with a good view and a good location. It has some cosmetic updates needed to modernize the kitchen and bathroom.
Repairs flagged
- Minor kitchen cabinets — dated design
- Minor bathroom fixtures — dated design
- Minor kitchen appliances — functional but dated
Value-add opportunities
- Both update kitchen cabinets and appliances — modernizing kitchen will appeal to buyers and renters
- Both update bathroom fixtures — modernizing bathroom will appeal to buyers and renters
- Both paint interior walls — fresh paint will improve curb appeal and interior aesthetics
- Both replace carpeting — new carpet will improve comfort and curb appeal
Renovation cost estimate screening
| Repair item | Severity | Est. cost |
|---|---|---|
| kitchen cabinets · dated design | Minor | $500–3,000 |
| bathroom fixtures · dated design | Minor | $500–3,000 |
| kitchen appliances · functional but dated | Minor | $500–3,000 |
| Total estimated repair cost · 3 items | $1,500–9,000 |
Value-add ROI direction
- Both update kitchen cabinets and appliances — modernizing kitchen will appeal to buyers and renters ↑
- Both update bathroom fixtures — modernizing bathroom will appeal to buyers and renters ↑
- Both paint interior walls — fresh paint will improve curb appeal and interior aesthetics ↑
- Both replace carpeting — new carpet will improve comfort and curb appeal ↑
ⓘ Cost ranges are severity-bucket heuristics (US national rule-of-thumb). Get contractor quotes + a written scope before underwriting a rehab budget.
Schools (NCES district)
- District
- Atlantic City School District
- NCES district ID
- 3400960
- Math proficiency
- 9% ▼ -12.00%
- Reading proficiency
- 26% ▼ -6.00%
- Median HH income
- $27,842
- Composite
- 13.66/100
- National rank
- #9504
- State rank
- #454 of 472 in NJ
Livability — Atlantic City
- Score
- 55/100
- State rank
- #525
- US rank
- #23095
Category grades
Schools grade is shown separately in the Schools card above.
Census & demographics
- Census place
- Atlantic City, NJ
- County
- Atlantic County · 143,611 people
- City population
- 38,925
- Metro
- Atlantic City-Hammonton, NJ
- Population (ZIP)
- 38,925
- Household income
- $41,126
- Rent vs Own
- Severe rent burden
- 3414.0
Population outlook (Atlantic County) Hauer SSP2
- Today (2025)
- 268,948 people
- By 2030
- 264,497 · -1.7%
- By 2040
- 252,261 · -6.2%
- By 2050
- 237,846 · -11.6%
- By 2075
- 210,650 · -21.7%
- By 2100
- 180,234 · -33.0%
Race, ethnicity, and origin ACS 2023
- Neighborhood character
- Highly diverse neighborhood (Simpson 0.75)
- Race & ethnicity
- Hispanic / Latino 32% Black 32% Asian 16% White 16% Two or more races 11% Native American 2%
- Hispanic origin (detail)
- Mexican 10% Puerto Rican 8% Dominican 8%
- Common ancestry
- Romanian 1% Scotch-Irish 1%
- Foreign-born
- 29% · Canada, Vietnam, Jamaica
- Languages at home
- 52% English-only · Spanish 30% Other Indo-European 8% Vietnamese 3%
Political lean MEDSL · Atlantic
- 2024 margin
- Toss-up / Even · D 47.7% · R 50.7% · Other 1.6%
- 2008→2024 swing
- -18.1pp toward R · 2008: 15.1pp · 2024: -3.0pp
- All cycles
- 2024: R+3.0 2020: D+6.7 2016: D+6.2 2012: D+17.2 2008: D+15.1
Not yet ingested
- Civics
- —
Market trends
- HPI YoY
- ▼ -26.82%
- Current HPI
- 353.7827
- Rent YoY
- ▲ 5.52%
- Metro
- Atlantic City-Hammonton, NJ
- State GDP YoY
- ▲ 2.05%
- F500 in state
- 34
Industry mix (Fortune 500 HQ in NJ)
| Industry | F500 HQs | Revenue |
|---|---|---|
| Consumer Goods | 3 | $31B |
|
||
| Pharmaceuticals | 2 | $153B |
|
||
| Technology | 2 | $21B |
|
||
| Insurance | 2 | $20B |
|
||
| Healthcare | 2 | $19B |
|
||
| Financial Services | 1 | $70B |
|
||
Price history
1 event — show timeline
- 2026-04-02 Listed $219,000 BRIGHT MLS
Cash-flow waterfall
monthlySold comps — $/sqft
last 12 mo · ≤1 miLoading sold comps…