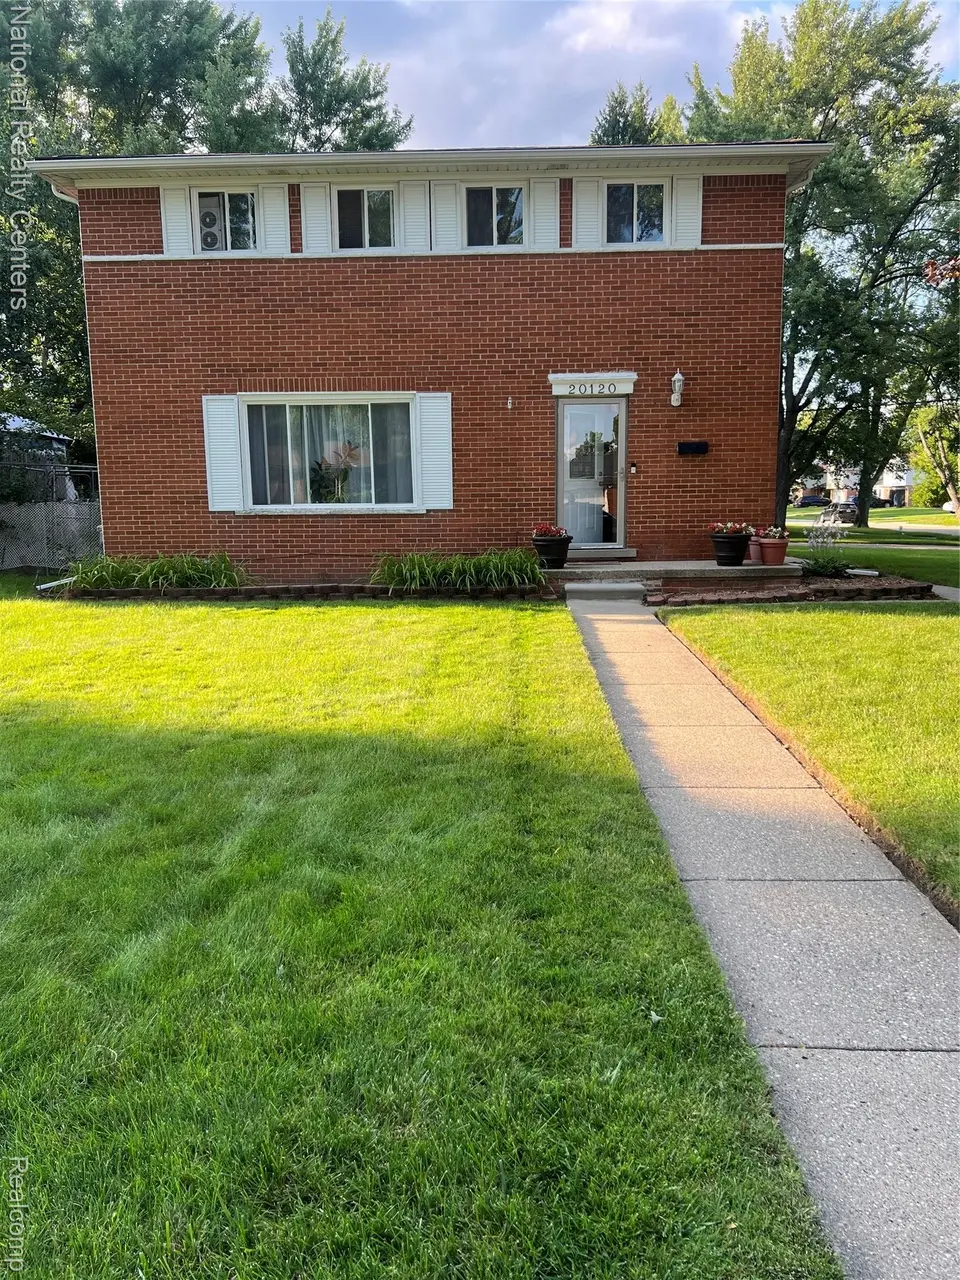
20120 N Covington Pkwy · Southfield, MI
Flood risk 1/10 · Minimal
- FEMA flood zone
- X (unshaded)
- Chance of flooding over 30 yrs
- 0.0%
- Est. flood insurance / yr
- $473 – $860
Fire risk 1/10 · Minimal
- Est. fire insurance / yr
- $784 – $1,456
Heat risk 2/10 · Minimal
- Hot days now (above 98°F)
- 7 days/yr
- Hot days in 30 yrs
- 14 days/yr
Wind risk 2/10 · Minimal
- Chance of severe wind over 30 yrs
- —
Air-quality risk 4/10 · Minor
- Unhealthy air days now
- 3 days/yr
- Unhealthy air days in 30 yrs
- 6 days/yr
Risk factors via First Street. Map © Google.
Why this score? — see what drove the D grade
The composite is a weighted blend of 9 inputs, each scored 0–100. Each bar is that input's sub-score; the figure is the points it added to the 100-point composite (weight × sub-score).
- Cash flow +12.8/30.0
- ARV discount +11.4/15.0
- DSCR +3.8/10.0
- Rent growth +3.7/5.0
- 1% rule +3.6/10.0
- Livability +3.6/5.0
- Condition / age +2.5/5.0
- Schools +2.4/10.0
- Appreciation +0.0/10.0
$285,000
🖨 Deal sheet (PDF) 📄 Offer letter ✓ Due diligence
Listing remarks MLS
Welcome Home. .. This home boasts natural hardwood floors throughout, newer windows with a 35-year warranty, a new water heater and furnace, a leaf filter guard system, a New entry and security door, a large master suite with a walk-in closet, and a newly updated bathroom. This home resides in a vibrant community surrounding so much! This captivating area in Southfield, MI, is known for its friendly atmosphere and strong sense of community. Residents enjoy access to a variety of amenities, including parks, recreational facilities, and shopping centers that cater to diverse needs and preferences. The neighborhood is well-connected with convenient access to major highways, making commuting to nearby cities effortless. Families will appreciate the top-rated schools and ample opportunities for outdoor activities. Whether you're seeking the tranquility of suburban living or the excitement of nearby urban attractions, this location provides the perfect balance.
Key facts
- Water heater
- Newer windows
- Furnace
Tags
Neighborhood map
What this means for you Summary
Snapshot
- This is a 4-bed/1.5-bath single-family listed at $285k.
Deal economics
- At list price, monthly cash flow is $-27 ($-326/yr) — negative.
- To cash-flow at today's rent, offer at most $280k (1.7% below list).
- To meet the 1% rule (rent ≥ 1% of price), the offer needs to be $244k (14.4% below list).
- Recommended offer: $244k (14.4% below list) — sets the bar for 1% rule.
- Cap rate 6.2% vs local median 4.6% in Southfield — top-decile yield for the area; either an underpriced asset or a hidden risk that comps aren't pricing in. Stress-test before assuming the spread holds.
Location & tenants
- Location reads 72/100 on livability (#248 in MI) — a middle-class / working-renter tenant base. Strengths: commute A+, cost of living A+, housing A+; Watch: schools D, health & safety D, crime F.
- Southfield Public School District (urban): math 17% / reading 37% proficiency, ranked #392 of 540 in MI (top 73%) — low school quality limits family demand, transient renter base, plan for 1-2y turnover.
- Market conditions: Rents rising fast (+4.8%/yr); 96 active listings in the ZIP; 7 comparable units currently listed for rent nearby; rentals at typical pace (median 19d on market — plan ~3-4 weeks tenant-placement turnaround); solid renter incomes; 2,614 units permitted in Oakland County in 2024 (721 in 5+ unit buildings).
- This rent runs 32% of the median local income ($90k/yr) — at the standard rent-burdened threshold; future hikes will face affordability resistance.
Forward outlook
- Local home prices are declining (-3.0%/yr); year-one equity from $2k of loan paydown is wiped out by about $9k of value loss. Plan a longer hold.
- Oakland County population projected at +10% by 2050 — modest demand growth; plan on rents tracking national, not racing it.
Negotiation context
- It's been on market 362 days — a 12% lower offer ($251k) is reasonable based on typical stale-listing flexibility.
- 9 sale attempts since 11y ago with the ask held roughly flat each time — persistent listings suggest the price (not the market) is what's stuck; bring a comps-based counter.
- Current owner paid $155k; list at $285k implies a 84% gain — meaningful room to come down on a strong offer.
Questions for the listing agent
- What do current leases actually rent for vs. the listed asking? Can we see a recent rent roll and the last 12 months of T-12 income?
- It's been on market 362 days. Have you received any prior offers? Is the seller open to a 14% concession, seller financing, or rate buy-down credit?
- Built in 1961 — when were the roof, HVAC, electrical panel, plumbing, and water heater last replaced?
- Why hasn't it sold? Are there any deal-killer items the seller is aware of (foundation, flood, title, zoning, code violations)?
- Is there a deadline driving the sale (1031 exchange, divorce, estate, relocation)? That informs how much negotiation room exists.
- Schools are D-rated, which usually means shorter tenancies and higher turnover. Who's the typical renter profile here, and what's been the actual vacancy rate?
- Crime grade is F in this area — have there been break-ins, vandalism, or insurance claims at this property in the last 3 years? What carrier currently insures it and at what premium?
- The area grade is low — what's the realistic commute time and amenity access for the typical tenant pool here? Any planned neighborhood developments (good or bad) we should know about?
- What's the average days-on-market for RENTAL listings here right now (not sales)? A rising rental-DOM trend means longer vacancies and softer asking-rent achievability than the comps imply.
- What's the recent tenant-quality profile in this submarket — average credit score on applications, eviction rate, late-payment / NSF rate, and stable-employment percentage? A property-management company in the area should have these aggregated.
- How much new for-sale + rental construction is in the pipeline within 1–3 miles? Heavy new supply typically softens prices + rents 12–24 months out; constrained supply supports both.
Investment metrics
- 1% rule
- 0.86% ✗
- Cap rate
- 6.18%
- Cash-on-cash
- -0.41%
- DSCR
- 0.98
- GRM
- 9.7
CMA / ARV
- ARV (median comp)
- $311,745
- List price
- $285,000
- Delta
- -8.58%
- Verdict
- FAIR
- Comps
- 20 within 1.0 mi
Show comp detail 12 sales within ~0.75 mi
| Address | Dist | Beds/Ba | Sqft | Sold | Price | $/sf | Match |
|---|---|---|---|---|---|---|---|
| 28375 Ranchwood Dr | 0.30mi | 4/2.0 | 1,508 (-7%) | 2mo | $339,900 | $225 | 71 |
| 28432 Fontana Dr | 0.08mi | 3/1.5 (-1) | 1,586 (-2%) | 20mo | $278,000 | $175 | 71 |
| 28170 Fontana Dr | 0.06mi | 3/1.5 (-1) | 1,769 (+9%) | 16mo | $313,000 | $177 | 63 |
| 27625 Berkshire Dr | 0.34mi | 3/2.5 (-1) | 1,609 (-1%) | 14mo | $335,000 | $208 | 62 |
| 20081 Alhambra St | 0.25mi | 3/2.5 (-1) | 1,624 (+0%) | 22mo | $320,000 | $197 | 61 |
| 28625 Ranchwood Dr | 0.35mi | 3/1.5 (-1) | 1,484 (-8%) | 12mo | $369,900 | $249 | 54 |
| 19085 Dolores Ave | 0.49mi | 3/1.5 (-1) | 1,688 (+4%) | 20mo | $310,000 | $184 | 49 |
| 21377 Concord St | 0.72mi | 3/2.5 (-1) | 1,858 (+15%) | 0mo | $283,000 | $152 | 32 |
| 27046 Charles Dr | 0.73mi | 4/2.5 | 1,837 (+13%) | 12mo | $375,000 | $204 | 29 |
| 18755 Saratoga Blvd | 0.69mi | 4/2.5 | 1,861 (+15%) | 15mo | $370,000 | $199 | 26 |
| 29255 Westbrook Pkwy | 0.68mi | 3/1.5 (-1) | 1,841 (+14%) | 17mo | $311,000 | $169 | 26 |
| 19810 Northbrook Dr | 0.71mi | 3/2.0 (-1) | 1,844 (+14%) | 15mo | $320,000 | $174 | 24 |
Match score weights: distance 35% · size 25% · config 20% · recency 20%. Top-matched comps best support the ARV.
Projected returns pro-forma
-3.0% appreciation · 4.84% rent growth · sell at horizon
- IRR
- -14.9%
- Equity multiple
- 0.46×
- Total profit
- $-43,287
- Equity at exit
- $42,494
- IRR
- -3.5%
- Equity multiple
- 0.75×
- Total profit
- $-20,221
- Equity at exit
- $24,642
Cash invested: $79,800 (down + closing). Projections, not guarantees.
Landlord ↔ Tenant lean methodology
- Overall (STATE)
- 62 Landlord-Friendly
- State Michigan
- 62 Landlord-Friendly · EVEN
- County
- — inherits STATE
- City
- — inherits STATE
ZIP-level market 48076
- Rents YoY
- 4.8%
- Active inventory
- 96
- Price-to-rent
- 9.7×
Monthly cashflow live
- Estimated rent
- $2,439 high interval (Pro) →
- Mortgage (P&I)
- −$1,495
- Tax from tax record
- −$340 /mo · $4,085/yr
- Insurance
- −$119
- HOA
- −$0
- Vacancy / Maint / Mgmt
- −$512
- Net cashflow
- $-27
Break-even live
Sensitivity live
| Price | -10% $134 | -5% $54 | +0% $-27 | +5% $-108 | +10% $-188 |
|---|---|---|---|---|---|
| Rent | -10% $-220 | -5% $-123 | +0% $-27 | +5% $69 | +10% $166 |
| Rate | -1.0pp $116 | -0.5pp $45 | base $-27 | +0.5pp $-101 | +1.0pp $-176 |
UW: 25.0% down · 7.5% · 30yr · 1.5% tax · 5.0% vac · 8.0% maint · 8.0% mgmt
Financing live
Cash to close
- Down payment
- $71,250
- Closing costs
- $8,550
- Reserves months
- —
- Total cash needed
- —
Loan-product check · same deal, 3 products live
Conventional
25% down · 7.5% · 30yr
- Down + closing
- —
- Monthly P&I
- —
- Monthly cashflow
- —
- DSCR
- —
- Eligible?
- —
Personal DTI + credit; lowest rate.
DSCR
20% down · 8.5% · 30yr
- Down + closing
- —
- Monthly P&I
- —
- Monthly cashflow
- —
- DSCR
- —
- Eligible?
- —
No personal income docs; deal must DSCR.
Hard money
10% down · 12.0% · 12mo
- Down + closing
- —
- Monthly P&I
- —
- Monthly cashflow
- —
- DSCR
- —
- Eligible?
- —
Short-term bridge; refi at stabilization.
Rent comps 7 comps
| Address | Beds | Baths | Sqft | Rent | $/sqft | DOM | Units | Dist |
|---|---|---|---|---|---|---|---|---|
| 20800 Knob Woods Dr Southfield, MI | 1.0–3.0 | 1.0–2.5 | 1625 | $2,515 | $1.55 | 0d | 9 | 0.87mi |
| 18175 Avilla Blvd Lathrup Village, MI | 3.0 | 1.5 | 1531 | $2,300 | $1.50 | 45d | 1 | 0.98mi |
| 20300 Civic Center Dr Southfield, MI | 4.0 | 1.0–2.0 | 1200 | $2,215 | $1.85 | 0d | 14 | 1.04mi |
| 25582 Saint James Southfield, MI | 3.0 | 2.5 | 1539 | $2,550 | $1.66 | 1d | 1 | 1.30mi |
| 25582 Saint James Southfield, MI | 3.0 | 2.5 | 1539 | $2,600 | $1.69 | 23d | 1 | 1.30mi |
| 25582 Saint James Southfield, MI | 3.0 | 2.5 | 1539 | $2,600 | $1.69 | 26d | 1 | 1.30mi |
| 28051 Stuart Ave Southfield, MI | 3.0 | 1.5 | 1441 | $2,000 | $1.39 | 18d | 1 | 1.45mi |
Listing history 40 events
-
2026-06-21days on market $285,000 Active 362 DOM
-
2026-06-18days on market $285,000 Active 359 DOM
-
2026-06-17days on market $285,000 Active 358 DOM
-
2026-06-16days on market $285,000 Active 357 DOM
-
2026-06-15days on market $285,000 Active 356 DOM
-
2026-06-13days on market $285,000 Active 354 DOM
-
2026-06-13days on market $285,000 Active 353 DOM
-
2026-06-09days on market $285,000 Active 350 DOM
-
2026-06-08days on market $285,000 Active 349 DOM
-
2026-06-07days on market $285,000 Active 348 DOM
-
2026-06-04days on market $285,000 Active 345 DOM
-
2026-06-03days on market $285,000 Active 344 DOM
-
2026-06-02days on market $285,000 Active 343 DOM
-
2026-06-01days on market $285,000 Active 342 DOM
-
2026-05-31days on market $285,000 Active 341 DOM
-
2025-06-24$285,000 Active 969-char remark
Show marketing remark (969 chars)
Welcome Home. .. This home boasts natural hardwood floors throughout, newer windows with a 35-year warranty, a new water heater and furnace, a leaf filter guard system, a New entry and security door, a large master suite with a walk-in closet, and a newly updated bathroom. This home resides in a vibrant community surrounding so much! This captivating area in Southfield, MI, is known for its friendly atmosphere and strong sense of community. Residents enjoy access to a variety of amenities, including parks, recreational facilities, and shopping centers that cater to diverse needs and preferences. The neighborhood is well-connected with convenient access to major highways, making commuting to nearby cities effortless. Families will appreciate the top-rated schools and ample opportunities for outdoor activities. Whether you're seeking the tranquility of suburban living or the excitement of nearby urban attractions, this location provides the perfect balance.
-
2025-06-20$285,000 Active 969-char remark
Show marketing remark (969 chars)
Welcome Home. .. This home boasts natural hardwood floors throughout, newer windows with a 35-year warranty, a new water heater and furnace, a leaf filter guard system, a New entry and security door, a large master suite with a walk-in closet, and a newly updated bathroom. This home resides in a vibrant community surrounding so much! This captivating area in Southfield, MI, is known for its friendly atmosphere and strong sense of community. Residents enjoy access to a variety of amenities, including parks, recreational facilities, and shopping centers that cater to diverse needs and preferences. The neighborhood is well-connected with convenient access to major highways, making commuting to nearby cities effortless. Families will appreciate the top-rated schools and ample opportunities for outdoor activities. Whether you're seeking the tranquility of suburban living or the excitement of nearby urban attractions, this location provides the perfect balance.
-
2024-04-12historical
-
2024-04-12historical
-
2024-02-17price $285,000
-
2024-02-16price $285,000
-
2024-01-17$299,500 Active
-
2024-01-17$285,000
-
2015-12-18soldstatus $155,000
-
2015-12-16soldstatus $155,000 Sold
-
2015-12-11soldstatus $155,000
-
2015-10-20historical
-
2015-10-15historical
-
2015-10-09status Active
-
2015-09-28historical
-
2015-09-18$158,800 Active
-
2015-09-18$158,800
-
2015-04-02price $84,900
-
2015-03-27soldstatus $71,980 Sold
-
2015-03-27soldstatus $71,980
-
2015-03-12historical
-
2015-03-12historical
-
2015-02-07$89,900 Active
-
2015-02-05$84,900
-
1994-07-26soldstatus $105,000
ⓘ Source: listings_history table (triggers on properties + properties_extension) + one-shot
backfill from property_details.listing_events for pre-trigger history.
Tax reassessment forecast MI · Partial reset (capped growth)
- Current annual tax
- $4,085 · $340/mo
- Projected year-2 tax
- $4,237 · $353/mo
- Expected delta
- +$152/yr (+$13/mo · 3.7%)
ⓘ Screening estimate from a state-policy table — verify with the county assessor before closing.
Climate risk First Street
- Flood 1/10 Low FEMA zone X (unshaded) · 0% chance over 30 yrs
- Wildfire 1/10 Low
- Heat 2/10 Low 7 d/yr ≥98°F today · 14 d/yr by 30 yrs out
- Wind 2/10 Low
- Air quality 4/10 Moderate 3 unhealthy d/yr today · 6 by 30 yrs out
Nearby sold comps map
Loading sold comps map…
Walkable amenities ~0.75 mi
Loading nearby amenities…
Taxation est. · year 1
- Rental income
- $29,265
- − Mortgage interest
- −$15,964
- − Property taxes
- −$4,085
- − Insurance
- −$1,425
- − Repairs & maintenance
- −$2,341
- − Management
- −$2,341
- − Depreciation
- −$8,291
- Taxable loss
- −$5,183
- Est. tax savings @ 24.0%
- +$1,244
- After-tax cash flow
- $918/yr
For passive investors: Depreciation is non-cash, so a rental often shows a tax loss while cash-flowing — sheltering income. Rental losses are passive: they offset passive income freely, and up to $25,000/yr can offset ordinary (W-2) income if you actively participate and your MAGI is under $100k (phasing out to $0 by $150k); unused losses carry forward. On sale, claimed depreciation is recaptured at up to 25%, and gains may owe capital-gains tax (a 1031 exchange can defer both). Figures are a year-1 estimate at your 24.0% rate — not tax advice; consult a CPA.
Schools (NCES district)
- District
- Southfield Public School District
- NCES district ID
- 2632310
- Math proficiency
- 17% ▼ -3.00%
- Reading proficiency
- 37% ▲ 1.00%
- Median HH income
- $51,400
- Composite
- 23.77/100
- National rank
- #7814
- State rank
- #392 of 540 in MI
Livability — Southfield
- Score
- 72/100
- State rank
- #248
- US rank
- #6175
Category grades
Schools grade is shown separately in the Schools card above.
Census & demographics
- Census place
- Southfield, MI
- County
- Oakland County · 1,009,092 people
- City population
- 54,914
- Metro
- Detroit-Warren-Dearborn, MI
- Population (ZIP)
- 25,405
- Household income
- $90,058
- Rent vs Own
- Severe rent burden
- 607.0
Population outlook (Oakland County) Hauer SSP2
- Today (2025)
- 1,335,747 people
- By 2030
- 1,375,100 · +2.9%
- By 2040
- 1,435,385 · +7.5%
- By 2050
- 1,469,250 · +10.0%
- By 2075
- 1,531,946 · +14.7%
- By 2100
- 1,450,485 · +8.6%
Race, ethnicity, and origin ACS 2023
- Neighborhood character
- Diverse neighborhood (Simpson 0.57)
- Race & ethnicity
- Black 57% White 32% Two or more races 7% Hispanic / Latino 3% Asian 2%
- Common ancestry
- Romanian 3% Slovak 1% Scotch-Irish 1%
- Foreign-born
- 8% · Canada, Vietnam
- Languages at home
- 90% English-only · Spanish 3% Arabic 2% Russian/Polish/Slavic 1%
Political lean MEDSL · Oakland
- 2024 margin
- D (+10.6) · D 54.4% · R 43.8% · Other 1.9%
- 2008→2024 swing
- -3.9pp toward R · 2008: 14.5pp · 2024: 10.6pp
- All cycles
- 2024: D+10.6 2020: D+14.1 2016: D+8.1 2012: D+8.1 2008: D+14.5
Not yet ingested
- Civics
- —
Market trends
- HPI YoY
- ▼ -192.13%
- Current HPI
- 229.2304
- Rent YoY
- ▲ 4.84%
- Metro
- Detroit-Warren-Dearborn, MI
- State GDP YoY
- ▲ 1.37%
- F500 in state
- 28
Industry mix (Fortune 500 HQ in MI)
| Industry | F500 HQs | Revenue |
|---|---|---|
| Automotive Parts | 3 | $48B |
|
||
| Automotive | 2 | $372B |
|
||
| Chemicals | 1 | $45B |
|
||
| Automotive Retail | 1 | $29B |
|
||
| Healthcare / Medical Devices | 1 | $23B |
|
||
| Automotive Technology | 1 | $20B |
|
||
Price history
+171.4% since first listed25 events — show timeline
- 2025-06-24 Listed $285,000 REALCOMP
- 2025-06-20 Listed $285,000 MiRealSource-MiMLS
- 2024-04-12 Listing Removed — MiRealSource-MiMLS
- 2024-04-12 Listing Removed — REALCOMP
- 2024-02-17 Price Changed $285,000 REALCOMP
- 2024-02-16 Price Changed $285,000 SW Michigan MLS
- 2024-01-17 Listed $285,000 MiRealSource-MiMLS
- 2024-01-17 Listed $299,500 REALCOMP
- 2015-12-18 Sold (Public Records) $155,000 Public Records
- 2015-12-16 Sold (MLS) $155,000 REALCOMP
- 2015-12-11 Sold (MLS) $155,000 MiRealSource-MiMLS
- 2015-10-20 Listing Removed — REALCOMP
- 2015-10-15 Listing Removed — MiRealSource-MiMLS
- 2015-10-09 Relisted — REALCOMP
- 2015-09-28 Listing Removed — REALCOMP
- 2015-09-18 Listed $158,800 REALCOMP
- 2015-09-18 Listed $158,800 MiRealSource-MiMLS
- 2015-04-02 Price Changed $84,900 REALCOMP
- 2015-03-27 Sold (MLS) $71,980 MiRealSource-MiMLS
- 2015-03-27 Sold (MLS) $71,980 REALCOMP
- 2015-03-12 Listing Removed — REALCOMP
- 2015-03-12 Listing Removed — MiRealSource-MiMLS
- 2015-02-07 Listed $89,900 REALCOMP
- 2015-02-05 Listed $84,900 MiRealSource-MiMLS
- 1994-07-26 Sold (Public Records) $105,000 Public Records
Property tax history
+1.8%/yrLatest (2025): $4,085 · -13.9% YoY. Source: county tax records.
Cash-flow waterfall
monthlySold comps — $/sqft
last 12 mo · ≤1 miLoading sold comps…