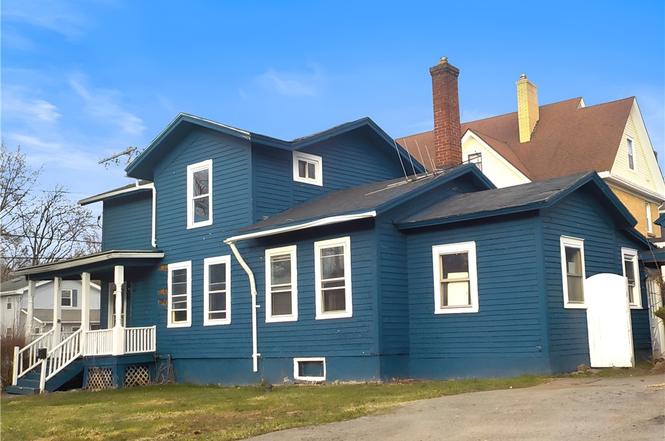
101 W Academy St · Albion, NY
Flood risk 1/10 · Minimal
- FEMA flood zone
- X
- Chance of flooding over 30 yrs
- 0.0%
- Est. flood insurance / yr
- $473 – $860
Fire risk 1/10 · Minimal
- Est. fire insurance / yr
- $691 – $1,283
Heat risk 2/10 · Minimal
- Hot days now (above 96°F)
- 7 days/yr
- Hot days in 30 yrs
- 15 days/yr
Wind risk 1/10 · Minimal
- Chance of severe wind over 30 yrs
- —
Air-quality risk 2/10 · Minimal
- Unhealthy air days now
- 1 days/yr
- Unhealthy air days in 30 yrs
- 2 days/yr
Risk factors via First Street. Map © Google.
Why this score? — see what drove the B- grade
The composite is a weighted blend of 9 inputs, each scored 0–100. Each bar is that input's sub-score; the figure is the points it added to the 100-point composite (weight × sub-score).
- Cash flow +30.0/30.0
- 1% rule +10.0/10.0
- DSCR +10.0/10.0
- ARV discount +7.5/15.0
- Schools +3.7/10.0
- Livability +3.0/5.0
- Rent growth +2.5/5.0
- Condition / age +2.5/5.0
- Appreciation +0.0/10.0
$57,500
🖨 Deal sheet (PDF) 📄 Offer letter ✓ Due diligence
Listing remarks
Welcome to your next exciting project in the Village of Albion! This colonial style home has so much potential. It features either 2 or 3 bedrooms depending on your choice of the floorplan. The layout provides ample space to craft the perfect sanctuary tailored just for you. The possible 3rd bedroom could be on the 1st floor or a family room whichever you desire. The detached single-car garage provides an additional storage solutions. While this property does need your personal touch, it has many possibilities to transform into your home or great investment. Convenient Village location with access to local amenities including shops, parks, and schools.
Key facts
- Colonial style home
- Village location
- 4,356 sq ft lot
Tags
Neighborhood map
What this means for you Summary
Snapshot
- This is a 2-bed/1.0-bath single-family listed at $58k.
Deal economics
- At list price, monthly cash flow is $630 ($8k/yr) — positive.
- The deal already cash-flows at list — no discount required.
- Meets the 1% rule at list price ($1k rent vs $58k).
- Recommended offer: $56k (3.0% below list) — sets the bar for market timing.
- Cap rate 19.4% vs local median 4.1% in Albion — top-decile yield for the area; either an underpriced asset or a hidden risk that comps aren't pricing in. Stress-test before assuming the spread holds.
Location & tenants
- Location reads 59/100 on livability (#1,009 in NY) — a working-class tenant base; expect higher turnover. Strengths: cost of living A+, housing A-; Watch: schools C-, crime D-, amenities F.
- Albion Central School District (town): math 37% / reading 50% proficiency, ranked #479 of 590 in NY (top 81%) — families likely to look elsewhere, expect single-tenant / working-renter base with shorter leases.
- Market conditions: 44 active listings in the ZIP; 1 comparable units currently listed for rent nearby; 28 units permitted in Orleans County in 2024 (0 in 5+ unit buildings).
Forward outlook
- Local home prices are declining (-3.0%/yr); year-one equity from $398 of loan paydown is wiped out by about $2k of value loss. Plan a longer hold.
- Orleans County population projected at -20% by 2050 — secular population decline; favor cash flow + early exit over multi-decade hold.
- At projected returns (-3.0% appreciation + 3.0% rent growth), your $16k cash investment doubles in ~3 years — after that, you're playing with house money.
Negotiation context
- It's been on market 42 days — a 3% lower offer ($56k) is reasonable based on typical stale-listing flexibility.
Risks & watch-outs
- Watch-outs: built in 1850 — expect roof / HVAC / electrical / plumbing capex.
Questions for the listing agent
- It's been on market 42 days. Have you received any prior offers? Is the seller open to a 3% concession, seller financing, or rate buy-down credit?
- Built in 1850 — when were the roof, HVAC, electrical panel, plumbing, and water heater last replaced?
- Is there a deadline driving the sale (1031 exchange, divorce, estate, relocation)? That informs how much negotiation room exists.
- Crime grade is D in this area — have there been break-ins, vandalism, or insurance claims at this property in the last 3 years? What carrier currently insures it and at what premium?
- What's the average days-on-market for RENTAL listings here right now (not sales)? A rising rental-DOM trend means longer vacancies and softer asking-rent achievability than the comps imply.
- What's the recent tenant-quality profile in this submarket — average credit score on applications, eviction rate, late-payment / NSF rate, and stable-employment percentage? A property-management company in the area should have these aggregated.
- How much new for-sale + rental construction is in the pipeline within 1–3 miles? Heavy new supply typically softens prices + rents 12–24 months out; constrained supply supports both.
Investment metrics
- 1% rule
- 2.26% ✓
- Cap rate
- 19.43%
- Cash-on-cash
- 46.93%
- DSCR
- 3.09
- GRM
- 3.7
CMA / ARV
- ARV (on-the-fly)
- $186,099
- Comps found
- 12
Show comp detail 12 sales within ~0.75 mi
| Address | Dist | Beds/Ba | Sqft | Sold | Price | $/sf | Match |
|---|---|---|---|---|---|---|---|
| 117 W Academy St | 0.06mi | 3/1.0 (+1) | 1,348 (-11%) | 2mo | $74,000 | $55 | 73 |
| 110 Beaver St | 0.15mi | 3/1.0 (+1) | 1,657 (+10%) | 4mo | $28,000 | $17 | 69 |
| 246 S Clinton St | 0.46mi | 3/2.0 (+1) | 1,476 (-2%) | 2mo | $228,500 | $155 | 64 |
| 114 S Platt St | 0.32mi | 2/1.5 | 1,310 (-13%) | 6mo | $90,000 | $69 | 56 |
| 20 Hazard Pkwy | 0.52mi | 2/2.0 | 1,548 (+2%) | 16mo | $190,000 | $123 | 54 |
| 127 Mcclelland St St | 0.68mi | 2/1.5 | 1,526 (+1%) | 13mo | $170,000 | $111 | 54 |
| 10 Meadowbrook Dr | 0.54mi | 3/1.5 (+1) | 1,430 (-6%) | 6mo | $240,000 | $168 | 54 |
| 15 North St | 0.66mi | 2/2.0 | 1,464 (-3%) | 13mo | $250,000 | $171 | 49 |
| 118 Herrick St | 0.47mi | 3/2.0 (+1) | 1,624 (+7%) | 10mo | $200,000 | $123 | 48 |
| 219 Allen Rd | 0.74mi | 3/2.0 (+1) | 1,456 (-4%) | 15mo | $196,000 | $135 | 38 |
| 128 Mckinstry St | 0.62mi | 3/1.0 (+1) | 1,331 (-12%) | 12mo | $157,500 | $118 | 36 |
| 108 Mcclelland St | 0.63mi | 3/1.0 (+1) | 1,350 (-11%) | 18mo | $160,000 | $119 | 32 |
Match score weights: distance 35% · size 25% · config 20% · recency 20%. Top-matched comps best support the ARV.
Projected returns pro-forma
-3.0% appreciation · 3.0% rent growth · sell at horizon
- IRR
- 44.3%
- Equity multiple
- 2.91×
- Total profit
- $30,804
- Equity at exit
- $8,573
- IRR
- 50.2%
- Equity multiple
- 5.88×
- Total profit
- $78,540
- Equity at exit
- $4,972
Cash invested: $16,100 (down + closing). Projections, not guarantees.
Landlord ↔ Tenant lean methodology
- Overall (STATE)
- 15 Strongly Tenant-Friendly
- State New York
- 15 Strongly Tenant-Friendly · D+10
- County
- — inherits STATE
- City
- — inherits STATE
ZIP-level market 14411
- Home prices YoY
- -11.6%
- Active inventory
- 44
- Price-to-rent
- 3.7×
Monthly cashflow live
- Estimated rent
- $1,300 medium interval (Pro) →
- Mortgage (P&I)
- −$302
- Tax est. 1.5%
- −$72 /mo · $862/yr
- Insurance
- −$24
- HOA
- −$0
- Vacancy / Maint / Mgmt
- −$273
- Net cashflow
- $630
Break-even live
Sensitivity live
| Price | -10% $669 | -5% $649 | +0% $630 | +5% $610 | +10% $590 |
|---|---|---|---|---|---|
| Rent | -10% $527 | -5% $578 | +0% $630 | +5% $681 | +10% $732 |
| Rate | -1.0pp $659 | -0.5pp $644 | base $630 | +0.5pp $615 | +1.0pp $600 |
UW: 25.0% down · 7.5% · 30yr · 1.5% tax · 5.0% vac · 8.0% maint · 8.0% mgmt
Financing live
Cash to close
- Down payment
- $14,375
- Closing costs
- $1,725
- Reserves months
- —
- Total cash needed
- —
Loan-product check · same deal, 3 products live
Conventional
25% down · 7.5% · 30yr
- Down + closing
- —
- Monthly P&I
- —
- Monthly cashflow
- —
- DSCR
- —
- Eligible?
- —
Personal DTI + credit; lowest rate.
DSCR
20% down · 8.5% · 30yr
- Down + closing
- —
- Monthly P&I
- —
- Monthly cashflow
- —
- DSCR
- —
- Eligible?
- —
No personal income docs; deal must DSCR.
Hard money
10% down · 12.0% · 12mo
- Down + closing
- —
- Monthly P&I
- —
- Monthly cashflow
- —
- DSCR
- —
- Eligible?
- —
Short-term bridge; refi at stabilization.
Rent comps 1 comps
| Address | Beds | Baths | Sqft | Rent | $/sqft | DOM | Units | Dist |
|---|---|---|---|---|---|---|---|---|
| 612 E State St Albion, NY | 3.0 | 1.0 | 1943 | $1,300 | $0.67 | 11d | 1 | 1.26mi |
Listing history 4 events
-
2026-04-24status Pending
-
2026-04-15price $57,500
-
2026-03-11$64,900 Active
-
2004-11-01soldstatus $51,700
ⓘ Source: listings_history table (triggers on properties + properties_extension) + one-shot
backfill from property_details.listing_events for pre-trigger history.
Climate risk First Street
- Flood 1/10 Low FEMA zone X · 0% chance over 30 yrs
- Wildfire 1/10 Low
- Heat 2/10 Low 7 d/yr ≥96°F today · 15 d/yr by 30 yrs out
- Wind 1/10 Low
- Air quality 2/10 Low 1 unhealthy d/yr today · 2 by 30 yrs out
Nearby sold comps map
Loading sold comps map…
Walkable amenities ~0.75 mi
Loading nearby amenities…
Taxation est. · year 1
- Rental income
- $15,600
- − Mortgage interest
- −$3,221
- − Property taxes
- −$862
- − Insurance
- −$288
- − Repairs & maintenance
- −$1,248
- − Management
- −$1,248
- − Depreciation
- −$1,673
- Taxable income
- $7,060
- Est. tax owed @ 24.0%
- −$1,694
- After-tax cash flow
- $5,861/yr
For passive investors: Depreciation is non-cash, so a rental often shows a tax loss while cash-flowing — sheltering income. Rental losses are passive: they offset passive income freely, and up to $25,000/yr can offset ordinary (W-2) income if you actively participate and your MAGI is under $100k (phasing out to $0 by $150k); unused losses carry forward. On sale, claimed depreciation is recaptured at up to 25%, and gains may owe capital-gains tax (a 1031 exchange can defer both). Figures are a year-1 estimate at your 24.0% rate — not tax advice; consult a CPA.
Schools (NCES district)
- District
- Albion Central School District
- NCES district ID
- 3602520
- Math proficiency
- 37% ▼ -15.00%
- Reading proficiency
- 50% ▲ 7.00%
- Median HH income
- $45,408
- Composite
- 36.91/100
- National rank
- #4541
- State rank
- #479 of 590 in NY
Livability — Albion
- Score
- 59/100
- State rank
- #1009
- US rank
- #19661
Category grades
Schools grade is shown separately in the Schools card above.
Census & demographics
- Census place
- Albion, NY
- Population (ZIP)
- 12,479
Population outlook (Orleans County) Hauer SSP2
- Today (2025)
- 39,123 people
- By 2030
- 37,648 · -3.8%
- By 2040
- 34,432 · -12.0%
- By 2050
- 31,487 · -19.5%
- By 2075
- 26,544 · -32.2%
- By 2100
- 22,251 · -43.1%
Race, ethnicity, and origin ACS 2023
- Neighborhood character
- Predominantly White (83%)
- Race & ethnicity
- White 83% Black 9% Hispanic / Latino 5% Two or more races 4%
- Common ancestry
- Romanian 5% Iranian 2% Lithuanian 2%
- Foreign-born
- 2% · Canada, China
- Languages at home
- 95% English-only · Spanish 4% Other Indo-European 1%
Political lean MEDSL · Orleans
- 2024 margin
- Solid R (+40.5) · D 29.8% · R 70.2%
- 2008→2024 swing
- -21.8pp toward R · 2008: -18.7pp · 2024: -40.5pp
- All cycles
- 2024: R+40.5 2020: R+36.0 2016: R+43.4 2012: R+19.4 2008: R+18.7
Not yet ingested
- Civics
- —
Market trends
- HPI YoY
- ▼ -39.68%
- Current HPI
- 302.9236
- Rent YoY
- —
- Metro
- —
- State GDP YoY
- ▲ 2.60%
- F500 in state
- 92
Industry mix (Fortune 500 HQ in NY)
| Industry | F500 HQs | Revenue |
|---|---|---|
| Financial Services | 10 | $950B |
|
||
| Consumer Goods | 9 | $162B |
|
||
| Insurance | 4 | $225B |
|
||
| Telecommunications | 2 | $144B |
|
||
| Pharmaceuticals | 2 | $112B |
|
||
| Media / Entertainment | 2 | $69B |
|
||
Price history
+11.2% since first listed4 events — show timeline
- 2026-04-24 Pending — UNYREIS
- 2026-04-15 Price Changed $57,500 UNYREIS
- 2026-03-11 Listed $64,900 UNYREIS
- 2004-11-01 Sold (Public Records) $51,700 Public Records
Property tax history
+4.5%/yrLatest (2025): $3,332 · +3.2% YoY. Source: county tax records.
Cash-flow waterfall
monthlySold comps — $/sqft
last 12 mo · ≤1 miLoading sold comps…