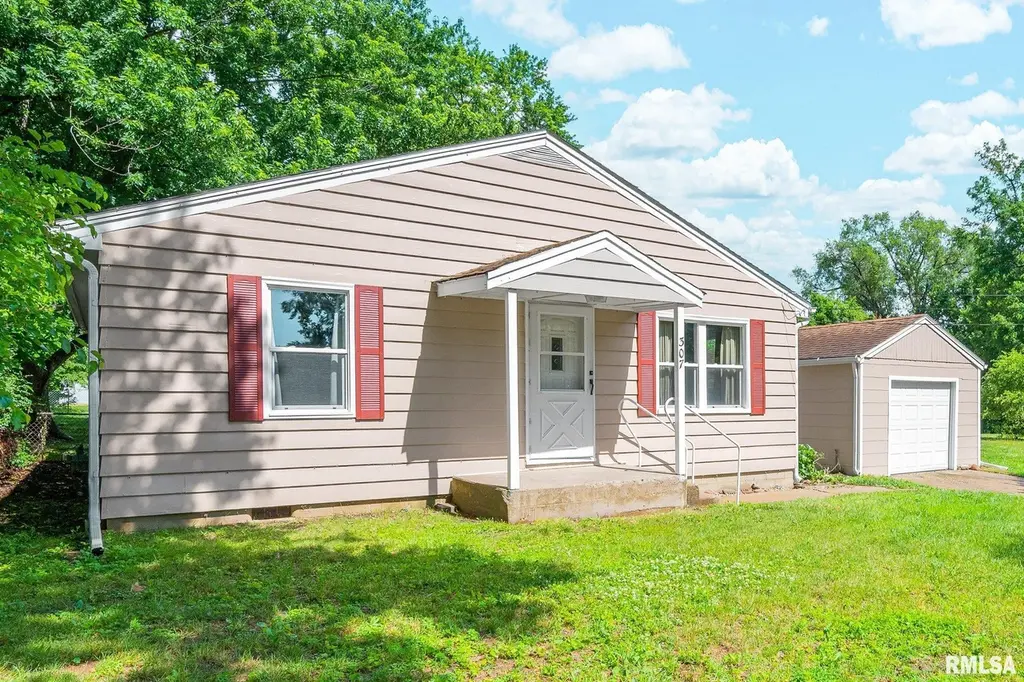
307 Wagner St · Washington, IL
Flood risk 1/10 · Minimal
- FEMA flood zone
- X (unshaded)
- Chance of flooding over 30 yrs
- 0.0%
- Est. flood insurance / yr
- $507 – $1,088
Fire risk 1/10 · Minimal
- Est. fire insurance / yr
- $804 – $1,492
Heat risk 3/10 · Minor
- Hot days now (above 104°F)
- 7 days/yr
- Hot days in 30 yrs
- 18 days/yr
Wind risk 2/10 · Minimal
- Chance of severe wind over 30 yrs
- 1.0%
Air-quality risk 2/10 · Minimal
- Unhealthy air days now
- 1 days/yr
- Unhealthy air days in 30 yrs
- 2 days/yr
Risk factors via First Street. Map © Google.
Why this score? — see what drove the D+ grade
The composite is a weighted blend of 9 inputs, each scored 0–100. Each bar is that input's sub-score; the figure is the points it added to the 100-point composite (weight × sub-score).
- Cash flow +16.1/30.0
- ARV discount +10.3/15.0
- 1% rule +5.1/10.0
- DSCR +5.0/10.0
- Livability +3.7/5.0
- Rent growth +2.5/5.0
- Condition / age +2.5/5.0
- Schools +1.1/10.0
- Appreciation +0.0/10.0
$125,000
🖨 Deal sheet (PDF) 📄 Offer letter ✓ Due diligence
Listing remarks
Cute, cozy and move in ready! This charming 2-bedroom, 1 bathroom home offers convenient one-level living with no basement to maintain. Inside, you'll find an updated kitchen featuring refreshed cabinetry and flooring, along with new carpet in the living room and both bedrooms. Fresh paint throughout gives the home a bright, welcoming feel, while updated windows and bathroom improvements add to the home's appeal. Step outside to enjoy the large yard which is partially fenced. A detached one-stall garage provides additional storage and parking. Whether you are a first-time buyer, downsizing, investing or looking for an affordable, low maintenance home, this property is one you won't want to
Key facts
- New carpet
- Updated windows
- Large yard
Tags
Property features AI
Finance
- HOA & community: No association fees
Exterior
- Parking: Detached 1-car garage
- Utilities: Public water; Public sewer
- Home design: Single-family residence; Built in 1957; One story (primary living on main level)
- Construction: Shingle roof; Building area approximately 960 (total)
- Exterior features: Level lot; Lot dimensions approximately 80 x 150
Interior
- Kitchen: Dishwasher
- Bedrooms: 2 bedrooms (both on the main level)
- Flooring: Carpet in bedrooms and living areas; Luxury vinyl plank in kitchen; Vinyl in laundry
- Bathrooms: 1 full bathroom
- Heating & cooling: Forced air heating; Central air conditioning
- Interior features: Cable available; High-speed internet
- Laundry & utility: Washer; Dryer; Main-level laundry room
Neighborhood map
What this means for you Summary
Snapshot
- This is a 2-bed/1.0-bath single-family listed at $125k.
Deal economics
- At list price, monthly cash flow is $65 ($779/yr) — positive.
- The deal already cash-flows at list — no discount required.
- Meets the 1% rule at list price ($1k rent vs $125k).
- Cap rate 6.9% vs local median 3.3% in Washington — top-decile yield for the area; either an underpriced asset or a hidden risk that comps aren't pricing in. Stress-test before assuming the spread holds.
Location & tenants
- Location reads 73/100 on livability (#272 in IL) — a middle-class / working-renter tenant base. Strengths: crime A+, employment A+, cost of living A+; Watch: amenities F, commute F, health & safety F.
- District 50 Schools (suburban): math 12% / reading 11% proficiency, ranked #553 of 620 in IL (top 89%) — low school quality limits family demand, transient renter base, plan for 1-2y turnover.
- Zoned schools: J L Hensey Elem School (math 22% / reading 12%, grade F, #1,141 of 2,056 statewide, top 59%, 265 students, 0% FRL); Beverly Manor Elementary School (math 10% / reading 12%, grade F, #574 of 665 statewide, top 87%, 340 students, 0% FRL); Washington Comm High School (math 42% / reading 42%, grade F, #76 of 693 statewide, top 12%, 1,484 students, 0% FRL) — zoned schools average 0% FRL vs 45% district-wide (45 pts lower); this property's tenant base skews higher-income than the district average.
- Market conditions: 132 active listings in the ZIP; 3 comparable units currently listed for rent nearby; rentals at typical pace (median 16d on market — plan ~3-4 weeks tenant-placement turnaround); 77 units permitted in Tazewell County in 2024 (0 in 5+ unit buildings).
Forward outlook
- Local home prices are declining (-3.0%/yr); year-one equity from $864 of loan paydown is wiped out by about $4k of value loss. Plan a longer hold.
- Tazewell County population projected at -15% by 2050 — secular population decline; favor cash flow + early exit over multi-decade hold.
Negotiation context
- Only 8 days on market — expect competitive offers; lowballing is unlikely to land.
- Current owner paid $56k; list at $125k implies a 125% gain — meaningful room to come down on a strong offer.
Risks & watch-outs
- Watch-outs: built in 1957 — expect roof / HVAC / electrical / plumbing capex.
Questions for the listing agent
- Built in 1957 — when were the roof, HVAC, electrical panel, plumbing, and water heater last replaced?
- Is there a deadline driving the sale (1031 exchange, divorce, estate, relocation)? That informs how much negotiation room exists.
- The area grade is low — what's the realistic commute time and amenity access for the typical tenant pool here? Any planned neighborhood developments (good or bad) we should know about?
- What's the average days-on-market for RENTAL listings here right now (not sales)? A rising rental-DOM trend means longer vacancies and softer asking-rent achievability than the comps imply.
- What's the recent tenant-quality profile in this submarket — average credit score on applications, eviction rate, late-payment / NSF rate, and stable-employment percentage? A property-management company in the area should have these aggregated.
- How much new for-sale + rental construction is in the pipeline within 1–3 miles? Heavy new supply typically softens prices + rents 12–24 months out; constrained supply supports both.
Investment metrics
- 1% rule
- 1.01% ✓
- Cap rate
- 6.92%
- Cash-on-cash
- 2.23%
- DSCR
- 1.10
- GRM
- 8.2
CMA / ARV
- ARV (on-the-fly)
- $133,440
- Comps found
- 12
Show comp detail 12 sales within ~0.75 mi
| Address | Dist | Beds/Ba | Sqft | Sold | Price | $/sf | Match |
|---|---|---|---|---|---|---|---|
| 404 Wagner St | 0.11mi | 2/1.0 | 1,028 (+7%) | 8mo | $125,000 | $122 | 76 |
| 400 Mcginley St | 0.11mi | 3/1.0 (+1) | 960 (0%) | 23mo | $120,000 | $125 | 71 |
| 409 Wagner St | 0.12mi | 3/1.0 (+1) | 1,042 (+8%) | 16mo | $59,660 | $57 | 62 |
| 205 Mcginley St | 0.15mi | 2/1.0 | 892 (-7%) | 23mo | $135,000 | $151 | 62 |
| 103 S Meadowview Ln | 0.66mi | 3/1.0 (+1) | 972 (+1%) | 6mo | $106,000 | $109 | 57 |
| 2237 W Northridge Ln | 0.71mi | 3/1.0 (+1) | 975 (+2%) | 6mo | $50,000 | $51 | 54 |
| 219 Linnhill Ln | 0.60mi | 3/1.0 (+1) | 925 (-4%) | 11mo | $160,000 | $173 | 52 |
| 200 N Linnhill Ln | 0.57mi | 3/1.0 (+1) | 975 (+2%) | 21mo | $150,000 | $154 | 48 |
| 203 S Meadowview Ln | 0.62mi | 3/1.0 (+1) | 1,010 (+5%) | 12mo | $155,000 | $153 | 48 |
| 2173 Washington Rd | 0.31mi | 3/1.0 (+1) | 828 (-14%) | 19mo | $115,000 | $139 | 42 |
| 2228 Northridge Ln | 0.67mi | 3/1.0 (+1) | 997 (+4%) | 19mo | $87,000 | $87 | 41 |
| 2233 Northridge Ln | 0.69mi | 3/1.0 (+1) | 875 (-9%) | 12mo | $148,000 | $169 | 39 |
Match score weights: distance 35% · size 25% · config 20% · recency 20%. Top-matched comps best support the ARV.
Projected returns pro-forma
-3.0% appreciation · 3.0% rent growth · sell at horizon
- IRR
- -12.7%
- Equity multiple
- 0.54×
- Total profit
- $-16,059
- Equity at exit
- $18,638
- IRR
- -3.6%
- Equity multiple
- 0.76×
- Total profit
- $-8,407
- Equity at exit
- $10,808
Cash invested: $35,000 (down + closing). Projections, not guarantees.
Landlord ↔ Tenant lean methodology
- Overall (STATE)
- 43 Moderately Tenant-Leaning
- State Illinois
- 43 Moderately Tenant-Leaning · D+7
- County
- — inherits STATE
- City
- — inherits STATE
ZIP-level market 61571
- Active inventory
- 132
- Price-to-rent
- 8.2×
Monthly cashflow live
- Estimated rent
- $1,265 medium interval (Pro) →
- Mortgage (P&I)
- −$656
- Tax from tax record
- −$227 /mo · $2,724/yr
- Insurance
- −$52
- HOA
- −$0
- Vacancy / Maint / Mgmt
- −$266
- Net cashflow
- $65
Break-even live
Sensitivity live
| Price | -10% $136 | -5% $100 | +0% $65 | +5% $30 | +10% $-6 |
|---|---|---|---|---|---|
| Rent | -10% $-35 | -5% $15 | +0% $65 | +5% $115 | +10% $165 |
| Rate | -1.0pp $128 | -0.5pp $97 | base $65 | +0.5pp $33 | +1.0pp $0 |
UW: 25.0% down · 7.5% · 30yr · 1.5% tax · 5.0% vac · 8.0% maint · 8.0% mgmt
Financing live
Cash to close
- Down payment
- $31,250
- Closing costs
- $3,750
- Reserves months
- —
- Total cash needed
- —
Loan-product check · same deal, 3 products live
Conventional
25% down · 7.5% · 30yr
- Down + closing
- —
- Monthly P&I
- —
- Monthly cashflow
- —
- DSCR
- —
- Eligible?
- —
Personal DTI + credit; lowest rate.
DSCR
20% down · 8.5% · 30yr
- Down + closing
- —
- Monthly P&I
- —
- Monthly cashflow
- —
- DSCR
- —
- Eligible?
- —
No personal income docs; deal must DSCR.
Hard money
10% down · 12.0% · 12mo
- Down + closing
- —
- Monthly P&I
- —
- Monthly cashflow
- —
- DSCR
- —
- Eligible?
- —
Short-term bridge; refi at stabilization.
Rent comps 3 comps
| Address | Beds | Baths | Sqft | Rent | $/sqft | DOM | Units | Dist |
|---|---|---|---|---|---|---|---|---|
| 924 School St Washington, IL | 2.0 | 2.0 | 1000 | $1,250 | $1.25 | 15d | 1 | 0.46mi |
| 2244 Northridge Ln Washington, IL | 3.0 | 1.0 | 825 | $1,500 | $1.82 | 15d | 1 | 0.74mi |
| 1910 Canterbury Dr Washington, IL | 2.0 | 1.0 | 850 | $950 | $1.12 | 15d | 1 | 1.16mi |
Listing history 8 events
-
2026-06-18status $125,000 Pending 8 DOM
-
2026-06-18days on market $125,000 Active 8 DOM
-
2026-06-17days on market $125,000 Active 7 DOM
-
2026-06-16days on market $125,000 Active 6 DOM
-
2026-06-15days on market $125,000 Active 5 DOM
-
2026-06-13days on market $125,000 Active 3 DOM
-
2026-06-12remarks 699-char remark
-
2026-06-12$125,000 Active 2 DOM
ⓘ Source: listings_history table (triggers on properties + properties_extension) + one-shot
backfill from property_details.listing_events for pre-trigger history.
Tax reassessment forecast IL · Partial reset (capped growth)
- Current annual tax
- $2,724 · $227/mo
- Projected year-2 tax
- $2,781 · $232/mo
- Expected delta
- +$57/yr (+$5/mo · 2.1%)
ⓘ Screening estimate from a state-policy table — verify with the county assessor before closing.
Climate risk First Street
- Flood 1/10 Low FEMA zone X (unshaded) · 0% chance over 30 yrs
- Wildfire 1/10 Low
- Heat 3/10 Moderate 7 d/yr ≥104°F today · 18 d/yr by 30 yrs out
- Wind 2/10 Low 100% chance of damaging wind over 30 yrs
- Air quality 2/10 Low 1 unhealthy d/yr today · 2 by 30 yrs out
Nearby sold comps map
Loading sold comps map…
Walkable amenities ~0.75 mi
Loading nearby amenities…
Taxation est. · year 1
- Rental income
- $15,182
- − Mortgage interest
- −$7,002
- − Property taxes
- −$2,724
- − Insurance
- −$625
- − Repairs & maintenance
- −$1,215
- − Management
- −$1,215
- − Depreciation
- −$3,636
- Taxable loss
- −$1,234
- Est. tax savings @ 24.0%
- +$296
- After-tax cash flow
- $1,075/yr
For passive investors: Depreciation is non-cash, so a rental often shows a tax loss while cash-flowing — sheltering income. Rental losses are passive: they offset passive income freely, and up to $25,000/yr can offset ordinary (W-2) income if you actively participate and your MAGI is under $100k (phasing out to $0 by $150k); unused losses carry forward. On sale, claimed depreciation is recaptured at up to 25%, and gains may owe capital-gains tax (a 1031 exchange can defer both). Figures are a year-1 estimate at your 24.0% rate — not tax advice; consult a CPA.
Schools (NCES district)
- District
- District 50 Schools
- NCES district ID
- 1741010
- Math proficiency
- 12% ▼ -2.00%
- Reading proficiency
- 11% ▼ -7.00%
- Median HH income
- $50,613
- Composite
- 10.93/100
- National rank
- #9748
- State rank
- #553 of 620 in IL
Livability — Washington
- Score
- 73/100
- State rank
- #272
- US rank
- #5136
Category grades
Schools grade is shown separately in the Schools card above.
Census & demographics
- Census place
- Washington, IL
- City population
- 24,544
- Population (ZIP)
- 24,544
Population outlook (Tazewell County) Hauer SSP2
- Today (2025)
- 131,252 people
- By 2030
- 128,028 · -2.5%
- By 2040
- 120,443 · -8.2%
- By 2050
- 111,872 · -14.8%
- By 2075
- 89,843 · -31.5%
- By 2100
- 66,468 · -49.4%
Race, ethnicity, and origin ACS 2023
- Neighborhood character
- Predominantly White (93%)
- Race & ethnicity
- White 93% Hispanic / Latino 3% Two or more races 3% Asian 1%
- Common ancestry
- Lithuanian 4% Italian 3% Iranian 2%
- Foreign-born
- 2% · Canada, China
- Languages at home
- 97% English-only · Spanish 2%
Political lean MEDSL · Tazewell
- 2024 margin
- Strong R (+26.7) · D 35.8% · R 62.5% · Other 1.8%
- 2008→2024 swing
- -20.6pp toward R · 2008: -6.0pp · 2024: -26.7pp
- All cycles
- 2024: R+26.7 2020: R+25.6 2016: R+28.5 2012: R+17.9 2008: R+6.0
Not yet ingested
- Civics
- —
Market trends
- HPI YoY
- ▼ -135.85%
- Current HPI
- 149.5627
- Rent YoY
- —
- Metro
- —
- State GDP YoY
- ▲ 1.59%
- F500 in state
- 60
Industry mix (Fortune 500 HQ in IL)
| Industry | F500 HQs | Revenue |
|---|---|---|
| Insurance | 4 | $201B |
|
||
| Consumer Goods | 4 | $87B |
|
||
| Industrial Machinery | 3 | $64B |
|
||
| Healthcare | 2 | $55B |
|
||
| Retail / Pharmacy | 1 | $148B |
|
||
| Agriculture / Food | 1 | $86B |
|
||
Price history
+125.2% since first listed3 events — show timeline
- 2026-06-10 Listed $125,000 RMLSA as Distributed by MLS Grid
- 2021-08-06 Listing Removed — RMLSA as Distributed by MLS Grid
- 2012-04-23 Sold (Public Records) $55,500 Public Records
Property tax history
+2.6%/yrLatest (2024): $2,724 · +6.1% YoY. Source: county tax records.
Cash-flow waterfall
monthlySold comps — $/sqft
last 12 mo · ≤1 miLoading sold comps…