1501 Fairfield Rd · Fairfield, TN
Flood risk 1/10 · Minimal
- FEMA flood zone
- X (unshaded)
- Chance of flooding over 30 yrs
- 0.0%
- Est. flood insurance / yr
- $507 – $1,088
Fire risk 4/10 · Minor
- Est. fire insurance / yr
- $949 – $1,763
Heat risk 5/10 · Moderate
- Hot days now (above 106°F)
- 7 days/yr
- Hot days in 30 yrs
- 20 days/yr
Wind risk 3/10 · Minor
- Chance of severe wind over 30 yrs
- 7.0%
Air-quality risk 2/10 · Minimal
- Unhealthy air days now
- 0 days/yr
- Unhealthy air days in 30 yrs
- 2 days/yr
Risk factors via First Street. Map © Google.
Why this score? — see what drove the D grade
The composite is a weighted blend of 9 inputs, each scored 0–100. Each bar is that input's sub-score; the figure is the points it added to the 100-point composite (weight × sub-score).
- Cash flow +13.6/30.0
- ARV discount +7.5/15.0
- DSCR +4.1/10.0
- Schools +3.6/10.0
- Appreciation +2.7/10.0
- 1% rule +2.6/10.0
- Rent growth +2.5/5.0
- Condition / age +2.5/5.0
- Livability +1.9/5.0
$255,500
🖨 Deal sheet (PDF) 📄 Offer letter ✓ Due diligence
Listing remarks MLS
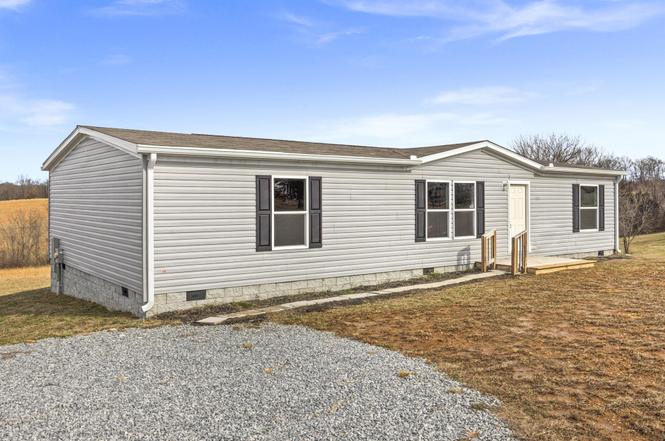
Brand NEW Home on a beautiful 5+ acres tract! Gorgeous Views from the Rocking-Chair back porch. Land is mostly clear with plenty of room for horses or livestock for a Mini-Farm. Oversized Bedrooms each with HUGE Walk-In Closets! Vinyl Flooring Throughout with NO carpet anywhere! Convenient to Portland and Westmoreland Lots of room for the price!
Key facts
- Walk-in closet
- Private bathroom
- Bright natural light
Tags
Neighborhood map
What this means for you Summary
Snapshot
- This is a 3-bed/2.0-bath other listed at $256k.
Deal economics
- At list price, monthly cash flow is $15 ($180/yr) — positive.
- The deal already cash-flows at list — no discount required.
- To meet the 1% rule (rent ≥ 1% of price), the offer needs to be $193k (24.3% below list).
- Recommended offer: $193k (24.3% below list) — sets the bar for 1% rule.
Location & tenants
- Location reads 38/100 on livability (#426 in TN) — a limited-amenity area; tenant pool skews transient or value-seeking. Strengths: cost of living A+, crime A; Watch: amenities F, commute F, employment F.
- Sumner County (suburban): math 44% / reading 39% proficiency, ranked #12 of 139 in TN (top 9%) — families likely to look elsewhere, expect single-tenant / working-renter base with shorter leases.
- Zoned schools: Westmoreland Elementary (math 41% / reading 33%, grade F, #272 of 952 statewide, top 31%, 525 students, 0% FRL); Westmoreland Middle School (math 39% / reading 28%, grade F, #73 of 333 statewide, top 23%, 430 students, 0% FRL); Westmoreland High School (math 27% / reading 37%, grade F, #56 of 332 statewide, top 20%, 526 students, 0% FRL) — zoned schools average 0% FRL vs 34% district-wide (34 pts lower); this property's tenant base skews higher-income than the district average.
- Market conditions: 145 active listings in the ZIP; 1,748 units permitted in Sumner County in 2024 (124 in 5+ unit buildings).
Forward outlook
- Local home prices are declining (-3.0%/yr); year-one equity from $2k of loan paydown is wiped out by about $8k of value loss. Plan a longer hold.
- Sumner County population projected at +35% by 2050 — long-run rental-demand tailwind backs the buy-and-hold thesis.
Negotiation context
- It's been on market 52 days — a 3% lower offer ($248k) is reasonable based on typical stale-listing flexibility.
- 3 sale attempts since 2y ago with the ask held roughly flat each time — persistent listings suggest the price (not the market) is what's stuck; bring a comps-based counter.
Risks & watch-outs
- Climate carrying-cost: extreme-heat days projected 7→20/yr by 2055 (HVAC capex compounding) — expect insurance premiums to compound above CPI over the hold.
Questions for the listing agent
- It's been on market 52 days. Have you received any prior offers? Is the seller open to a 24% concession, seller financing, or rate buy-down credit?
- Is there a deadline driving the sale (1031 exchange, divorce, estate, relocation)? That informs how much negotiation room exists.
- Schools are F-rated, which usually means shorter tenancies and higher turnover. Who's the typical renter profile here, and what's been the actual vacancy rate?
- The area grade is low — what's the realistic commute time and amenity access for the typical tenant pool here? Any planned neighborhood developments (good or bad) we should know about?
- What's the average days-on-market for RENTAL listings here right now (not sales)? A rising rental-DOM trend means longer vacancies and softer asking-rent achievability than the comps imply.
- What's the recent tenant-quality profile in this submarket — average credit score on applications, eviction rate, late-payment / NSF rate, and stable-employment percentage? A property-management company in the area should have these aggregated.
- How much new for-sale + rental construction is in the pipeline within 1–3 miles? Heavy new supply typically softens prices + rents 12–24 months out; constrained supply supports both.
Investment metrics
- 1% rule
- 0.76% ✗
- Cap rate
- 6.36%
- Cash-on-cash
- 0.25%
- DSCR
- 1.01
- GRM
- 11.0
CMA / ARV
No comps found within radius.
Projected returns pro-forma
-3.0% appreciation · 3.0% rent growth · sell at horizon
- IRR
- -16.0%
- Equity multiple
- 0.43×
- Total profit
- $-40,574
- Equity at exit
- $38,096
- IRR
- -7.7%
- Equity multiple
- 0.52×
- Total profit
- $-34,616
- Equity at exit
- $22,091
Cash invested: $71,540 (down + closing). Projections, not guarantees.
Landlord ↔ Tenant lean methodology
- Overall (STATE)
- 87 Strongly Landlord-Friendly
- State Tennessee
- 87 Strongly Landlord-Friendly · R+13
- County
- — inherits STATE
- City
- — inherits STATE
ZIP-level market 37186
- Home prices YoY
- -1.4%
- Active inventory
- 145
- Price-to-rent
- 11.0×
Monthly cashflow live
- Estimated rent
- $1,933 medium interval (Pro) →
- Mortgage (P&I)
- −$1,340
- Tax from tax record
- −$66 /mo · $792/yr
- Insurance
- −$106
- HOA
- −$0
- Vacancy / Maint / Mgmt
- −$406
- Net cashflow
- $15
Break-even live
Sensitivity live
| Price | -10% $160 | -5% $87 | +0% $15 | +5% $-57 | +10% $-130 |
|---|---|---|---|---|---|
| Rent | -10% $-138 | -5% $-61 | +0% $15 | +5% $91 | +10% $168 |
| Rate | -1.0pp $144 | -0.5pp $80 | base $15 | +0.5pp $-51 | +1.0pp $-119 |
UW: 25.0% down · 7.5% · 30yr · 1.5% tax · 5.0% vac · 8.0% maint · 8.0% mgmt
Financing live
Cash to close
- Down payment
- $63,875
- Closing costs
- $7,665
- Reserves months
- —
- Total cash needed
- —
Loan-product check · same deal, 3 products live
Conventional
25% down · 7.5% · 30yr
- Down + closing
- —
- Monthly P&I
- —
- Monthly cashflow
- —
- DSCR
- —
- Eligible?
- —
Personal DTI + credit; lowest rate.
DSCR
20% down · 8.5% · 30yr
- Down + closing
- —
- Monthly P&I
- —
- Monthly cashflow
- —
- DSCR
- —
- Eligible?
- —
No personal income docs; deal must DSCR.
Hard money
10% down · 12.0% · 12mo
- Down + closing
- —
- Monthly P&I
- —
- Monthly cashflow
- —
- DSCR
- —
- Eligible?
- —
Short-term bridge; refi at stabilization.
Listing history 9 events
-
2026-04-20status Pending
-
2026-04-14price $255,500
-
2026-04-02status Active
-
2026-03-15status Pending
-
2026-02-09$268,500 Active
-
2024-10-03soldstatus $293,500 Closed 349-char remark
Show marketing remark (349 chars)
Brand NEW Home on a beautiful 5+ acres tract! Gorgeous Views from the Rocking-Chair back porch. Land is mostly clear with plenty of room for horses or livestock for a Mini-Farm. Oversized Bedrooms each with HUGE Walk-In Closets! Vinyl Flooring Throughout with NO carpet anywhere! Convenient to Portland and Westmoreland Lots of room for the price!
-
2024-08-31status Pending 349-char remark
Show marketing remark (349 chars)
Brand NEW Home on a beautiful 5+ acres tract! Gorgeous Views from the Rocking-Chair back porch. Land is mostly clear with plenty of room for horses or livestock for a Mini-Farm. Oversized Bedrooms each with HUGE Walk-In Closets! Vinyl Flooring Throughout with NO carpet anywhere! Convenient to Portland and Westmoreland Lots of room for the price!
-
2024-08-17price $299,900 349-char remark
Show marketing remark (349 chars)
Brand NEW Home on a beautiful 5+ acres tract! Gorgeous Views from the Rocking-Chair back porch. Land is mostly clear with plenty of room for horses or livestock for a Mini-Farm. Oversized Bedrooms each with HUGE Walk-In Closets! Vinyl Flooring Throughout with NO carpet anywhere! Convenient to Portland and Westmoreland Lots of room for the price!
-
2024-07-19$309,900 Active 349-char remark
Show marketing remark (349 chars)
Brand NEW Home on a beautiful 5+ acres tract! Gorgeous Views from the Rocking-Chair back porch. Land is mostly clear with plenty of room for horses or livestock for a Mini-Farm. Oversized Bedrooms each with HUGE Walk-In Closets! Vinyl Flooring Throughout with NO carpet anywhere! Convenient to Portland and Westmoreland Lots of room for the price!
ⓘ Source: listings_history table (triggers on properties + properties_extension) + one-shot
backfill from property_details.listing_events for pre-trigger history.
Tax reassessment forecast TN · Resets to sale price
- Current annual tax
- $792 · $66/mo
- Projected year-2 tax
- $1,814 · $151/mo
- Expected delta
- +$1,022/yr (+$85/mo · 129.0%)
ⓘ Screening estimate from a state-policy table — verify with the county assessor before closing.
Climate risk First Street
- Flood 1/10 Low FEMA zone X (unshaded) · 0% chance over 30 yrs
- Wildfire 4/10 Moderate
- Heat 5/10 Major 7 d/yr ≥106°F today · 20 d/yr by 30 yrs out
- Wind 3/10 Moderate 7% chance of damaging wind over 30 yrs
- Air quality 2/10 Low 0 unhealthy d/yr today · 2 by 30 yrs out
Nearby sold comps map
Loading sold comps map…
Walkable amenities ~0.75 mi
Loading nearby amenities…
Taxation est. · year 1
- Rental income
- $23,200
- − Mortgage interest
- −$14,312
- − Property taxes
- −$792
- − Insurance
- −$1,278
- − Repairs & maintenance
- −$1,856
- − Management
- −$1,856
- − Depreciation
- −$7,433
- Taxable loss
- −$4,326
- Est. tax savings @ 24.0%
- +$1,038
- After-tax cash flow
- $1,218/yr
For passive investors: Depreciation is non-cash, so a rental often shows a tax loss while cash-flowing — sheltering income. Rental losses are passive: they offset passive income freely, and up to $25,000/yr can offset ordinary (W-2) income if you actively participate and your MAGI is under $100k (phasing out to $0 by $150k); unused losses carry forward. On sale, claimed depreciation is recaptured at up to 25%, and gains may owe capital-gains tax (a 1031 exchange can defer both). Figures are a year-1 estimate at your 24.0% rate — not tax advice; consult a CPA.
Schools (NCES district)
- District
- Sumner County
- NCES district ID
- 4704020
- Math proficiency
- 44% ▼ -11.00%
- Reading proficiency
- 39% ▼ -5.00%
- Median HH income
- $56,998
- Composite
- 36.44/100
- National rank
- #4667
- State rank
- #12 of 139 in TN
Livability — Fairfield
- Score
- 38/100
- State rank
- #426
- US rank
- #27496
Category grades
Schools grade is shown separately in the Schools card above.
Census & demographics
- Population (ZIP)
- 10,644
Population outlook (Sumner County) Hauer SSP2
- Today (2025)
- 208,284 people
- By 2030
- 223,902 · +7.5%
- By 2040
- 253,892 · +21.9%
- By 2050
- 281,199 · +35.0%
- By 2075
- 344,866 · +65.6%
- By 2100
- 384,369 · +84.5%
Race, ethnicity, and origin ACS 2023
- Neighborhood character
- Predominantly White (92%)
- Race & ethnicity
- White 92% Two or more races 5% Asian 1% Hispanic / Latino 1%
- Common ancestry
- Slovak 2% Lithuanian 1% Serbian 1%
- Foreign-born
- 1%
- Languages at home
- 98% English-only · Other Indo-European 1% Spanish 1%
Political lean MEDSL · Sumner
- 2024 margin
- Solid R (+41.8) · D 28.5% · R 70.3% · Other 1.1%
- 2008→2024 swing
- -6.9pp toward R · 2008: -34.9pp · 2024: -41.8pp
- All cycles
- 2024: R+41.8 2020: R+38.6 2016: R+45.0 2012: R+42.0 2008: R+34.9
Not yet ingested
- Civics
- —
Market trends
- HPI YoY
- ▼ -4.60%
- Current HPI
- 336.4711
- Rent YoY
- —
- Metro
- —
- State GDP YoY
- ▲ 2.78%
- F500 in state
- 22
Industry mix (Fortune 500 HQ in TN)
| Industry | F500 HQs | Revenue |
|---|---|---|
| Healthcare | 3 | $91B |
|
||
| Retail | 3 | $72B |
|
||
| Transportation / Logistics | 1 | $88B |
|
||
| Paper / Packaging | 1 | $19B |
|
||
| Insurance | 1 | $13B |
|
||
| Energy | 1 | $12B |
|
||
Price history
-17.6% since first listed9 events — show timeline
- 2026-04-20 Pending — REALTRACS as Distributed by MLS Grid
- 2026-04-14 Price Changed $255,500 REALTRACS as Distributed by MLS Grid
- 2026-04-02 Relisted — REALTRACS as Distributed by MLS Grid
- 2026-03-15 Pending — REALTRACS as Distributed by MLS Grid
- 2026-02-09 Listed $268,500 REALTRACS as Distributed by MLS Grid
- 2024-10-03 Sold (MLS) $293,500 REALTRACS as Distributed by MLS Grid
- 2024-08-31 Pending — REALTRACS as Distributed by MLS Grid
- 2024-08-17 Price Changed $299,900 REALTRACS as Distributed by MLS Grid
- 2024-07-19 Listed $309,900 REALTRACS as Distributed by MLS Grid
Property tax history
+13.6%/yrLatest (2025): $792 · +69.2% YoY. Source: county tax records.
Cash-flow waterfall
monthlySold comps — $/sqft
last 12 mo · ≤1 miLoading sold comps…