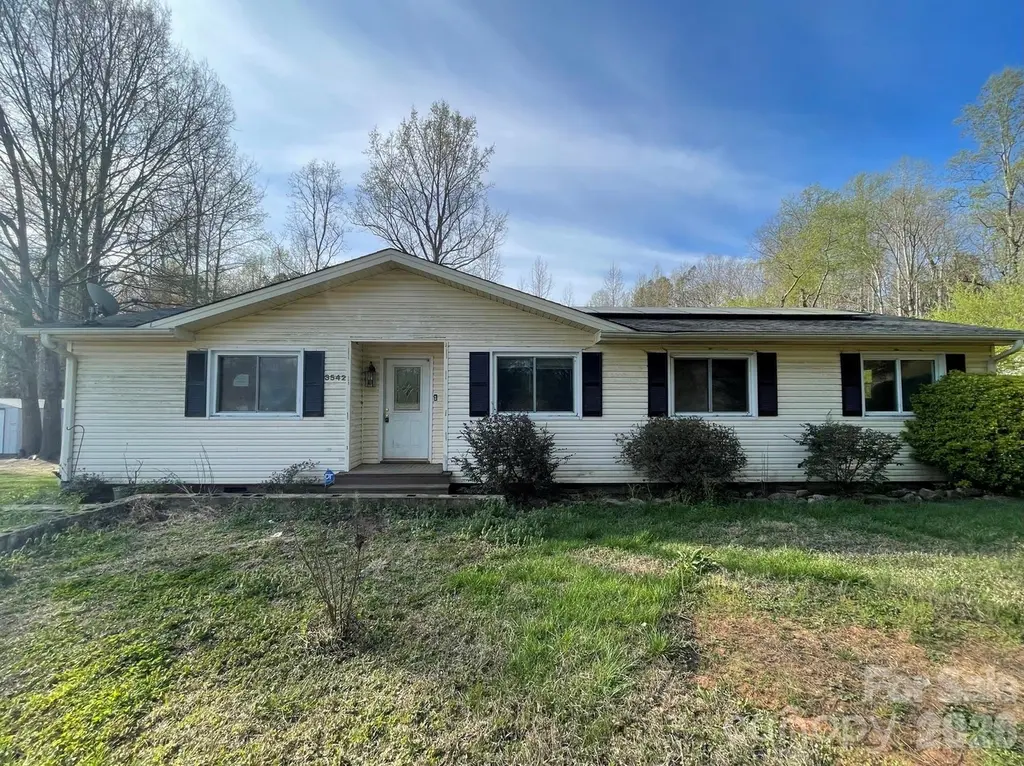
3542 Orchard Rd · Iron Station, NC
Flood risk 8/10 · Major
- FEMA flood zone
- X (unshaded)
- Chance of flooding over 30 yrs
- 0.99%
- Est. flood insurance / yr
- $507 – $1,088
Fire risk 4/10 · Minor
- Est. fire insurance / yr
- $906 – $1,684
Heat risk 6/10 · Moderate
- Hot days now (above 104°F)
- 7 days/yr
- Hot days in 30 yrs
- 17 days/yr
Wind risk 4/10 · Minor
- Chance of severe wind over 30 yrs
- 8.0%
Air-quality risk 3/10 · Minor
- Unhealthy air days now
- 3 days/yr
- Unhealthy air days in 30 yrs
- 4 days/yr
Risk factors via First Street. Map © Google.
Why this score? — see what drove the D+ grade
The composite is a weighted blend of 9 inputs, each scored 0–100. Each bar is that input's sub-score; the figure is the points it added to the 100-point composite (weight × sub-score).
- Cash flow +22.3/30.0
- DSCR +7.1/10.0
- 1% rule +5.1/10.0
- Schools +4.8/10.0
- Livability +2.8/5.0
- Rent growth +2.5/5.0
- Condition / age +2.5/5.0
- ARV discount +0.0/15.0
- Appreciation +0.0/10.0
$171,000
🖨 Deal sheet 📄 Offer letter ✓ Due diligence
Listing remarks MLS
Country living with four bedrooms and priced to sell this ranch home won't last long. Situated conveniently between Denver and Lincolnton. Included is a one year home buyer warranty.
Key facts
- 0.28 acre lot
- Built 1982
- Listed 71 days
Property features AI
Finance
- HOA & community: No HOA
Exterior
- Parking: Driveway with 2 open parking spaces
- Utilities: Well water; Septic system
- Home design: Single family residence; One story; Site built
- Construction: Vinyl exterior; Crawl space foundation
- Exterior features: Deck; Fenced yard; Concrete and paved road access; Publicly maintained road
Interior
- Kitchen: Electric range; Microwave; Refrigerator
- Bedrooms: 3 bedrooms on the main level
- Flooring: Carpet; Tile; Vinyl
- Bathrooms: 2 full bathrooms on the main level
- Heating & cooling: Heat pump for heating and cooling
- Interior features: 9 total rooms; Ceiling fan(s)
- Laundry & utility: Laundry closet on the main level; Electric water heater
Neighborhood map
What this means for you Summary
Snapshot
- This is a 3-bed/1.5-bath single-family listed at $171k.
Deal economics
- At list price, monthly cash flow is $215 ($3k/yr) — positive.
- The deal already cash-flows at list — no discount required.
- Meets the 1% rule at list price ($2k rent vs $171k).
- Recommended offer: $161k (6.0% below list) — sets the bar for market timing.
- Cap rate 8.3% vs local median 3.0% in Iron Station — top-decile yield for the area; either an underpriced asset or a hidden risk that comps aren't pricing in. Stress-test before assuming the spread holds.
Location & tenants
- Location reads 55/100 on livability (#639 in NC) — a working-class tenant base; expect higher turnover. Strengths: cost of living A+, housing A+, crime A; Watch: amenities F, commute F, employment F.
- Lincoln County Schools (rural): math 57% / reading 55% proficiency, ranked #42 of 178 in NC (top 24%) — acceptable for families but not a draw, mixed tenant base, ~2y average lease.
- Zoned schools: Iron Station Elementary (math 57% / reading 57%, grade C+, #249 of 1,410 statewide, top 20%, 376 students, 64% FRL); East Lincoln High (math 65% / reading 73%, grade B, #131 of 535 statewide, top 25%, 1,047 students, 29% FRL).
- Market conditions: 63 active listings in the ZIP; 697 units permitted in Lincoln County in 2024 (0 in 5+ unit buildings).
Forward outlook
- Local home prices are declining (-3.0%/yr); year-one equity from $1k of loan paydown is wiped out by about $5k of value loss. Plan a longer hold.
- Lincoln County population projected at +8% by 2050 — modest demand growth; plan on rents tracking national, not racing it.
Negotiation context
- It's been on market 71 days — a 6% lower offer ($161k) is reasonable based on typical stale-listing flexibility.
- 2 sale attempts since 6y ago; this cycle's ask has dropped $14k (8%) from the opening price — seller is motivated, your offer sets the floor, not the list.
Risks & watch-outs
- Watch-outs: flood insurance adds $66/mo.
- Climate carrying-cost: severe flood risk; extreme-heat days projected 7→17/yr by 2055 (HVAC capex compounding) — expect insurance premiums to compound above CPI over the hold.
Questions for the listing agent
- It's been on market 71 days. Have you received any prior offers? Is the seller open to a 6% concession, seller financing, or rate buy-down credit?
- What's the actual annual flood-insurance premium (NFIP or private), and is the property in a SFHA with mandatory coverage?
- Why hasn't it sold? Are there any deal-killer items the seller is aware of (foundation, flood, title, zoning, code violations)?
- Is there a deadline driving the sale (1031 exchange, divorce, estate, relocation)? That informs how much negotiation room exists.
- Schools are D-rated, which usually means shorter tenancies and higher turnover. Who's the typical renter profile here, and what's been the actual vacancy rate?
- The area grade is low — what's the realistic commute time and amenity access for the typical tenant pool here? Any planned neighborhood developments (good or bad) we should know about?
- What's the average days-on-market for RENTAL listings here right now (not sales)? A rising rental-DOM trend means longer vacancies and softer asking-rent achievability than the comps imply.
- What's the recent tenant-quality profile in this submarket — average credit score on applications, eviction rate, late-payment / NSF rate, and stable-employment percentage? A property-management company in the area should have these aggregated.
- How much new for-sale + rental construction is in the pipeline within 1–3 miles? Heavy new supply typically softens prices + rents 12–24 months out; constrained supply supports both.
Investment metrics
- 1% rule
- 1.01% ✓
- Cap rate
- 8.27%
- Cash-on-cash
- 7.07%
- DSCR
- 1.31
- GRM
- 8.3
CMA / ARV
- ARV (on-the-fly)
- $140,068
- Comps found
- 1
Show comp detail 1 sale within ~0.75 mi
| Address | Dist | Beds/Ba | Sqft | Sold | Price | $/sf | Match |
|---|---|---|---|---|---|---|---|
| 3388 Rhyne Forest Rd | 0.47mi | 4/1.5 (+1) | 1,493 (+3%) | 7mo | $145,000 | $97 | 62 |
Match score weights: distance 35% · size 25% · config 20% · recency 20%. Top-matched comps best support the ARV.
Projected returns pro-forma
-3.0% appreciation · 3.0% rent growth · sell at horizon
- IRR
- -7.9%
- Equity multiple
- 0.71×
- Total profit
- $-13,982
- Equity at exit
- $25,497
- IRR
- 1.6%
- Equity multiple
- 1.12×
- Total profit
- $5,511
- Equity at exit
- $14,785
Cash invested: $47,880 (down + closing). Projections, not guarantees.
Landlord ↔ Tenant lean methodology
- Overall (STATE)
- 85 Strongly Landlord-Friendly
- State North Carolina
- 85 Strongly Landlord-Friendly · R+3
- County
- — inherits STATE
- City
- — inherits STATE
ZIP-level market 28080
- Home prices YoY
- -11.2%
- Active inventory
- 63
- Price-to-rent
- 8.3×
Monthly cashflow live
- Estimated rent
- $1,722 medium interval (Pro) →
- Mortgage (P&I)
- −$897
- Tax from tax record
- −$110 /mo · $1,324/yr
- Insurance
- −$71
- Flood insurance flood zone
- −$66 /mo · $798/yr
- HOA
- −$0
- Vacancy / Maint / Mgmt
- −$362
- Net cashflow
- $215
Break-even live
UW: 25.0% down · 7.5% · 30yr · 1.5% tax · 5.0% vac · 8.0% maint · 8.0% mgmt
Financing live
Cash to close
- Down payment
- $42,750
- Closing costs
- $5,130
- Reserves months
- —
- Total cash needed
- —
Loan-product check · same deal, 3 products live
Conventional
25% down · 7.5% · 30yr
- Down + closing
- —
- Monthly P&I
- —
- Monthly cashflow
- —
- DSCR
- —
- Eligible?
- —
Personal DTI + credit; lowest rate.
DSCR
20% down · 8.5% · 30yr
- Down + closing
- —
- Monthly P&I
- —
- Monthly cashflow
- —
- DSCR
- —
- Eligible?
- —
No personal income docs; deal must DSCR.
Hard money
10% down · 12.0% · 12mo
- Down + closing
- —
- Monthly P&I
- —
- Monthly cashflow
- —
- DSCR
- —
- Eligible?
- —
Short-term bridge; refi at stabilization.
Listing history 22 events
-
2026-06-18days on market $171,000 Active 71 DOM
-
2026-06-17days on market $171,000 Active 70 DOM
-
2026-06-16days on market $171,000 Active 69 DOM
-
2026-06-15days on market $171,000 Active 68 DOM
-
2026-06-13pricedays on market $171,000 Active 66 DOM
-
2026-06-09days on market $179,900 Active 62 DOM
-
2026-06-08days on market $179,900 Active 61 DOM
-
2026-06-07days on market $179,900 Active 60 DOM
-
2026-06-04days on market $179,900 Active 57 DOM
-
2026-06-03days on market $179,900 Active 56 DOM
-
2026-06-02days on market $179,900 Active 55 DOM
-
2026-06-01days on market $179,900 Active 54 DOM
-
2026-05-31days on market $179,900 Active 53 DOM
-
2026-05-08price $179,900
-
2026-04-08$184,900 Active
-
2020-12-31soldstatus $150,000 Closed 184-char remark
Show marketing remark (184 chars)
Country living with four bedrooms and priced to sell this ranch home won't last long. Situated conveniently between Denver and Lincolnton. Included is a one year home buyer warranty.
-
2020-12-31soldstatus $150,000
Show marketing remark (184 chars)
Country living with four bedrooms and priced to sell this ranch home won't last long. Situated conveniently between Denver and Lincolnton. Included is a one year home buyer warranty.
-
2020-10-29status Pending 184-char remark
Show marketing remark (184 chars)
Country living with four bedrooms and priced to sell this ranch home won't last long. Situated conveniently between Denver and Lincolnton. Included is a one year home buyer warranty.
-
2020-09-29historical Active Under Contract 184-char remark
Show marketing remark (184 chars)
Country living with four bedrooms and priced to sell this ranch home won't last long. Situated conveniently between Denver and Lincolnton. Included is a one year home buyer warranty.
-
2020-09-19$150,000 Active 184-char remark
Show marketing remark (184 chars)
Country living with four bedrooms and priced to sell this ranch home won't last long. Situated conveniently between Denver and Lincolnton. Included is a one year home buyer warranty.
-
2003-09-29soldstatus $99,500
-
2001-12-11soldstatus $21,901
ⓘ Source: listings_history table (triggers on properties + properties_extension) + one-shot
backfill from property_details.listing_events for pre-trigger history.
Tax reassessment forecast NC · Resets to sale price
- Current annual tax
- $1,324 · $110/mo
- Projected year-2 tax
- $1,402 · $117/mo
- Expected delta
- +$78/yr (+$6/mo · 5.9%)
ⓘ Screening estimate from a state-policy table — verify with the county assessor before closing.
Climate risk First Street
- Flood 8/10 Severe FEMA zone X (unshaded) · 99% chance over 30 yrs
- Wildfire 4/10 Moderate
- Heat 6/10 Major 7 d/yr ≥104°F today · 17 d/yr by 30 yrs out
- Wind 4/10 Moderate 8% chance of damaging wind over 30 yrs
- Air quality 3/10 Moderate 3 unhealthy d/yr today · 4 by 30 yrs out
Nearby sold comps map
Loading sold comps map…
Walkable amenities ~0.75 mi
Loading nearby amenities…
Taxation est. · year 1
- Rental income
- $20,663
- − Mortgage interest
- −$9,579
- − Property taxes
- −$1,324
- − Insurance
- −$1,652
- − Repairs & maintenance
- −$1,653
- − Management
- −$1,653
- − Depreciation
- −$4,975
- Taxable loss
- −$173
- Est. tax savings @ 24.0%
- +$42
- After-tax cash flow
- $2,627/yr
For passive investors: Depreciation is non-cash, so a rental often shows a tax loss while cash-flowing — sheltering income. Rental losses are passive: they offset passive income freely, and up to $25,000/yr can offset ordinary (W-2) income if you actively participate and your MAGI is under $100k (phasing out to $0 by $150k); unused losses carry forward. On sale, claimed depreciation is recaptured at up to 25%, and gains may owe capital-gains tax (a 1031 exchange can defer both). Figures are a year-1 estimate at your 24.0% rate — not tax advice; consult a CPA.
Schools (NCES district)
- District
- Lincoln County Schools
- NCES district ID
- 3702680
- Math proficiency
- 57% ▲ 7.00%
- Reading proficiency
- 55% ▲ 1.00%
- Median HH income
- $49,203
- Composite
- 47.7/100
- National rank
- #2242
- State rank
- #42 of 178 in NC
Livability — Iron Station
- Score
- 55/100
- State rank
- #639
- US rank
- #23265
Category grades
Schools grade is shown separately in the Schools card above.
Census & demographics
- Census place
- Iron Station, NC
- Population (ZIP)
- 8,075
Population outlook (Lincoln County) Hauer SSP2
- Today (2025)
- 86,972 people
- By 2030
- 89,467 · +2.9%
- By 2040
- 93,107 · +7.1%
- By 2050
- 94,304 · +8.4%
- By 2075
- 95,190 · +9.4%
- By 2100
- 90,096 · +3.6%
Race, ethnicity, and origin ACS 2023
- Neighborhood character
- Predominantly White (77%)
- Race & ethnicity
- White 77% Hispanic / Latino 10% Black 8% Two or more races 6% Asian 2%
- Hispanic origin (detail)
- Mexican 6% Salvadoran 3%
- Common ancestry
- Serbian 4% Romanian 3% Lithuanian 2%
- Foreign-born
- 6% · Canada, Guatemala, Dominican Republic
- Languages at home
- 91% English-only · Spanish 7% Arabic 1%
Political lean MEDSL · Lincoln
- 2024 margin
- Solid R (+45.7) · D 26.8% · R 72.5%
- 2008→2024 swing
- -12.4pp toward R · 2008: -33.3pp · 2024: -45.7pp
- All cycles
- 2024: R+45.7 2020: R+45.9 2016: R+47.7 2012: R+38.9 2008: R+33.3
Not yet ingested
- Civics
- —
Market trends
- HPI YoY
- ▼ -41.23%
- Current HPI
- 327.9588
- Rent YoY
- —
- Metro
- —
- State GDP YoY
- ▲ 3.28%
- F500 in state
- 26
Industry mix (Fortune 500 HQ in NC)
| Industry | F500 HQs | Revenue |
|---|---|---|
| Financial Services | 2 | $213B |
|
||
| Retail | 2 | $95B |
|
||
| Industrial Conglomerate | 1 | $38B |
|
||
| Metals / Steel | 1 | $35B |
|
||
| Utilities | 1 | $30B |
|
||
| Industrial Machinery | 1 | $19B |
|
||
Price history
+721.4% since first listed9 events — show timeline
- 2026-05-08 Price Changed $179,900 CANOPYMLS as Distributed by MLS Grid
- 2026-04-08 Listed $184,900 CANOPYMLS as Distributed by MLS Grid
- 2020-12-31 Sold (Public Records) $150,000 Public Records
- 2020-12-31 Sold (MLS) $150,000 CANOPYMLS as Distributed by MLS Grid
- 2020-10-29 Pending — CANOPYMLS as Distributed by MLS Grid
- 2020-09-29 Contingent — CANOPYMLS as Distributed by MLS Grid
- 2020-09-19 Listed $150,000 CANOPYMLS as Distributed by MLS Grid
- 2003-09-29 Sold (Public Records) $99,500 Public Records
- 2001-12-11 Sold (Public Records) $21,901 Public Records
Property tax history
+3.9%/yrLatest (2025): $1,324 · +0.0% YoY. Source: county tax records.
Cash-flow waterfall
monthlySold comps — $/sqft
last 12 mo · ≤1 miLoading sold comps…