1207 Pine Haven Ct · Camp Nelson, CA
Flood risk 4/10 · Minor
- FEMA flood zone
- X (unshaded)
- Chance of flooding over 30 yrs
- 0.24%
- Est. flood insurance / yr
- $507 – $1,088
Fire risk 5/10 · Moderate
- Est. fire insurance / yr
- $659 – $1,223
Heat risk 3/10 · Minor
- Hot days now (above 82°F)
- 13 days/yr
- Hot days in 30 yrs
- 33 days/yr
Wind risk 1/10 · Minimal
- Chance of severe wind over 30 yrs
- —
Air-quality risk 10/10 · Severe
- Unhealthy air days now
- 51 days/yr
- Unhealthy air days in 30 yrs
- 54 days/yr
Risk factors via First Street. Map © Google.
Why this score? — see what drove the F grade
The composite is a weighted blend of 9 inputs, each scored 0–100. Each bar is that input's sub-score; the figure is the points it added to the 100-point composite (weight × sub-score).
- Appreciation +10.0/10.0
- Cash flow +7.8/30.0
- Schools +4.4/10.0
- Rent growth +2.5/5.0
- Condition / age +2.5/5.0
- DSCR +1.9/10.0
- 1% rule +1.7/10.0
- Livability +1.2/5.0
- ARV discount +0.0/15.0
$218,000
🖨 Deal sheet 📄 Offer letter ✓ Due diligence
Listing remarks
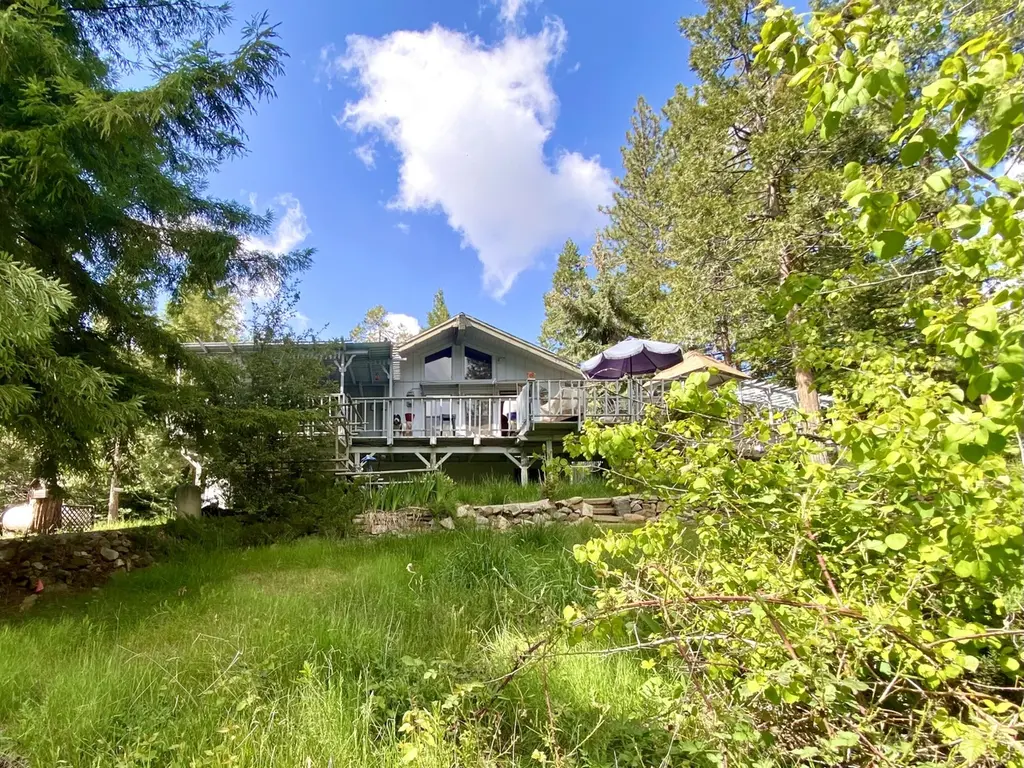
LOCATION LOCATION LOCATION!!! This home is located in Camp Nelson with easy access to Highway 190 from a paved driveway and access from Pine Haven Court, yet it's a quiet location because it is nestled among nature above the noise. And with more than 1/2 acre of forested land, you will feel like you have entered your own forest retreat. The home has 2 bedrooms, 1 3/4 bathrooms, a large living area with a raised hearth fireplace, the kitchen is open to the living room with a breakfast bar and dining area. There is also a bonus room that could easily be converted to a bedroom, studio or tv/game room. The lot is forested with varieties of pine, fir and cedar trees. There are several Costal Re
Key facts
- Attached garage
- Paved driveway
- Bonus room
Tags
Property features AI
Exterior
- Parking: Driveway; Attached garage (1 car)
- Utilities: Public water; Public sewer; Propane available; Electricity connected; Water connected; Sewer connected
- Home design: Single-family residence; One-story; Faces south
- Construction: Frame construction with vertical siding; Shingle roof; Built on a single level
- Exterior features: Rain gutters; Storage; Covered deck/patio; Outbuilding(s), shed(s), additional storage; Has a view
Interior
- Kitchen: Electric oven; Electric range; Range hood; Refrigerator
- Flooring: Carpet; Tile
- Bathrooms: One full bathroom; One three-quarter bathroom
- Heating & cooling: Forced air heating (propane); Ceiling fan(s) for cooling
- Interior features: Beamed ceilings; Vaulted ceilings; High ceilings; Laminate counters; Breakfast bar; Walk-in closets; Fireplace with heatilator and raised hearth
- Laundry & utility: Washer and dryer included; Laundry inside with sink (in basement)
Neighborhood map
What this means for you Summary
Snapshot
- This is a 2-bed/2.0-bath single-family listed at $218k.
Deal economics
- At list price, monthly cash flow is $-239 ($-3k/yr) — negative.
- To cash-flow at today's rent, offer at most $176k (19.4% below list).
- To meet the 1% rule (rent ≥ 1% of price), the offer needs to be $147k (32.5% below list).
- Recommended offer: $147k (32.5% below list) — sets the bar for 1% rule.
Location & tenants
- Location reads 25/100 on livability (#1,489 in CA) — a limited-amenity area; tenant pool skews transient or value-seeking. Strengths: crime A, health & safety A; Watch: amenities F, commute F, employment F.
- Springville Union Elementary (rural): math 44% / reading 52% proficiency, ranked #476 of 1,400 in CA (top 34%) — families likely to look elsewhere, expect single-tenant / working-renter base with shorter leases.
- Market conditions: 123 active listings in the ZIP; 1,447 units permitted in Tulare County in 2024 (307 in 5+ unit buildings).
Forward outlook
- In year one you build about $23k of equity ($2k loan paydown + $22k appreciation (10.0% local appreciation)).
- Tulare County population projected at +10% by 2050 — modest demand growth; plan on rents tracking national, not racing it.
- By year 2, paydown + projected appreciation supports a ~$37k cash-out refi (75% LTV) — recoverable capital for the next deal without selling this one.
Negotiation context
- Only 13 days on market — expect competitive offers; lowballing is unlikely to land.
- Current owner paid $172k; 27% above their basis — modest negotiation headroom, anchor on the comps not their cost.
Risks & watch-outs
- Climate carrying-cost: moderate wildfire risk — expect insurance premiums to compound above CPI over the hold.
Questions for the listing agent
- What do current leases actually rent for vs. the listed asking? Can we see a recent rent roll and the last 12 months of T-12 income?
- Built in 1973 — when were the roof, HVAC, electrical panel, plumbing, and water heater last replaced?
- Is there a deadline driving the sale (1031 exchange, divorce, estate, relocation)? That informs how much negotiation room exists.
- The area grade is low — what's the realistic commute time and amenity access for the typical tenant pool here? Any planned neighborhood developments (good or bad) we should know about?
- What's the average days-on-market for RENTAL listings here right now (not sales)? A rising rental-DOM trend means longer vacancies and softer asking-rent achievability than the comps imply.
- What's the recent tenant-quality profile in this submarket — average credit score on applications, eviction rate, late-payment / NSF rate, and stable-employment percentage? A property-management company in the area should have these aggregated.
- How much new for-sale + rental construction is in the pipeline within 1–3 miles? Heavy new supply typically softens prices + rents 12–24 months out; constrained supply supports both.
Investment metrics
- 1% rule
- 0.67% ✗
- Cap rate
- 4.98%
- Cash-on-cash
- -4.70%
- DSCR
- 0.79
- GRM
- 12.4
CMA / ARV
- ARV (on-the-fly)
- $185,980
- Comps found
- 8
Show comp detail 8 sales within ~0.75 mi
| Address | Dist | Beds/Ba | Sqft | Sold | Price | $/sf | Match |
|---|---|---|---|---|---|---|---|
| 1184 Highway 190 | 0.06mi | 2/2.0 | 1,150 (+5%) | 10mo | $309,000 | $269 | 80 |
| 1183 Bourbon Dr | 0.10mi | 2/1.0 | 950 (-13%) | 15mo | $149,000 | $157 | 56 |
| 1495 Nelson Dr | 0.27mi | 1/1.0 (-1) | 1,048 (-4%) | 20mo | $170,000 | $162 | 55 |
| 184 Manzanita Ct Ct | 0.47mi | 2/1.0 | 1,200 (+10%) | 11mo | $204,300 | $170 | 49 |
| 466 Sutherland Dr | 0.49mi | 2/1.0 | 939 (-14%) | 7mo | $160,000 | $170 | 44 |
| 657 Loop Dr | 0.68mi | 2/2.0 | 968 (-12%) | 9mo | $185,100 | $191 | 42 |
| 1823 Barnes Ct | 0.52mi | 1/1.0 (-1) | 1,030 (-6%) | 24mo | $173,000 | $168 | 37 |
| 1835 Barnes Ct | 0.52mi | 1/1.0 (-1) | 963 (-12%) | 16mo | $135,000 | $140 | 34 |
Match score weights: distance 35% · size 25% · config 20% · recency 20%. Top-matched comps best support the ARV.
Projected returns pro-forma
10.0% appreciation · 3.0% rent growth · sell at horizon
- IRR
- 20.9%
- Equity multiple
- 2.70×
- Total profit
- $103,471
- Equity at exit
- $196,392
- IRR
- 19.0%
- Equity multiple
- 6.19×
- Total profit
- $316,586
- Equity at exit
- $423,526
Cash invested: $61,040 (down + closing). Projections, not guarantees.
Landlord ↔ Tenant lean methodology
- Overall (STATE)
- 18 Strongly Tenant-Friendly
- State California
- 18 Strongly Tenant-Friendly · D+13
- County
- — inherits STATE
- City
- — inherits STATE
ZIP-level market 93265
- Home prices YoY
- 9.1%
- Active inventory
- 123
- Price-to-rent
- 12.4×
Monthly cashflow live
- Estimated rent
- $1,471 medium interval (Pro) →
- Mortgage (P&I)
- −$1,143
- Tax from tax record
- −$167 /mo · $2,001/yr
- Insurance
- −$91
- HOA
- −$0
- Vacancy / Maint / Mgmt
- −$309
- Net cashflow
- $-239
Break-even live
UW: 25.0% down · 7.5% · 30yr · 1.5% tax · 5.0% vac · 8.0% maint · 8.0% mgmt
Financing live
Cash to close
- Down payment
- $54,500
- Closing costs
- $6,540
- Reserves months
- —
- Total cash needed
- —
Loan-product check · same deal, 3 products live
Conventional
25% down · 7.5% · 30yr
- Down + closing
- —
- Monthly P&I
- —
- Monthly cashflow
- —
- DSCR
- —
- Eligible?
- —
Personal DTI + credit; lowest rate.
DSCR
20% down · 8.5% · 30yr
- Down + closing
- —
- Monthly P&I
- —
- Monthly cashflow
- —
- DSCR
- —
- Eligible?
- —
No personal income docs; deal must DSCR.
Hard money
10% down · 12.0% · 12mo
- Down + closing
- —
- Monthly P&I
- —
- Monthly cashflow
- —
- DSCR
- —
- Eligible?
- —
Short-term bridge; refi at stabilization.
Listing history 11 events
-
2026-06-18days on market $218,000 Active 13 DOM
-
2026-06-17days on market $218,000 Active 12 DOM
-
2026-06-16days on market $218,000 Active 11 DOM
-
2026-06-15days on market $218,000 Active 10 DOM
-
2026-06-14days on market $218,000 Active 8 DOM
-
2026-06-13days on market $218,000 Active 7 DOM
-
2026-06-10days on market $218,000 Active 5 DOM
-
2026-06-09days on market $218,000 Active 4 DOM
-
2026-06-08days on market $218,000 Active 3 DOM
-
2026-06-07remarks 699-char remark
-
2026-06-07$218,000 Active 2 DOM
ⓘ Source: listings_history table (triggers on properties + properties_extension) + one-shot
backfill from property_details.listing_events for pre-trigger history.
Tax reassessment forecast CA · Resets to sale price
- Current annual tax
- $2,001 · $167/mo
- Projected year-2 tax
- $2,001 · $167/mo
- Expected delta
- $0/yr ($0/mo · 0.0%)
ⓘ Screening estimate from a state-policy table — verify with the county assessor before closing.
Climate risk First Street
- Flood 4/10 Moderate FEMA zone X (unshaded) · 24% chance over 30 yrs
- Wildfire 5/10 Major
- Heat 3/10 Moderate 13 d/yr ≥82°F today · 33 d/yr by 30 yrs out
- Wind 1/10 Low
- Air quality 10/10 Extreme 51 unhealthy d/yr today · 54 by 30 yrs out
Nearby sold comps map
Loading sold comps map…
Walkable amenities ~0.75 mi
Loading nearby amenities…
Taxation est. · year 1
- Rental income
- $17,650
- − Mortgage interest
- −$12,211
- − Property taxes
- −$2,001
- − Insurance
- −$1,090
- − Repairs & maintenance
- −$1,412
- − Management
- −$1,412
- − Depreciation
- −$6,342
- Taxable loss
- −$6,819
- Est. tax savings @ 24.0%
- +$1,636
- After-tax cash flow
- $-1,230/yr
For passive investors: Depreciation is non-cash, so a rental often shows a tax loss while cash-flowing — sheltering income. Rental losses are passive: they offset passive income freely, and up to $25,000/yr can offset ordinary (W-2) income if you actively participate and your MAGI is under $100k (phasing out to $0 by $150k); unused losses carry forward. On sale, claimed depreciation is recaptured at up to 25%, and gains may owe capital-gains tax (a 1031 exchange can defer both). Figures are a year-1 estimate at your 24.0% rate — not tax advice; consult a CPA.
Schools (NCES district)
- District
- Springville Union Elementary
- NCES district ID
- 0637770
- Math proficiency
- 44% ▲ 4.00%
- Reading proficiency
- 52% ▲ 1.00%
- Median HH income
- $53,881
- Composite
- 43.58/100
- National rank
- #6431
- State rank
- #476 of 1400 in CA
Livability — Camp Nelson
- Score
- 25/100
- State rank
- #1489
- US rank
- #27998
Category grades
Schools grade is shown separately in the Schools card above.
Census & demographics
- Census place
- Camp Nelson, CA
- Population (ZIP)
- 3,532
Population outlook (Tulare County) Hauer SSP2
- Today (2025)
- 484,681 people
- By 2030
- 496,241 · +2.4%
- By 2040
- 518,507 · +7.0%
- By 2050
- 534,920 · +10.4%
- By 2075
- 548,417 · +13.2%
- By 2100
- 513,085 · +5.9%
Race, ethnicity, and origin ACS 2023
- Neighborhood character
- Majority White (64%)
- Race & ethnicity
- White 64% Hispanic / Latino 22% Two or more races 19% Asian 6% Pacific Islander 1%
- Hispanic origin (detail)
- Mexican 21%
- Common ancestry
- Slovak 2% Iranian 2% Scottish 1%
- Foreign-born
- 4% · Canada, Guatemala, South Korea
- Languages at home
- 92% English-only · Spanish 4% Tagalog/Filipino 3% Other Asian/Pacific 1%
Political lean MEDSL · Tulare
- 2024 margin
- Strong R (+20.7) · D 38.5% · R 59.2% · Other 2.3%
- 2008→2024 swing
- -5.4pp toward R · 2008: -15.3pp · 2024: -20.7pp
- All cycles
- 2024: R+20.7 2020: R+7.8 2016: R+12.1 2012: R+17.8 2008: R+15.3
Not yet ingested
- Civics
- —
Market trends
- HPI YoY
- ▲ 30.24%
- Current HPI
- 361.9818
- Rent YoY
- —
- Metro
- —
- State GDP YoY
- ▲ 3.21%
- F500 in state
- 116
Industry mix (Fortune 500 HQ in CA)
| Industry | F500 HQs | Revenue |
|---|---|---|
| Technology | 27 | $1,492B |
|
||
| Financial Services | 3 | $174B |
|
||
| Retail | 3 | $44B |
|
||
| Insurance | 3 | $26B |
|
||
| Media / Entertainment | 2 | $115B |
|
||
| Pharmaceuticals / Biotech | 2 | $62B |
|
||
Price history
+129.5% since first listed4 events — show timeline
- 2026-06-05 Listed $218,000 TCMLS
- 2019-11-14 Sold (Public Records) $172,000 Public Records
- 2007-08-31 Sold (Public Records) $255,000 Public Records
- 2000-08-23 Sold (Public Records) $95,000 Public Records
Property tax history
-3.1%/yrLatest (2025): $2,001 · +3.5% YoY. Source: county tax records.
Cash-flow waterfall
monthlySold comps — $/sqft
last 12 mo · ≤1 miLoading sold comps…