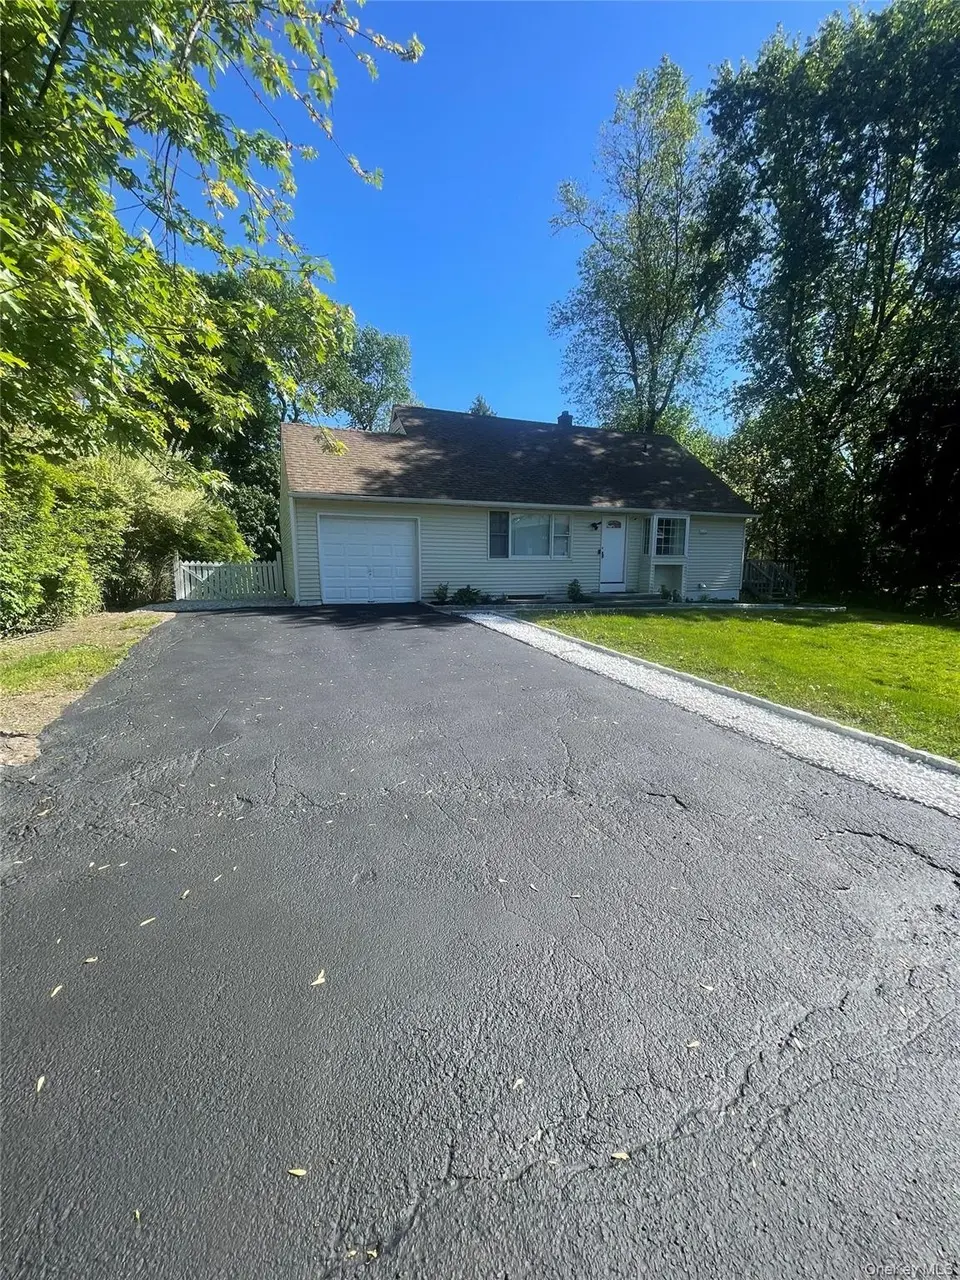
785 Locksley Rd · Jefferson Valley-Yorktown, NY
Flood risk 1/10 · Minimal
- FEMA flood zone
- A
- Chance of flooding over 30 yrs
- 0.0%
- Est. flood insurance / yr
- $1,009 – $1,996
Fire risk 2/10 · Minimal
- Est. fire insurance / yr
- $691 – $1,283
Heat risk 5/10 · Moderate
- Hot days now (above 98°F)
- 7 days/yr
- Hot days in 30 yrs
- 15 days/yr
Wind risk 4/10 · Minor
- Chance of severe wind over 30 yrs
- 19.0%
Air-quality risk 3/10 · Minor
- Unhealthy air days now
- 2 days/yr
- Unhealthy air days in 30 yrs
- 5 days/yr
Risk factors via First Street. Map © Google.
Why this score? — see what drove the D grade
The composite is a weighted blend of 9 inputs, each scored 0–100. Each bar is that input's sub-score; the figure is the points it added to the 100-point composite (weight × sub-score).
- ARV discount +15.0/15.0
- Cash flow +7.9/30.0
- Schools +6.6/10.0
- 1% rule +2.9/10.0
- Rent growth +2.5/5.0
- Livability +2.5/5.0
- Condition / age +2.5/5.0
- DSCR +1.9/10.0
- Appreciation +0.0/10.0
$629,000
🖨 Deal sheet 📄 Offer letter ✓ Due diligence
Listing remarks
Nestled along a picturesque, tree-lined street on more than a quarter of an acre, this sun-drenched 4-bedroom, 2-bathroom home is the epitome of timeless class blended seamlessly with modern convenience. From the moment you arrive, you’ll be captivated by its warmth, charm, and exceptional attention to detail. At the heart of the home is a custom chef’s kitchen featuring elegant quartz countertops, stainless steel appliances, and thoughtfully designed space perfect for both everyday living and entertaining. Beautifully finished hardwood floors flow throughout, complemented by refined crown moldings and two newly renovated, luxurious bathrooms that offer spa-like comfort. The inv
Key facts
- Quartz countertops
- Custom chefs kitchen
- Crown moldings
Tags
Neighborhood map
What this means for you Summary
Snapshot
- This is a 4-bed/2.0-bath single-family listed at $629k.
Deal economics
- At list price, monthly cash flow is $-807 ($-10k/yr) — negative.
- To cash-flow at today's rent, offer at most $486k (22.7% below list).
- To meet the 1% rule (rent ≥ 1% of price), the offer needs to be $500k (20.5% below list).
- Recommended offer: $486k (22.7% below list) — sets the bar for cash-flow.
- Cap rate 5.0% vs local median 2.8% in Jefferson Valley-Yorktown — top-decile yield for the area; either an underpriced asset or a hidden risk that comps aren't pricing in. Stress-test before assuming the spread holds.
Location & tenants
- Location reads: area grade D — affects rentability + tenant quality, not the cash-flow math above.
- Yorktown Central School District (rural): math 67% / reading 73% proficiency, ranked #83 of 590 in NY (top 14%) — strong family-tenant draw, lease renewals of 3-5y typical; only 5% free/reduced lunch — higher-income household profile.
- Market conditions: 160 active listings in the ZIP; 2 comparable units currently listed for rent nearby; 954 units permitted in Westchester County in 2024 (649 in 5+ unit buildings).
Forward outlook
- Local home prices are declining (-3.0%/yr); year-one equity from $4k of loan paydown is wiped out by about $19k of value loss. Plan a longer hold.
- Westchester County population projected at +10% by 2050 — modest demand growth; plan on rents tracking national, not racing it.
Negotiation context
- It's been on market 80 days — a 6% lower offer ($591k) is reasonable based on typical stale-listing flexibility.
- 2 sale attempts; this cycle's ask has dropped $70k (10%) from the opening price — seller is motivated, your offer sets the floor, not the list.
- Current owner paid $450k; 40% above their basis — modest negotiation headroom, anchor on the comps not their cost.
Risks & watch-outs
- Watch-outs: flood insurance adds $125/mo; built in 1953 — expect roof / HVAC / electrical / plumbing capex.
- Climate carrying-cost: in FEMA flood zone A (mandatory federal flood insurance); extreme-heat days projected 7→15/yr by 2055 (HVAC capex compounding) — expect insurance premiums to compound above CPI over the hold.
Questions for the listing agent
- What do current leases actually rent for vs. the listed asking? Can we see a recent rent roll and the last 12 months of T-12 income?
- It's been on market 80 days. Have you received any prior offers? Is the seller open to a 23% concession, seller financing, or rate buy-down credit?
- Built in 1953 — when were the roof, HVAC, electrical panel, plumbing, and water heater last replaced?
- What's the actual annual flood-insurance premium (NFIP or private), and is the property in a SFHA with mandatory coverage?
- Why hasn't it sold? Are there any deal-killer items the seller is aware of (foundation, flood, title, zoning, code violations)?
- Is there a deadline driving the sale (1031 exchange, divorce, estate, relocation)? That informs how much negotiation room exists.
- The area grade is low — what's the realistic commute time and amenity access for the typical tenant pool here? Any planned neighborhood developments (good or bad) we should know about?
- What's the average days-on-market for RENTAL listings here right now (not sales)? A rising rental-DOM trend means longer vacancies and softer asking-rent achievability than the comps imply.
- What's the recent tenant-quality profile in this submarket — average credit score on applications, eviction rate, late-payment / NSF rate, and stable-employment percentage? A property-management company in the area should have these aggregated.
- How much new for-sale + rental construction is in the pipeline within 1–3 miles? Heavy new supply typically softens prices + rents 12–24 months out; constrained supply supports both.
Investment metrics
- 1% rule
- 0.79% ✗
- Cap rate
- 4.99%
- Cash-on-cash
- -4.65%
- DSCR
- 0.79
- GRM
- 10.5
CMA / ARV
- ARV (median comp)
- $798,215
- List price
- $629,000
- Delta
- -21.20%
- Verdict
- UNDERPRICED
- Comps
- 20 within 1.0 mi
Show comp detail 11 sales within ~0.75 mi
| Address | Dist | Beds/Ba | Sqft | Sold | Price | $/sf | Match |
|---|---|---|---|---|---|---|---|
| 804 Fox Meadow Rd | 0.20mi | 3/1.5 (-1) | 1,671 (-4%) | 10mo | $735,000 | $440 | 69 |
| 2796 Larkspur St | 0.51mi | 4/2.0 | 1,750 (+1%) | 12mo | $580,000 | $331 | 64 |
| 990 Lester Rd | 0.48mi | 3/1.5 (-1) | 1,724 (-1%) | 9mo | $745,000 | $432 | 62 |
| 2764 Old Yorktown Rd | 0.34mi | 3/1.5 (-1) | 1,620 (-7%) | 15mo | $680,500 | $420 | 54 |
| 2766 Cecile Dr | 0.40mi | 4/2.0 | 1,548 (-11%) | 12mo | $675,309 | $436 | 53 |
| 2710 Crompond Rd | 0.31mi | 3/2.0 (-1) | 1,853 (+7%) | 22mo | $720,000 | $389 | 51 |
| 705 Toni Ct | 0.33mi | 3/2.5 (-1) | 1,850 (+7%) | 23mo | $840,000 | $454 | 48 |
| 610 Granite Springs Rd | 0.73mi | 3/2.0 (-1) | 1,620 (-7%) | 5mo | $620,000 | $383 | 46 |
| 2795 Moreland St | 0.42mi | 5/3.0 (+1) | 1,950 (+12%) | 11mo | $630,000 | $323 | 42 |
| 520 Elizabeth Rd | 0.71mi | 3/1.5 (-1) | 1,530 (-12%) | 6mo | $665,000 | $435 | 35 |
| 2797 Carr Ct | 0.66mi | 3/2.0 (-1) | 1,500 (-14%) | 21mo | $695,000 | $463 | 24 |
Match score weights: distance 35% · size 25% · config 20% · recency 20%. Top-matched comps best support the ARV.
Projected returns pro-forma
-3.0% appreciation · 3.0% rent growth · sell at horizon
- IRR
- -25.6%
- Equity multiple
- 0.13×
- Total profit
- $-152,995
- Equity at exit
- $93,786
- IRR
- -21.8%
- Equity multiple
- -0.12×
- Total profit
- $-198,077
- Equity at exit
- $54,384
Cash invested: $176,120 (down + closing). Projections, not guarantees.
Landlord ↔ Tenant lean methodology
- Overall (STATE)
- 15 Strongly Tenant-Friendly
- State New York
- 15 Strongly Tenant-Friendly · D+10
- County
- — inherits STATE
- City
- — inherits STATE
ZIP-level market 10598
- Active inventory
- 160
- Price-to-rent
- 10.5×
Monthly cashflow live
- Estimated rent
- $5,000 medium interval (Pro) →
- Mortgage (P&I)
- −$3,299
- Tax from tax record
- −$1,071 /mo · $12,854/yr
- Insurance
- −$262
- Flood insurance flood zone
- −$125 /mo · $1,502/yr
- HOA
- −$0
- Vacancy / Maint / Mgmt
- −$1,050
- Net cashflow
- $-807
Break-even live
UW: 25.0% down · 7.5% · 30yr · 1.5% tax · 5.0% vac · 8.0% maint · 8.0% mgmt
Financing live
Cash to close
- Down payment
- $157,250
- Closing costs
- $18,870
- Reserves months
- —
- Total cash needed
- —
Loan-product check · same deal, 3 products live
Conventional
25% down · 7.5% · 30yr
- Down + closing
- —
- Monthly P&I
- —
- Monthly cashflow
- —
- DSCR
- —
- Eligible?
- —
Personal DTI + credit; lowest rate.
DSCR
20% down · 8.5% · 30yr
- Down + closing
- —
- Monthly P&I
- —
- Monthly cashflow
- —
- DSCR
- —
- Eligible?
- —
No personal income docs; deal must DSCR.
Hard money
10% down · 12.0% · 12mo
- Down + closing
- —
- Monthly P&I
- —
- Monthly cashflow
- —
- DSCR
- —
- Eligible?
- —
Short-term bridge; refi at stabilization.
Rent comps 2 comps
| Address | Beds | Baths | Sqft | Rent | $/sqft | DOM | Units | Dist |
|---|---|---|---|---|---|---|---|---|
| 2796 Old Yorktown Rd Yorktown Heights, NY | 3.0 | 2.0 | 1531 | $5,000 | $3.27 | 1d | 1 | 0.38mi |
| 2662 Dunning Dr Yorktown Heights, NY | 4.0 | 1.0 | 1800 | $5,000 | $2.78 | 1d | 1 | 1.08mi |
Listing history 16 events
-
2026-06-13days on market $629,000 Active 80 DOM
-
2026-06-09days on market $629,000 Active 77 DOM
-
2026-06-08days on market $629,000 Active 76 DOM
-
2026-06-07days on market $629,000 Active 75 DOM
-
2026-06-04days on market $629,000 Active 72 DOM
-
2026-06-03days on market $629,000 Active 71 DOM
-
2026-06-02days on market $629,000 Active 70 DOM
-
2026-06-01days on market $629,000 Active 69 DOM
-
2026-05-31days on market $629,000 Active 68 DOM
-
2026-05-12status Active
-
2026-05-12price $629,000
-
2026-03-30price $650,000
-
2026-03-09price $675,000
-
2026-02-20$699,000 Active
-
2026-01-15soldstatus $450,000
-
2021-04-09soldstatus $300,000
ⓘ Source: listings_history table (triggers on properties + properties_extension) + one-shot
backfill from property_details.listing_events for pre-trigger history.
Tax reassessment forecast NY · Partial reset (capped growth)
- Current annual tax
- $12,854 · $1,071/mo
- Projected year-2 tax
- $12,854 · $1,071/mo
- Expected delta
- $0/yr ($0/mo · 0.0%)
ⓘ Screening estimate from a state-policy table — verify with the county assessor before closing.
Climate risk First Street
- Flood 1/10 Low FEMA zone A · 0% chance over 30 yrs
- Wildfire 2/10 Low
- Heat 5/10 Major 7 d/yr ≥98°F today · 15 d/yr by 30 yrs out
- Wind 4/10 Moderate 19% chance of damaging wind over 30 yrs
- Air quality 3/10 Moderate 2 unhealthy d/yr today · 5 by 30 yrs out
Nearby sold comps map
Loading sold comps map…
Walkable amenities ~0.75 mi
Loading nearby amenities…
Taxation est. · year 1
- Rental income
- $60,000
- − Mortgage interest
- −$35,234
- − Property taxes
- −$12,854
- − Insurance
- −$4,648
- − Repairs & maintenance
- −$4,800
- − Management
- −$4,800
- − Depreciation
- −$18,298
- Taxable loss
- −$20,633
- Est. tax savings @ 24.0%
- +$4,952
- After-tax cash flow
- $-4,732/yr
For passive investors: Depreciation is non-cash, so a rental often shows a tax loss while cash-flowing — sheltering income. Rental losses are passive: they offset passive income freely, and up to $25,000/yr can offset ordinary (W-2) income if you actively participate and your MAGI is under $100k (phasing out to $0 by $150k); unused losses carry forward. On sale, claimed depreciation is recaptured at up to 25%, and gains may owe capital-gains tax (a 1031 exchange can defer both). Figures are a year-1 estimate at your 24.0% rate — not tax advice; consult a CPA.
Schools (NCES district)
- District
- Yorktown Central School District
- NCES district ID
- 3631980
- Math proficiency
- 67% ▼ -4.00%
- Reading proficiency
- 73% ▲ 7.00%
- Median HH income
- $117,838
- Composite
- 65.83/100
- National rank
- #454
- State rank
- #83 of 590 in NY
Livability — Jefferson Valley-Yorktown
No livability data for this city. (Only ~50 U.S. cities are tracked.)
Census & demographics
- Census place
- Jefferson Valley-Yorktown, NY
- City population
- 323
- Population (ZIP)
- 28,894
Population outlook (Westchester County) Hauer SSP2
- Today (2025)
- 1,028,035 people
- By 2030
- 1,051,636 · +2.3%
- By 2040
- 1,098,520 · +6.9%
- By 2050
- 1,136,044 · +10.5%
- By 2075
- 1,196,925 · +16.4%
- By 2100
- 1,175,147 · +14.3%
Race, ethnicity, and origin ACS 2023
- Neighborhood character
- Predominantly White (74%)
- Race & ethnicity
- White 74% Hispanic / Latino 14% Two or more races 7% Black 5% Asian 4%
- Hispanic origin (detail)
- Puerto Rican 6% Dominican 2%
- Common ancestry
- Romanian 5% Scotch-Irish 2% Slovak 2%
- Foreign-born
- 12% · Canada, Jamaica, China
- Languages at home
- 82% English-only · Spanish 8% Other Indo-European 5% Other Asian/Pacific 1%
Political lean MEDSL · Westchester
- 2024 margin
- Strong D (+26.3) · D 63.1% · R 36.9%
- 2008→2024 swing
- -1.3pp toward R · 2008: 27.6pp · 2024: 26.3pp
- All cycles
- 2024: D+26.3 2020: D+36.3 2016: D+32.8 2012: D+22.2 2008: D+27.6
Not yet ingested
- Civics
- —
Market trends
- HPI YoY
- ▼ -580.71%
- Current HPI
- 248.9112
- Rent YoY
- —
- Metro
- —
- State GDP YoY
- ▲ 2.60%
- F500 in state
- 92
Industry mix (Fortune 500 HQ in NY)
| Industry | F500 HQs | Revenue |
|---|---|---|
| Financial Services | 10 | $950B |
|
||
| Consumer Goods | 9 | $162B |
|
||
| Insurance | 4 | $225B |
|
||
| Telecommunications | 2 | $144B |
|
||
| Pharmaceuticals | 2 | $112B |
|
||
| Media / Entertainment | 2 | $69B |
|
||
Price history
+109.7% since first listed7 events — show timeline
- 2026-05-12 Relisted — OneKey® MLS as Distributed by MLS Grid
- 2026-05-12 Price Changed $629,000 OneKey® MLS as Distributed by MLS Grid
- 2026-03-30 Price Changed $650,000 OneKey® MLS as Distributed by MLS Grid
- 2026-03-09 Price Changed $675,000 OneKey® MLS as Distributed by MLS Grid
- 2026-02-20 Listed $699,000 OneKey® MLS as Distributed by MLS Grid
- 2026-01-15 Sold (Public Records) $450,000 Public Records
- 2021-04-09 Sold (Public Records) $300,000 Public Records
Property tax history
+6.7%/yrLatest (2025): $12,854 · +7.5% YoY. Source: county tax records.
Cash-flow waterfall
monthlySold comps — $/sqft
last 12 mo · ≤1 miLoading sold comps…