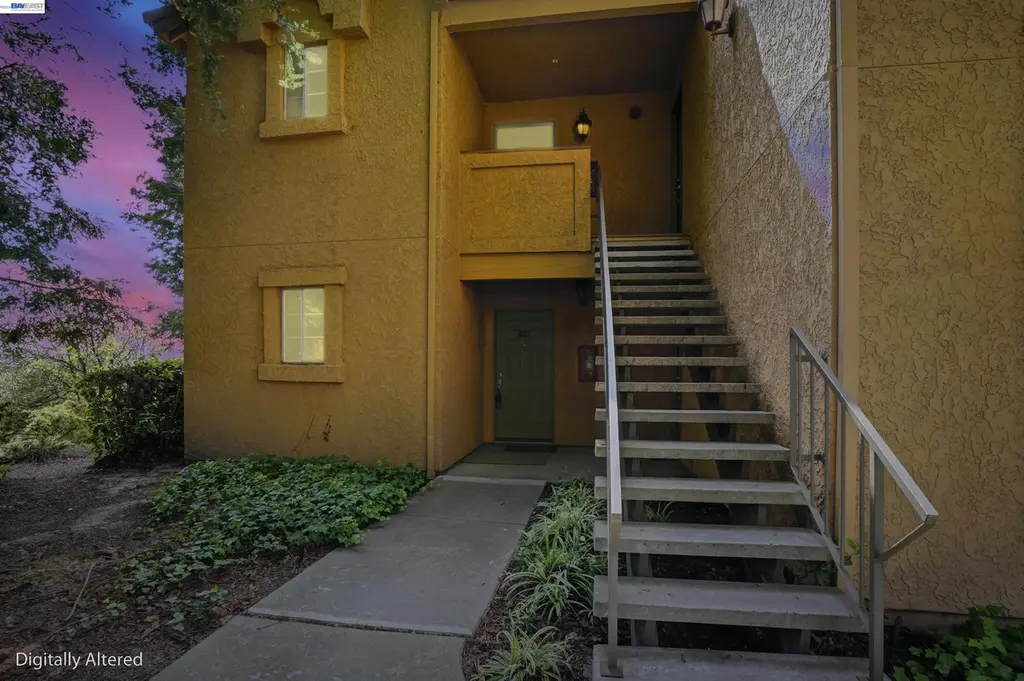
735 Watson Canyon Ct #218 · San Ramon, CA
Flood risk 1/10 · Minimal
- FEMA flood zone
- X (unshaded)
- Chance of flooding over 30 yrs
- 0.0%
- Est. flood insurance / yr
- $507 – $1,088
Fire risk 6/10 · Moderate
- Est. fire insurance / yr
- $659 – $1,223
Heat risk 3/10 · Minor
- Hot days now (above 97°F)
- 7 days/yr
- Hot days in 30 yrs
- 14 days/yr
Wind risk 1/10 · Minimal
- Chance of severe wind over 30 yrs
- —
Air-quality risk 8/10 · Major
- Unhealthy air days now
- 15 days/yr
- Unhealthy air days in 30 yrs
- 16 days/yr
Risk factors via First Street. Map © Google.
Why this score? — see what drove the D grade
The composite is a weighted blend of 9 inputs, each scored 0–100. Each bar is that input's sub-score; the figure is the points it added to the 100-point composite (weight × sub-score).
- ARV discount +14.4/15.0
- Schools +7.6/10.0
- Cash flow +5.7/30.0
- Livability +4.3/5.0
- Appreciation +3.2/10.0
- Rent growth +3.2/5.0
- Condition / age +2.5/5.0
- 1% rule +2.3/10.0
- DSCR +0.1/10.0
$345,000
🖨 Deal sheet (PDF) 📄 Offer letter ✓ Due diligence
Listing remarks
Your perfect first home starts here at 735 Watson Canyon Ct #218 in San Ramon, CA. Stepping into homeownership just got a whole lot easier on this top end unit studio condo with amazing views. Welcome to this bright and thoughtfully designed studio condo in one of San Ramon’s most sought-after gated communities, the ideal place to begin your journey as a first-time buyer or if you are downsizing. This smartly laid out 428 sq ft home makes the most of every inch. The open living space feels airy and welcoming. A full bathroom and kitchen give you everything you need without the upkeep of a larger home. Built in 1988 this home offers the low-maintenance lifestyle first-time buyers love.
Key facts
- Top end unit
- Gated communities
- Unbeatable location
Tags
Property features AI
Finance
- HOA & community: Community clubhouse; Fitness center; Pool; Sauna; BBQ area; Guest parking; Monthly HOA fee of $468 (includes reserves, management fee, common area maintenance, exterior maintenance)
Exterior
- Parking: Carport
- Utilities: Public water; Public sewer
- Home design: Condominium; Residential property; Built in 1988
- Construction: Stucco construction
- Exterior features: No yard; In-ground community pool
Interior
- Kitchen: Dishwasher; Microwave; Free‑standing range; Refrigerator
- Bedrooms: 2 rooms (includes bedroom/other room configuration)
- Flooring: Wood flooring
- Bathrooms: 1 full bathroom
- Heating & cooling: Wall furnace heating; Wall/window air conditioning units
- Interior features: Stone countertops; No yard
- Laundry & utility: Common area laundry
Neighborhood map
What this means for you Summary
Snapshot
- This is a 1-bed/1.0-bath condo listed at $345k.
Deal economics
- At list price, monthly cash flow is $-711 ($-9k/yr) — negative.
- To cash-flow at today's rent, offer at most $219k (36.4% below list).
- To meet the 1% rule (rent ≥ 1% of price), the offer needs to be $252k (26.9% below list).
- Recommended offer: $219k (36.4% below list) — sets the bar for cash-flow.
- Cap rate 3.8% vs local median 1.4% in San Ramon — top-decile yield for the area; either an underpriced asset or a hidden risk that comps aren't pricing in. Stress-test before assuming the spread holds.
Location & tenants
- Location reads 86/100 on livability (#4 in CA, #370 nationally) — a professional / high-income tenant draw. Strengths: crime A+, amenities A+, commute A+; Watch: cost of living F.
- San Ramon Valley Unified (suburban): math 77% / reading 81% proficiency, ranked #28 of 1,400 in CA (top 2%) — strong family-tenant draw, lease renewals of 3-5y typical; only 3% free/reduced lunch — higher-income household profile.
- Zoned schools: Golden View Elementary (math 10% / reading 30%, grade F, #1,242 of 1,571 statewide, top 80%, 643 students, 8% FRL); Iron Horse Middle (1,009 students, 7% FRL); California High (math 90% / reading 90%, grade A+, #11 of 1,170 statewide, top 1%, 2,879 students, 8% FRL) — zoned schools at 7% FRL track the district average.
- Zoned-school proficiency averages 55% at this address vs 79% district-wide (-24 pts) — the specific schools serving this property underperform the San Ramon Valley Unified average; the district grade overstates school quality for this exact location.
- Market conditions: Rents rising (+2.6%/yr); 128 active listings in the ZIP; 2 comparable units currently listed for rent nearby; high-income renter base; 2,169 units permitted in Contra Costa County in 2024 (896 in 5+ unit buildings).
- This rent is only 14% of the median local income ($215k/yr) — well below the 30% rent-burden line; pricing power to push rent on renewal without tenant pushback.
Forward outlook
- Local home prices are declining (-3.0%/yr); year-one equity from $2k of loan paydown is wiped out by about $10k of value loss. Plan a longer hold.
- Contra Costa County population projected at +26% by 2050 — long-run rental-demand tailwind backs the buy-and-hold thesis.
Negotiation context
- It's been on market 34 days — a 3% lower offer ($335k) is reasonable based on typical stale-listing flexibility.
- 2 sale attempts since 20y ago with the ask held roughly flat each time — persistent listings suggest the price (not the market) is what's stuck; bring a comps-based counter.
Risks & watch-outs
- Climate carrying-cost: major wildfire risk — expect insurance premiums to compound above CPI over the hold.
Questions for the listing agent
- What do current leases actually rent for vs. the listed asking? Can we see a recent rent roll and the last 12 months of T-12 income?
- It's been on market 34 days. Have you received any prior offers? Is the seller open to a 36% concession, seller financing, or rate buy-down credit?
- What does the HOA fee cover, when was the last increase, and are there any pending special assessments or reserve-fund shortfalls?
- Any open or pending special assessments — roof, HVAC, plumbing, elevator, façade? What's the per-unit balance and payoff schedule, and is the seller paying it off at close or rolling it to the buyer?
- Is there a deadline driving the sale (1031 exchange, divorce, estate, relocation)? That informs how much negotiation room exists.
- Schools are A-rated — typically a magnet for longer-tenancy family renters. What's the average tenant stay here, and is there a school-zone premium baked into asking?
- The area grade is low — what's the realistic commute time and amenity access for the typical tenant pool here? Any planned neighborhood developments (good or bad) we should know about?
- What's the average days-on-market for RENTAL listings here right now (not sales)? A rising rental-DOM trend means longer vacancies and softer asking-rent achievability than the comps imply.
- What's the recent tenant-quality profile in this submarket — average credit score on applications, eviction rate, late-payment / NSF rate, and stable-employment percentage? A property-management company in the area should have these aggregated.
- How much new apartment / multifamily construction is in the pipeline within 1–3 miles? Heavy new supply (>2% of stock underway) typically softens rents 12–24 months out; light construction supports rent growth.
Investment metrics
- 1% rule
- 0.73% ✗
- Cap rate
- 3.82%
- Cash-on-cash
- -8.83%
- DSCR
- 0.61
- GRM
- 11.4
CMA / ARV
- ARV (median comp)
- $407,686
- List price
- $345,000
- Delta
- -8.02%
- Verdict
- FAIR
- Comps
- 4 within 1.0 mi
Projected returns pro-forma
-3.0% appreciation · 2.61% rent growth · sell at horizon
- IRR
- -32.3%
- Equity multiple
- -0.06×
- Total profit
- $-101,934
- Equity at exit
- $51,441
- IRR
- -39.7%
- Equity multiple
- -0.55×
- Total profit
- $-150,126
- Equity at exit
- $29,829
Cash invested: $96,600 (down + closing). Projections, not guarantees.
Landlord ↔ Tenant lean methodology
- Overall (STATE)
- 18 Strongly Tenant-Friendly
- State California
- 18 Strongly Tenant-Friendly · D+13
- County
- — inherits STATE
- City
- — inherits STATE
ZIP-level market 94582
- Home prices YoY
- -1.0%
- Rents YoY
- 2.6%
- Active inventory
- 128
- Price-to-rent
- 11.4×
Monthly cashflow live
- Estimated rent
- $2,521 medium interval (Pro) →
- Mortgage (P&I)
- −$1,809
- Tax from tax record
- −$282 /mo · $3,380/yr
- Insurance
- −$144
- HOA
- −$468
- Vacancy / Maint / Mgmt
- −$529
- Net cashflow
- $-711
Break-even live
Sensitivity live
| Price | -10% $-516 | -5% $-613 | +0% $-711 | +5% $-809 | +10% $-906 |
|---|---|---|---|---|---|
| Rent | -10% $-910 | -5% $-810 | +0% $-711 | +5% $-611 | +10% $-512 |
| Rate | -1.0pp $-537 | -0.5pp $-623 | base $-711 | +0.5pp $-800 | +1.0pp $-891 |
UW: 25.0% down · 7.5% · 30yr · 1.5% tax · 5.0% vac · 8.0% maint · 8.0% mgmt
Financing live
Cash to close
- Down payment
- $86,250
- Closing costs
- $10,350
- Reserves months
- —
- Total cash needed
- —
Loan-product check · same deal, 3 products live
Conventional
25% down · 7.5% · 30yr
- Down + closing
- —
- Monthly P&I
- —
- Monthly cashflow
- —
- DSCR
- —
- Eligible?
- —
Personal DTI + credit; lowest rate.
DSCR
20% down · 8.5% · 30yr
- Down + closing
- —
- Monthly P&I
- —
- Monthly cashflow
- —
- DSCR
- —
- Eligible?
- —
No personal income docs; deal must DSCR.
Hard money
10% down · 12.0% · 12mo
- Down + closing
- —
- Monthly P&I
- —
- Monthly cashflow
- —
- DSCR
- —
- Eligible?
- —
Short-term bridge; refi at stabilization.
Rent comps 2 comps
| Address | Beds | Baths | Sqft | Rent | $/sqft | DOM | Units | Dist |
|---|---|---|---|---|---|---|---|---|
| 2100 Camino Ramon San Ramon, CA | — | 1.0 | 300 | $2,309 | $7.70 | 7d | 1 | 1.23mi |
| 18000 San Ramon Valley Blvd San Ramon, CA | — | 1.0 | 270 | $2,699 | $10.00 | 3d | 1 | 1.40mi |
HOA detail condo
- Monthly dues
- $468 · $5,616/yr
- Likely covers
- security
- Assessments
- None detected in remarks — confirm with the listing agent.
Listing history 22 events
-
2026-06-21days on market $345,000 Active 34 DOM
-
2026-06-18days on market $345,000 Active 31 DOM
-
2026-06-17price $345,000 Active 30 DOM
-
2026-06-17days on market $352,995 Active 30 DOM
-
2026-06-16days on market $352,995 Active 29 DOM
-
2026-06-15days on market $352,995 Active 28 DOM
-
2026-06-13days on market $352,995 Active 26 DOM
-
2026-06-13days on market $352,995 Active 25 DOM
-
2026-06-09days on market $352,995 Active 22 DOM
-
2026-06-08days on market $352,995 Active 21 DOM
-
2026-06-07days on market $352,995 Active 20 DOM
-
2026-06-04days on market $352,995 Active 17 DOM
-
2026-06-03days on market $352,995 Active 16 DOM
-
2026-06-02days on market $352,995 Active 15 DOM
-
2026-06-01days on market $352,995 Active 14 DOM
-
2026-05-31days on market $352,995 Active 13 DOM
-
2026-05-18$352,995 Active 960-char remark
-
2026-05-04historical
-
2026-04-14historical
-
2006-09-22historical
-
2006-08-18price
-
2006-08-06
ⓘ Source: listings_history table (triggers on properties + properties_extension) + one-shot
backfill from property_details.listing_events for pre-trigger history.
Tax reassessment forecast CA · Resets to sale price
- Current annual tax
- $3,380 · $282/mo
- Projected year-2 tax
- $3,380 · $282/mo
- Expected delta
- $0/yr ($0/mo · 0.0%)
ⓘ Screening estimate from a state-policy table — verify with the county assessor before closing.
Climate risk First Street
- Flood 1/10 Low FEMA zone X (unshaded) · 0% chance over 30 yrs
- Wildfire 6/10 Major
- Heat 3/10 Moderate 7 d/yr ≥97°F today · 14 d/yr by 30 yrs out
- Wind 1/10 Low
- Air quality 8/10 Severe 15 unhealthy d/yr today · 16 by 30 yrs out
Nearby sold comps map
Loading sold comps map…
Walkable amenities ~0.75 mi
Loading nearby amenities…
Taxation est. · year 1
- Rental income
- $30,255
- − Mortgage interest
- −$19,325
- − Property taxes
- −$3,380
- − Insurance
- −$1,725
- − Repairs & maintenance
- −$2,420
- − Management
- −$2,420
- − HOA
- −$5,616
- − Depreciation
- −$10,036
- Taxable loss
- −$14,669
- Est. tax savings @ 24.0%
- +$3,521
- After-tax cash flow
- $-5,010/yr
For passive investors: Depreciation is non-cash, so a rental often shows a tax loss while cash-flowing — sheltering income. Rental losses are passive: they offset passive income freely, and up to $25,000/yr can offset ordinary (W-2) income if you actively participate and your MAGI is under $100k (phasing out to $0 by $150k); unused losses carry forward. On sale, claimed depreciation is recaptured at up to 25%, and gains may owe capital-gains tax (a 1031 exchange can defer both). Figures are a year-1 estimate at your 24.0% rate — not tax advice; consult a CPA.
Schools (NCES district)
- District
- San Ramon Valley Unified
- NCES district ID
- 0635130
- Math proficiency
- 77% ▬ 0.00%
- Reading proficiency
- 81% ▼ -1.00%
- Median HH income
- $138,331
- Composite
- 76.08/100
- National rank
- #216
- State rank
- #28 of 1400 in CA
Livability — San Ramon
- Score
- 86/100
- State rank
- #4
- US rank
- #370
Category grades
Schools grade is shown separately in the Schools card above.
Census & demographics
- Census place
- San Ramon, CA
- County
- Contra Costa County · 1,059,880 people
- City population
- 87,007
- Metro
- San Francisco-Oakland-Berkeley, CA
- Population (ZIP)
- 47,424
- Household income
- $214,677
- Rent vs Own
- Severe rent burden
- 1281.0
Population outlook (Contra Costa County) Hauer SSP2
- Today (2025)
- 1,287,720 people
- By 2030
- 1,364,937 · +6.0%
- By 2040
- 1,506,209 · +17.0%
- By 2050
- 1,624,373 · +26.1%
- By 2075
- 1,853,193 · +43.9%
- By 2100
- 1,901,231 · +47.6%
Race, ethnicity, and origin ACS 2023
- Neighborhood character
- Diverse neighborhood (Simpson 0.57)
- Race & ethnicity
- Asian 60% White 25% Two or more races 7% Hispanic / Latino 5% Black 4%
- Hispanic origin (detail)
- Mexican 3%
- Common ancestry
- Italian 2% Russian 1% Lithuanian 1%
- Foreign-born
- 44% · China, South Korea, Vietnam
- Languages at home
- 47% English-only · Other Indo-European 16% Other Asian/Pacific 13% Chinese 12%
Political lean MEDSL · Contra Costa
- 2024 margin
- Solid D (+38.0) · D 67.3% · R 29.4% · Other 3.3%
- 2008→2024 swing
- +0.2pp no change · 2008: 37.8pp · 2024: 38.0pp
- All cycles
- 2024: D+38.0 2020: D+45.3 2016: D+43.5 2012: D+33.7 2008: D+37.8
Not yet ingested
- Civics
- —
Market trends
- HPI YoY
- ▼ -3.67%
- Current HPI
- 353.0802
- Rent YoY
- ▲ 2.61%
- Metro
- San Francisco-Oakland-Berkeley, CA
- State GDP YoY
- ▲ 3.21%
- F500 in state
- 116
Industry mix (Fortune 500 HQ in CA)
| Industry | F500 HQs | Revenue |
|---|---|---|
| Technology | 27 | $1,492B |
|
||
| Financial Services | 3 | $174B |
|
||
| Retail | 3 | $44B |
|
||
| Insurance | 3 | $26B |
|
||
| Media / Entertainment | 2 | $115B |
|
||
| Pharmaceuticals / Biotech | 2 | $62B |
|
||
Price history
-2.3% since first listed7 events — show timeline
- 2026-06-17 Price Changed $345,000 bridgeMLS, Bay East AOR, or Contra Costa AOR
- 2026-05-18 Listed $352,995 bridgeMLS, Bay East AOR, or Contra Costa AOR
- 2026-05-04 Listing Removed — bridgeMLS, Bay East AOR, or Contra Costa AOR
- 2026-04-14 Coming Soon — bridgeMLS, Bay East AOR, or Contra Costa AOR
- 2006-09-22 Listing Removed — bridgeMLS, Bay East AOR, or Contra Costa AOR
- 2006-08-18 Price Changed — bridgeMLS, Bay East AOR, or Contra Costa AOR
- 2006-08-06 Listed — bridgeMLS, Bay East AOR, or Contra Costa AOR
Property tax history
-0.3%/yrLatest (2025): $3,380 · +1.1% YoY. Source: county tax records.
Cash-flow waterfall
monthlySold comps — $/sqft
last 12 mo · ≤1 miLoading sold comps…