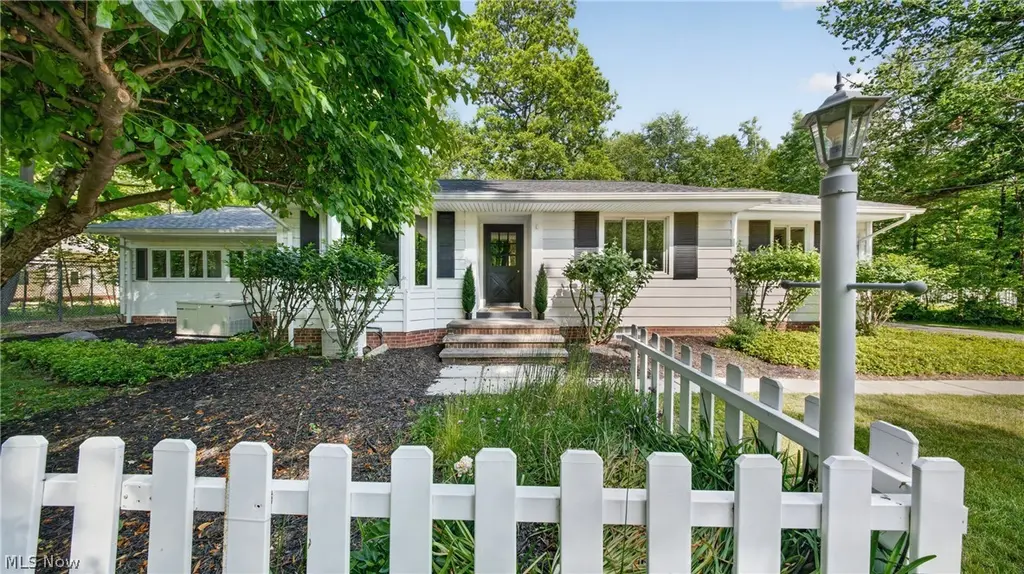
3909 Brainard Rd · Orange, OH
Flood risk 1/10 · Minimal
- FEMA flood zone
- X (unshaded)
- Chance of flooding over 30 yrs
- 0.0%
- Est. flood insurance / yr
- $473 – $860
Fire risk 1/10 · Minimal
- Est. fire insurance / yr
- $713 – $1,323
Heat risk 2/10 · Minimal
- Hot days now (above 94°F)
- 7 days/yr
- Hot days in 30 yrs
- 15 days/yr
Wind risk 1/10 · Minimal
- Chance of severe wind over 30 yrs
- —
Air-quality risk 3/10 · Minor
- Unhealthy air days now
- 2 days/yr
- Unhealthy air days in 30 yrs
- 5 days/yr
Risk factors via First Street. Map © Google.
Why this score? — see what drove the D grade
The composite is a weighted blend of 9 inputs, each scored 0–100. Each bar is that input's sub-score; the figure is the points it added to the 100-point composite (weight × sub-score).
- Cash flow +12.6/30.0
- ARV discount +7.5/15.0
- Schools +7.3/10.0
- DSCR +3.8/10.0
- Livability +3.5/5.0
- 1% rule +3.1/10.0
- Rent growth +2.8/5.0
- Condition / age +2.5/5.0
- Appreciation +0.0/10.0
$500,000
🖨 Deal sheet (PDF) 📄 Offer letter ✓ Due diligence
Listing remarks MLS
Here is your opportunity to own a little slice of heaven, sprinkled with character. Situated on 1.63 wooded acres in Orange Village, it is the original picket fence house you've been dreaming about. Features include an expansive family room and den combo, living room with wood burning fireplace, kitchen, sun room, 3 bedrooms and 2 baths. There are an abundance of windows allowing natural light to permeate throughout the home. You will be craving warmer temps to enjoy outdoor dining on your own wooden deck, and discovering your green thumb in the attached greenhouse. This home combines affordability with the option to make it your own in an ideal location offering stunning views, privacy and space to grow. Schedule your viewing today so this opportunity does not slip away! Property being sold AS IS. Seller will make no repairs.
Key facts
- 4 season room
- 1.6 acre lot
- Updated kitchen
Tags
Property features AI
Exterior
- Parking: 2-car garage; Asphalt driveway
- Security: Smoke detectors
- Utilities: Well water; Septic tank
- Home design: Single-story home; Updated / remodeled condition
- Construction: Built with HardiPlank type and vinyl siding; Asphalt/fiberglass roof; Below-grade finished area (approximately 600); Above-grade finished area (approximately 2,050)
- Exterior features: Deck; 1.63-acre lot
Interior
- Kitchen: Kitchen island; Eat-in kitchen; Stone counters; Dishwasher; Garbage disposal; Microwave; Range; Refrigerator
- Bedrooms: Three main-level bedrooms
- Bathrooms: Two full bathrooms (both on main level)
- Interior features: Built-in features; Ceiling fans; Cathedral and vaulted ceilings; Double vanity; Eat-in kitchen; Kitchen island; Stone countertops; Walk-in closets; Partially finished basement with storage space and sump pump; Fireplace (1)
- Laundry & utility: Washer and dryer
Neighborhood map
What this means for you Summary
Snapshot
- This is a 3-bed/1.5-bath single-family listed at $500k.
Deal economics
- At list price, monthly cash flow is $-64 ($-763/yr) — negative.
- To cash-flow at today's rent, offer at most $489k (2.2% below list).
- To meet the 1% rule (rent ≥ 1% of price), the offer needs to be $404k (19.2% below list).
- Recommended offer: $404k (19.2% below list) — sets the bar for 1% rule.
- Cap rate 6.1% vs local median 1.2% in Orange — top-decile yield for the area; either an underpriced asset or a hidden risk that comps aren't pricing in. Stress-test before assuming the spread holds.
Location & tenants
- Location reads 70/100 on livability (#452 in OH) — a middle-class / working-renter tenant base. Strengths: crime A+, employment A+, housing A+; Watch: cost of living D, health & safety D, amenities F.
- Orange City (suburban): math 76% / reading 83% proficiency, ranked #32 of 656 in OH (top 5%) — strong family-tenant draw, lease renewals of 3-5y typical; only 11% free/reduced lunch — higher-income household profile.
- Zoned schools: Moreland Hills Elementary School (math 84% / reading 83%, grade A+, #96 of 1,584 statewide, top 6%, 919 students, 9% FRL); Ballard Brady Middle School (math 77% / reading 84%, grade A+, #41 of 654 statewide, top 7%, 433 students, 7% FRL); Orange High School (math 57% / reading 77%, grade B, #137 of 781 statewide, top 19%, 608 students, 10% FRL) — zoned schools at 9% FRL track the district average.
- Market conditions: Rents rising (+1.1%/yr); 183 active listings in the ZIP; 2 comparable units currently listed for rent nearby; solid renter incomes; 1,441 units permitted in Cuyahoga County in 2024 (700 in 5+ unit buildings).
- At $4,038/mo this rent would consume 48% of the median local household income ($101k/yr) (locally 1294% of renters already pay >50% of income on rent) — very limited rent-growth headroom before tenants either downsize or default.
Forward outlook
- Local home prices are declining (-3.0%/yr); year-one equity from $3k of loan paydown is wiped out by about $15k of value loss. Plan a longer hold.
- Cuyahoga County population projected to shrink 8% by 2050 — rents likely to lag national; underwrite the cash flow, not the appreciation.
Negotiation context
- Only 11 days on market — expect competitive offers; lowballing is unlikely to land.
- 2 sale attempts with the ask held roughly flat each time — persistent listings suggest the price (not the market) is what's stuck; bring a comps-based counter.
- Current owner paid $258k; list at $500k implies a 93% gain — meaningful room to come down on a strong offer.
Risks & watch-outs
- Watch-outs: built in 1956 — expect roof / HVAC / electrical / plumbing capex.
Questions for the listing agent
- What do current leases actually rent for vs. the listed asking? Can we see a recent rent roll and the last 12 months of T-12 income?
- Built in 1956 — when were the roof, HVAC, electrical panel, plumbing, and water heater last replaced?
- Is there a deadline driving the sale (1031 exchange, divorce, estate, relocation)? That informs how much negotiation room exists.
- The area grade is low — what's the realistic commute time and amenity access for the typical tenant pool here? Any planned neighborhood developments (good or bad) we should know about?
- What's the average days-on-market for RENTAL listings here right now (not sales)? A rising rental-DOM trend means longer vacancies and softer asking-rent achievability than the comps imply.
- What's the recent tenant-quality profile in this submarket — average credit score on applications, eviction rate, late-payment / NSF rate, and stable-employment percentage? A property-management company in the area should have these aggregated.
- How much new for-sale + rental construction is in the pipeline within 1–3 miles? Heavy new supply typically softens prices + rents 12–24 months out; constrained supply supports both.
Investment metrics
- 1% rule
- 0.81% ✗
- Cap rate
- 6.14%
- Cash-on-cash
- -0.54%
- DSCR
- 0.98
- GRM
- 10.3
CMA / ARV
- ARV (on-the-fly)
- $257,757
- Comps found
- 1
Show comp detail 1 sale within ~0.75 mi
| Address | Dist | Beds/Ba | Sqft | Sold | Price | $/sf | Match |
|---|---|---|---|---|---|---|---|
| 3909 Brainard Rd | 0.00mi | 3/1.5 | 1,707 (0%) | 15mo | $258,500 | $151 | 87 |
Match score weights: distance 35% · size 25% · config 20% · recency 20%. Top-matched comps best support the ARV.
Projected returns pro-forma
-3.0% appreciation · 1.15% rent growth · sell at horizon
- IRR
- -19.2%
- Equity multiple
- 0.34×
- Total profit
- $-92,515
- Equity at exit
- $74,552
- IRR
- -15.9%
- Equity multiple
- 0.18×
- Total profit
- $-115,211
- Equity at exit
- $43,231
Cash invested: $140,000 (down + closing). Projections, not guarantees.
Landlord ↔ Tenant lean methodology
- Overall (STATE)
- 73 Landlord-Friendly
- State Ohio
- 73 Landlord-Friendly · R+6
- County
- — inherits STATE
- City
- — inherits STATE
ZIP-level market 44122
- Rents YoY
- 1.1%
- Active inventory
- 183
- Price-to-rent
- 10.3×
Monthly cashflow live
- Estimated rent
- $4,038 medium interval (Pro) →
- Mortgage (P&I)
- −$2,622
- Tax from tax record
- −$423 /mo · $5,079/yr
- Insurance
- −$208
- HOA
- −$0
- Vacancy / Maint / Mgmt
- −$848
- Net cashflow
- $-64
Break-even live
Sensitivity live
| Price | -10% $219 | -5% $78 | +0% $-64 | +5% $-205 | +10% $-347 |
|---|---|---|---|---|---|
| Rent | -10% $-383 | -5% $-223 | +0% $-64 | +5% $96 | +10% $255 |
| Rate | -1.0pp $188 | -0.5pp $64 | base $-64 | +0.5pp $-193 | +1.0pp $-325 |
UW: 25.0% down · 7.5% · 30yr · 1.5% tax · 5.0% vac · 8.0% maint · 8.0% mgmt
Financing live
Cash to close
- Down payment
- $125,000
- Closing costs
- $15,000
- Reserves months
- —
- Total cash needed
- —
Loan-product check · same deal, 3 products live
Conventional
25% down · 7.5% · 30yr
- Down + closing
- —
- Monthly P&I
- —
- Monthly cashflow
- —
- DSCR
- —
- Eligible?
- —
Personal DTI + credit; lowest rate.
DSCR
20% down · 8.5% · 30yr
- Down + closing
- —
- Monthly P&I
- —
- Monthly cashflow
- —
- DSCR
- —
- Eligible?
- —
No personal income docs; deal must DSCR.
Hard money
10% down · 12.0% · 12mo
- Down + closing
- —
- Monthly P&I
- —
- Monthly cashflow
- —
- DSCR
- —
- Eligible?
- —
Short-term bridge; refi at stabilization.
Rent comps 2 comps
| Address | Beds | Baths | Sqft | Rent | $/sqft | DOM | Units | Dist |
|---|---|---|---|---|---|---|---|---|
| 3659 Brainard Rd Beachwood, OH | 3.0 | 2.0 | 1649 | $2,995 | $1.82 | 3d | 1 | 0.45mi |
| 28649 Jackson Rd Unit 1496119P Chagrin Falls, OH | 4.0 | 3.5 | 1603 | $10,974 | $6.85 | 25d | 1 | 0.90mi |
Listing history 7 events
-
2026-06-21days on market $500,000 Active 11 DOM
-
2026-06-18days on market $500,000 Active 8 DOM
-
2026-06-17days on market $500,000 Active 7 DOM
-
2026-06-16days on market $500,000 Active 6 DOM
-
2026-06-15days on market $500,000 Active 5 DOM
-
2026-06-13remarks 699-char remark
-
2026-06-13$500,000 Active 3 DOM
ⓘ Source: listings_history table (triggers on properties + properties_extension) + one-shot
backfill from property_details.listing_events for pre-trigger history.
Tax reassessment forecast OH · Partial reset (capped growth)
- Current annual tax
- $5,079 · $423/mo
- Projected year-2 tax
- $6,439 · $537/mo
- Expected delta
- +$1,361/yr (+$113/mo · 26.8%)
ⓘ Screening estimate from a state-policy table — verify with the county assessor before closing.
Climate risk First Street
- Flood 1/10 Low FEMA zone X (unshaded) · 0% chance over 30 yrs
- Wildfire 1/10 Low
- Heat 2/10 Low 7 d/yr ≥94°F today · 15 d/yr by 30 yrs out
- Wind 1/10 Low
- Air quality 3/10 Moderate 2 unhealthy d/yr today · 5 by 30 yrs out
Nearby sold comps map
Loading sold comps map…
Walkable amenities ~0.75 mi
Loading nearby amenities…
Taxation est. · year 1
- Rental income
- $48,456
- − Mortgage interest
- −$28,008
- − Property taxes
- −$5,079
- − Insurance
- −$2,500
- − Repairs & maintenance
- −$3,876
- − Management
- −$3,876
- − Depreciation
- −$14,545
- Taxable loss
- −$9,429
- Est. tax savings @ 24.0%
- +$2,263
- After-tax cash flow
- $1,500/yr
For passive investors: Depreciation is non-cash, so a rental often shows a tax loss while cash-flowing — sheltering income. Rental losses are passive: they offset passive income freely, and up to $25,000/yr can offset ordinary (W-2) income if you actively participate and your MAGI is under $100k (phasing out to $0 by $150k); unused losses carry forward. On sale, claimed depreciation is recaptured at up to 25%, and gains may owe capital-gains tax (a 1031 exchange can defer both). Figures are a year-1 estimate at your 24.0% rate — not tax advice; consult a CPA.
Schools (NCES district)
- District
- Orange City
- NCES district ID
- 3910016
- Math proficiency
- 76% ▼ -11.00%
- Reading proficiency
- 83% ▼ -6.00%
- Median HH income
- $114,295
- Composite
- 73.37/100
- National rank
- #182
- State rank
- #32 of 656 in OH
Livability — Orange
- Score
- 70/100
- State rank
- #452
- US rank
- #7361
Category grades
Schools grade is shown separately in the Schools card above.
Census & demographics
- Census place
- Orange, OH
- County
- Cuyahoga County · 1,090,369 people
- Metro
- Cleveland-Elyria, OH
- Population (ZIP)
- 36,678
- Household income
- $101,230
- Rent vs Own
- Severe rent burden
- 1294.0
Population outlook (Cuyahoga County) Hauer SSP2
- Today (2025)
- 1,244,621 people
- By 2030
- 1,230,093 · -1.2%
- By 2040
- 1,189,108 · -4.5%
- By 2050
- 1,145,706 · -7.9%
- By 2075
- 1,076,557 · -13.5%
- By 2100
- 978,987 · -21.3%
Race, ethnicity, and origin ACS 2023
- Neighborhood character
- Diverse neighborhood (Simpson 0.59)
- Race & ethnicity
- White 56% Black 29% Asian 6% Two or more races 6% Hispanic / Latino 3%
- Common ancestry
- Romanian 6% Scotch-Irish 5% Italian 2%
- Foreign-born
- 12% · Canada, China
- Languages at home
- 85% English-only · Spanish 3% Other Indo-European 3% Chinese 2%
Political lean MEDSL · Cuyahoga
- 2024 margin
- Solid D (+31.5) · D 65.4% · R 33.9%
- 2008→2024 swing
- -7.4pp toward R · 2008: 38.9pp · 2024: 31.5pp
- All cycles
- 2024: D+31.5 2020: D+34.1 2016: D+35.0 2012: D+38.7 2008: D+38.9
Not yet ingested
- Civics
- —
Market trends
- HPI YoY
- ▼ -268.81%
- Current HPI
- 200.5087
- Rent YoY
- ▲ 1.15%
- Metro
- Cleveland-Elyria, OH
- State GDP YoY
- ▲ 1.98%
- F500 in state
- 48
Industry mix (Fortune 500 HQ in OH)
| Industry | F500 HQs | Revenue |
|---|---|---|
| Insurance | 3 | $145B |
|
||
| Industrial Machinery | 3 | $49B |
|
||
| Financial Services | 3 | $24B |
|
||
| Consumer Goods | 2 | $93B |
|
||
| Aerospace / Defense | 2 | $47B |
|
||
| Utilities | 2 | $33B |
|
||
Price history
+72.5% since first listed5 events — show timeline
- 2026-06-10 Listed $500,000 MLSNOW
- 2025-03-14 Sold (Public Records) $258,500 Public Records
- 2025-03-13 Sold (MLS) $258,500 MLSNOW
- 2025-02-13 Pending — MLSNOW
- 2025-02-07 Listed $289,900 MLSNOW
Property tax history
+0.8%/yrLatest (2025): $5,079 · -0.1% YoY. Source: county tax records.
Cash-flow waterfall
monthlySold comps — $/sqft
last 12 mo · ≤1 miLoading sold comps…