 Duplex
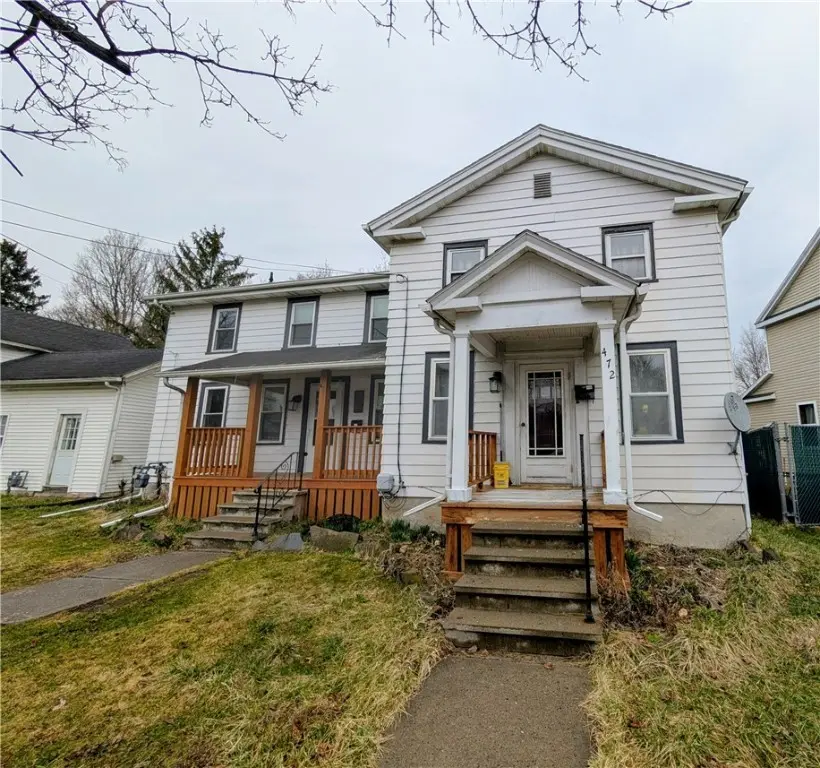
472 Waverly St · Waverly, NY
Flood risk 5/10 · Moderate
- FEMA flood zone
- X (unshaded)
- Chance of flooding over 30 yrs
- 0.67%
- Est. flood insurance / yr
- $473 – $860
Fire risk 1/10 · Minimal
- Est. fire insurance / yr
- $691 – $1,283
Heat risk 3/10 · Minor
- Hot days now (above 96°F)
- 7 days/yr
- Hot days in 30 yrs
- 16 days/yr
Wind risk 2/10 · Minimal
- Chance of severe wind over 30 yrs
- 2.0%
Air-quality risk 2/10 · Minimal
- Unhealthy air days now
- 0 days/yr
- Unhealthy air days in 30 yrs
- 1 days/yr
Risk factors via First Street. Map © Google.
Why this score? — see what drove the B+ grade
The composite is a weighted blend of 9 inputs, each scored 0–100. Each bar is that input's sub-score; the figure is the points it added to the 100-point composite (weight × sub-score).
- Cash flow +28.9/30.0
- DSCR +10.0/10.0
- 1% rule +9.2/10.0
- ARV discount +8.8/15.0
- Appreciation +6.4/10.0
- Schools +3.7/10.0
- Livability +3.4/5.0
- Rent growth +2.5/5.0
- Condition / age +2.5/5.0
$146,775
🖨 Deal sheet 📄 Offer letter ✓ Due diligence
Multi-family units
County records classify this as Multi-Family (2-4 Unit). Listing-text estimate: 2 units. confirmed
Listing remarks
Looking to get started with your first investment opportunity? Maybe you want to owner occupy to help cover your living expenses. This duplex has had significant updates. The unit called 472 1/2 has been recently renovated. The Kitchen and bathroom have been fully renovated just over a year ago. Off of the kitchen is a small enclosed porch area that leads to the back yard. This unit has laundry on the main floor. Upstairs you will find 2 bedrooms that can both fit a king size bed, and a fully renovated bathroom with a tile shower. This unit heats with natural gas/forced air furnace newly installed in 2022. The additional unit has the same layout with 2 bedrooms and 1 full bathroom upstairs.
Key facts
- Enclosed porch
- Tile shower
- 5,227 sq ft lot
Tags
Property features AI
Finance
- Other:
- Financial info: Two rental units with current rents: one unit at $475 and one unit at $1,050
- HOA & community:
Exterior
- Parking:
- Security:
- Utilities: Public water; Sewer connected; Water connected
- Home design: Residential multi-family property; Two levels / 2 stories
- Construction: Frame construction; Vinyl siding
- Exterior features: Rectangular lot; Lot noted as 'Other' and 'See Remarks'; Lot dimensions approximately 50 x 84 (0.12 acres)
Interior
- Kitchen: Dining area with kitchen in each unit
- Bedrooms: Two 2-bedroom units (each unit described as having a dining area with kitchen and a dining area with living room)
- Flooring: Carpet; Vinyl; Varies
- Bathrooms: Two full bathrooms (total); Each unit has 1 bathroom
- Heating & cooling: Electric heating; Oil heating; Forced air heating; Property has heating
- Interior features: Electric water heater; Walk-out basement access
- Laundry & utility: Electric water heater (listed under appliances)
Neighborhood map
What this means for you Summary
Snapshot
- This is a 2 × 2-bed/1.0-bath units multifamily listed at $147k.
Deal economics
- At list price, monthly cash flow is $500 ($6k/yr) — positive. Per door: $250/mo.
- The deal already cash-flows at list — no discount required.
- Meets the 1% rule at list price ($2k rent vs $147k).
- Recommended offer: $138k (6.0% below list) — sets the bar for market timing.
Location & tenants
- Location reads 67/100 on livability (#569 in NY) — a middle-class / working-renter tenant base. Strengths: cost of living A+, housing A+, health & safety A; Watch: amenities F, commute F, employment F.
- Waverly Central School District (town): math 41% / reading 46% proficiency, ranked #480 of 590 in NY (top 81%) — families likely to look elsewhere, expect single-tenant / working-renter base with shorter leases.
- Zoned schools: Elm Street Elementary School (math 44% / reading 47%, grade D-, #1,271 of 2,108 statewide, top 60%, 443 students, 58% FRL) — zoned schools average 58% FRL vs 42% district-wide (17 pts higher); higher-poverty schools than district average — tighter screening recommended.
- Market conditions: 53 active listings in the ZIP; 139 units permitted in Tioga County in 2024 (65 in 5+ unit buildings).
Forward outlook
- In year one you build about $5k of equity ($1k loan paydown + $4k appreciation (2.8% local appreciation)).
- Tioga County population projected at -27% by 2050 — secular population decline; favor cash flow + early exit over multi-decade hold.
- At projected returns (2.8% appreciation + 3.0% rent growth), your $41k cash investment doubles in ~4 years — after that, you're playing with house money.
- By year 7, paydown + projected appreciation supports a ~$32k cash-out refi (75% LTV) — recoverable capital for the next deal without selling this one.
Negotiation context
- It's been on market 65 days — a 6% lower offer ($138k) is reasonable based on typical stale-listing flexibility.
- 5 sale attempts since 6y ago with the ask held roughly flat each time — persistent listings suggest the price (not the market) is what's stuck; bring a comps-based counter.
- Current owner paid $54k; list at $147k implies a 172% gain — meaningful room to come down on a strong offer.
Risks & watch-outs
- Watch-outs: property tax is 2.6% of price; built in 1890 — expect roof / HVAC / electrical / plumbing capex.
- Climate carrying-cost: moderate flood risk — expect insurance premiums to compound above CPI over the hold.
Questions for the listing agent
- It's been on market 65 days. Have you received any prior offers? Is the seller open to a 6% concession, seller financing, or rate buy-down credit?
- Can we see the unit-by-unit rent roll, current vacancy, and any below-market leases? What's the average tenancy length?
- What capital expenditures (roof, boiler, parking lot, exteriors) have been made in the last 5 years, and what's planned in the next 2?
- Built in 1890 — when were the roof, HVAC, electrical panel, plumbing, and water heater last replaced?
- Property tax is high relative to price — has the assessment been appealed recently, and will the sale trigger a re-assessment?
- Why hasn't it sold? Are there any deal-killer items the seller is aware of (foundation, flood, title, zoning, code violations)?
- Is there a deadline driving the sale (1031 exchange, divorce, estate, relocation)? That informs how much negotiation room exists.
- What's the average days-on-market for RENTAL listings here right now (not sales)? A rising rental-DOM trend means longer vacancies and softer asking-rent achievability than the comps imply.
- What's the recent tenant-quality profile in this submarket — average credit score on applications, eviction rate, late-payment / NSF rate, and stable-employment percentage? A property-management company in the area should have these aggregated.
- How much new apartment / multifamily construction is in the pipeline within 1–3 miles? Heavy new supply (>2% of stock underway) typically softens rents 12–24 months out; light construction supports rent growth.
Investment metrics
- 1% rule
- 1.42% ✓
- Cap rate
- 10.38%
- Cash-on-cash
- 14.59%
- DSCR
- 1.65
- GRM
- 5.9
CMA / ARV
- ARV (on-the-fly)
- $151,140
- Comps found
- 2
Show comp detail 2 sales within ~0.75 mi
| Address | Dist | Beds/Ba | Sqft | Sold | Price | $/sf | Match |
|---|---|---|---|---|---|---|---|
| 17 Cadwell Ave | 0.21mi | 4/2.0 | 2,157 (-6%) | 2mo | $142,500 | $66 | 77 |
| 121 Chemung St | 0.31mi | 4/2.0 | 2,336 (+2%) | 15mo | $120,000 | $51 | 68 |
Match score weights: distance 35% · size 25% · config 20% · recency 20%. Top-matched comps best support the ARV.
Projected returns pro-forma
2.78% appreciation · 3.0% rent growth · sell at horizon
- IRR
- 20.7%
- Equity multiple
- 2.17×
- Total profit
- $47,904
- Equity at exit
- $64,172
- IRR
- 22.1%
- Equity multiple
- 4.12×
- Total profit
- $128,261
- Equity at exit
- $97,502
Cash invested: $41,097 (down + closing). Projections, not guarantees.
Landlord ↔ Tenant lean methodology
- Overall (STATE)
- 15 Strongly Tenant-Friendly
- State New York
- 15 Strongly Tenant-Friendly · D+10
- County
- — inherits STATE
- City
- — inherits STATE
ZIP-level market 14892
- Home prices YoY
- 1.2%
- Active inventory
- 53
- Price-to-rent
- 11.7×
Monthly cashflow live
- Estimated rent
- $2,085 medium interval (Pro) →
- Mortgage (P&I)
- −$770
- Tax from tax record
- −$317 /mo · $3,799/yr
- Insurance
- −$61
- HOA
- −$0
- Vacancy / Maint / Mgmt
- −$438
- Net cashflow
- $500
Break-even live
2-unit breakdown (identical units grouped — click to expand)
| Units | Beds | Baths | Est. rent |
|---|---|---|---|
| 2× units | 2 | 1 | $2,086 |
| #1 | 2 | 1 | $1,043 |
| #2 | 2 | 1 | $1,043 |
| Total (2 units) | $2,085 | ||
UW: 25.0% down · 7.5% · 30yr · 1.5% tax · 5.0% vac · 8.0% maint · 8.0% mgmt
Financing live
Cash to close
- Down payment
- $36,694
- Closing costs
- $4,403
- Reserves months
- —
- Total cash needed
- —
Loan-product check · same deal, 3 products live
Conventional
25% down · 7.5% · 30yr
- Down + closing
- —
- Monthly P&I
- —
- Monthly cashflow
- —
- DSCR
- —
- Eligible?
- —
Personal DTI + credit; lowest rate.
DSCR
20% down · 8.5% · 30yr
- Down + closing
- —
- Monthly P&I
- —
- Monthly cashflow
- —
- DSCR
- —
- Eligible?
- —
No personal income docs; deal must DSCR.
Hard money
10% down · 12.0% · 12mo
- Down + closing
- —
- Monthly P&I
- —
- Monthly cashflow
- —
- DSCR
- —
- Eligible?
- —
Short-term bridge; refi at stabilization.
Listing history 15 events
-
2026-04-24historical Active Under Contract
-
2026-03-20$146,775 Active
-
2025-08-13price $156,000
-
2025-06-18status Active
-
2025-06-01historical Active Under Contract
-
2025-04-21$164,000 Active
-
2024-06-06price $179,000
-
2024-04-24$181,900 Active
-
2021-02-26soldstatus $53,900
-
2021-01-29soldstatus $53,900
-
2020-10-29$59,000
-
2004-06-15soldstatus $59,600
-
2002-04-05soldstatus $42,000
-
1998-07-15soldstatus $48,000
-
1998-07-15soldstatus $48,000
ⓘ Source: listings_history table (triggers on properties + properties_extension) + one-shot
backfill from property_details.listing_events for pre-trigger history.
Tax reassessment forecast NY · Partial reset (capped growth)
- Current annual tax
- $3,799 · $317/mo
- Projected year-2 tax
- $3,799 · $317/mo
- Expected delta
- $0/yr ($0/mo · 0.0%)
ⓘ Screening estimate from a state-policy table — verify with the county assessor before closing.
Climate risk First Street
- Flood 5/10 Major FEMA zone X (unshaded) · 67% chance over 30 yrs
- Wildfire 1/10 Low
- Heat 3/10 Moderate 7 d/yr ≥96°F today · 16 d/yr by 30 yrs out
- Wind 2/10 Low 2% chance of damaging wind over 30 yrs
- Air quality 2/10 Low 0 unhealthy d/yr today · 1 by 30 yrs out
Nearby sold comps map
Loading sold comps map…
Walkable amenities ~0.75 mi
Loading nearby amenities…
Taxation est. · year 1
- Rental income
- $25,020
- − Mortgage interest
- −$8,222
- − Property taxes
- −$3,799
- − Insurance
- −$734
- − Repairs & maintenance
- −$2,002
- − Management
- −$2,002
- − Depreciation
- −$4,270
- Taxable income
- $3,992
- Est. tax owed @ 24.0%
- −$958
- After-tax cash flow
- $5,038/yr
For passive investors: Depreciation is non-cash, so a rental often shows a tax loss while cash-flowing — sheltering income. Rental losses are passive: they offset passive income freely, and up to $25,000/yr can offset ordinary (W-2) income if you actively participate and your MAGI is under $100k (phasing out to $0 by $150k); unused losses carry forward. On sale, claimed depreciation is recaptured at up to 25%, and gains may owe capital-gains tax (a 1031 exchange can defer both). Figures are a year-1 estimate at your 24.0% rate — not tax advice; consult a CPA.
Schools (NCES district)
- District
- Waverly Central School District
- NCES district ID
- 3630270
- Math proficiency
- 41% ▼ -4.00%
- Reading proficiency
- 46% ▲ 8.00%
- Median HH income
- $44,935
- Composite
- 36.9/100
- National rank
- #4544
- State rank
- #480 of 590 in NY
Livability — Waverly
- Score
- 67/100
- State rank
- #569
- US rank
- #10246
Category grades
Schools grade is shown separately in the Schools card above.
Census & demographics
- Census place
- Waverly, NY
- Population (ZIP)
- 7,531
Population outlook (Tioga County) Hauer SSP2
- Today (2025)
- 45,155 people
- By 2030
- 42,801 · -5.2%
- By 2040
- 37,960 · -15.9%
- By 2050
- 33,071 · -26.8%
- By 2075
- 24,144 · -46.5%
- By 2100
- 16,545 · -63.4%
Race, ethnicity, and origin ACS 2023
- Neighborhood character
- Predominantly White (93%)
- Race & ethnicity
- White 93% Hispanic / Latino 2% Two or more races 2% Black 1% Asian 1%
- Common ancestry
- Iranian 3% Romanian 3% Italian 2%
- Foreign-born
- 2%
- Languages at home
- 98% English-only · German/W. Germanic 1% Tagalog/Filipino 1%
Political lean MEDSL · Tioga
- 2024 margin
- Strong R (+22.9) · D 38.6% · R 61.4%
- 2008→2024 swing
- -12.7pp toward R · 2008: -10.2pp · 2024: -22.9pp
- All cycles
- 2024: R+22.9 2020: R+20.6 2016: R+27.6 2012: R+15.1 2008: R+10.2
Not yet ingested
- Civics
- —
Market trends
- HPI YoY
- ▲ 2.78%
- Current HPI
- 236.7714
- Rent YoY
- —
- Metro
- —
- State GDP YoY
- ▲ 2.60%
- F500 in state
- 92
Industry mix (Fortune 500 HQ in NY)
| Industry | F500 HQs | Revenue |
|---|---|---|
| Financial Services | 10 | $950B |
|
||
| Consumer Goods | 9 | $162B |
|
||
| Insurance | 4 | $225B |
|
||
| Telecommunications | 2 | $144B |
|
||
| Pharmaceuticals | 2 | $112B |
|
||
| Media / Entertainment | 2 | $69B |
|
||
Price history
+205.8% since first listed15 events — show timeline
- 2026-04-24 Contingent — IBRMLS
- 2026-03-20 Listed $146,775 IBRMLS
- 2025-08-13 Price Changed $156,000 IBRMLS
- 2025-06-18 Relisted — IBRMLS
- 2025-06-01 Contingent — IBRMLS
- 2025-04-21 Listed $164,000 IBRMLS
- 2024-06-06 Price Changed $179,000 NMPA
- 2024-04-24 Listed $181,900 NMPA
- 2021-02-26 Sold (Public Records) $53,900 Public Records
- 2021-01-29 Sold (MLS) $53,900 NMPA
- 2020-10-29 Listed $59,000 NMPA
- 2004-06-15 Sold (Public Records) $59,600 Public Records
- 2002-04-05 Sold (Public Records) $42,000 Public Records
- 1998-07-15 Sold (Public Records) $48,000 Public Records
- 1998-07-15 Sold (Public Records) $48,000 Public Records
Property tax history
+5.8%/yrLatest (2025): $3,799 · +5.1% YoY. Source: county tax records.
Cash-flow waterfall
monthlySold comps — $/sqft
last 12 mo · ≤1 miLoading sold comps…