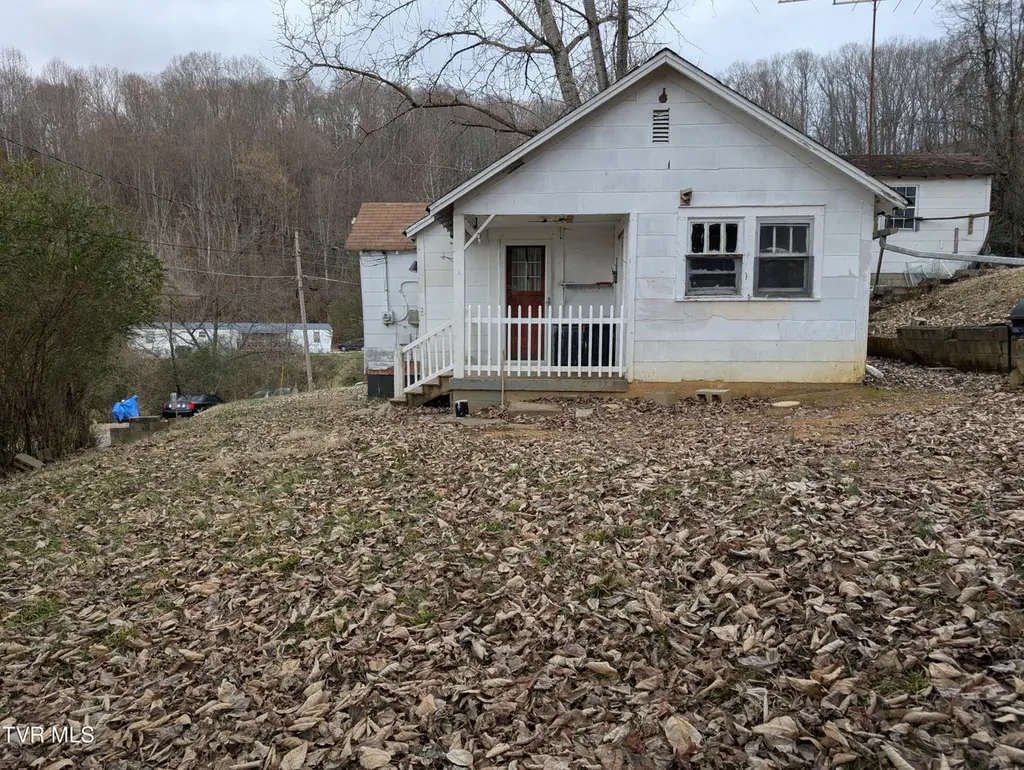
918 Independence Dr · Bloomingdale, TN
Flood risk 1/10 · Minimal
- FEMA flood zone
- X (unshaded)
- Chance of flooding over 30 yrs
- 0.0%
- Est. flood insurance / yr
- $507 – $1,088
Fire risk 5/10 · Moderate
- Est. fire insurance / yr
- $949 – $1,763
Heat risk 3/10 · Minor
- Hot days now (above 100°F)
- 4 days/yr
- Hot days in 30 yrs
- 11 days/yr
Wind risk 2/10 · Minimal
- Chance of severe wind over 30 yrs
- —
Air-quality risk 1/10 · Minimal
- Unhealthy air days now
- 0 days/yr
- Unhealthy air days in 30 yrs
- 0 days/yr
Risk factors via First Street. Map © Google.
Why this score? — see what drove the B- grade
The composite is a weighted blend of 9 inputs, each scored 0–100. Each bar is that input's sub-score; the figure is the points it added to the 100-point composite (weight × sub-score).
- Cash flow +30.0/30.0
- 1% rule +10.0/10.0
- DSCR +10.0/10.0
- ARV discount +7.5/15.0
- Rent growth +4.5/5.0
- Livability +2.8/5.0
- Schools +1.8/10.0
- Condition / age +1.0/5.0
- Appreciation +0.0/10.0
$49,000
🖨 Deal sheet (PDF) 📄 Offer letter ✓ Due diligence
Listing remarks MLS
Investment opportunity on a quiet, dead-end street with 0.50 acres. This bungalow was recently surveyed. Loads of potential.
Key facts
- 0.5 acre lot
- Built 1947
- Listed 170 days
Neighborhood map
What this means for you Summary
Snapshot
- This is a 2-bed/1.0-bath single-family listed at $49k. Condition is rated poor.
Deal economics
- At list price, monthly cash flow is $539 ($6k/yr) — positive.
- The deal already cash-flows at list — no discount required.
- Meets the 1% rule at list price ($1k rent vs $49k).
- Recommended offer: $43k (12.0% below list) — sets the bar for market timing.
- Cap rate 19.5% vs local median 4.9% in Bloomingdale — top-decile yield for the area; either an underpriced asset or a hidden risk that comps aren't pricing in. Stress-test before assuming the spread holds.
Location & tenants
- Location reads 56/100 on livability (#343 in TN) — a working-class tenant base; expect higher turnover. Strengths: cost of living A+, housing A+; Watch: employment D+, crime F, amenities F.
- Sullivan County (suburban): math 17% / reading 24% proficiency, ranked #109 of 139 in TN (top 78%) — low school quality limits family demand, transient renter base, plan for 1-2y turnover.
- Zoned schools: Ketron Elementary School (math 16% / reading 19%, grade F, #704 of 952 statewide, top 74%, 563 students, 0% FRL) — zoned schools average 0% FRL vs 45% district-wide (45 pts lower); this property's tenant base skews higher-income than the district average.
- Market conditions: Rents rising fast (+8.0%/yr); 240 active listings in the ZIP; 1 comparable units currently listed for rent nearby; 453 units permitted in Sullivan County in 2024 (6 in 5+ unit buildings).
Forward outlook
- Local home prices are declining (-3.0%/yr); year-one equity from $339 of loan paydown is wiped out by about $1k of value loss. Plan a longer hold.
- Sullivan County population projected to shrink 5% by 2050 — rents likely to lag national; underwrite the cash flow, not the appreciation.
- At projected returns (-3.0% appreciation + 8.0% rent growth), your $14k cash investment doubles in ~3 years — after that, you're playing with house money.
Negotiation context
- It's been on market 170 days — a 12% lower offer ($43k) is reasonable based on typical stale-listing flexibility.
Risks & watch-outs
- Watch-outs: built in 1947 — expect roof / HVAC / electrical / plumbing capex.
- Climate carrying-cost: moderate wildfire risk — expect insurance premiums to compound above CPI over the hold.
Questions for the listing agent
- It's been on market 170 days. Have you received any prior offers? Is the seller open to a 12% concession, seller financing, or rate buy-down credit?
- Have any recent inspections been done? Can we get a copy of the seller's disclosures and any deferred-maintenance estimates?
- Built in 1947 — when were the roof, HVAC, electrical panel, plumbing, and water heater last replaced?
- Why hasn't it sold? Are there any deal-killer items the seller is aware of (foundation, flood, title, zoning, code violations)?
- Is there a deadline driving the sale (1031 exchange, divorce, estate, relocation)? That informs how much negotiation room exists.
- Schools are F-rated, which usually means shorter tenancies and higher turnover. Who's the typical renter profile here, and what's been the actual vacancy rate?
- Crime grade is F in this area — have there been break-ins, vandalism, or insurance claims at this property in the last 3 years? What carrier currently insures it and at what premium?
- What's the average days-on-market for RENTAL listings here right now (not sales)? A rising rental-DOM trend means longer vacancies and softer asking-rent achievability than the comps imply.
- What's the recent tenant-quality profile in this submarket — average credit score on applications, eviction rate, late-payment / NSF rate, and stable-employment percentage? A property-management company in the area should have these aggregated.
- How much new for-sale + rental construction is in the pipeline within 1–3 miles? Heavy new supply typically softens prices + rents 12–24 months out; constrained supply supports both.
Investment metrics
- 1% rule
- 2.27% ✓
- Cap rate
- 19.51%
- Cash-on-cash
- 47.19%
- DSCR
- 3.10
- GRM
- 3.7
CMA / ARV
- ARV (median comp)
- $127,268
- List price
- $49,000
- Delta
- -61.50%
- Verdict
- UNDERPRICED
- Comps
- 14 within 1.0 mi
Projected returns pro-forma
-3.0% appreciation · 7.95% rent growth · sell at horizon
- IRR
- 50.1%
- Equity multiple
- 3.35×
- Total profit
- $32,250
- Equity at exit
- $7,306
- IRR
- 57.6%
- Equity multiple
- 8.20×
- Total profit
- $98,824
- Equity at exit
- $4,237
Cash invested: $13,720 (down + closing). Projections, not guarantees.
Landlord ↔ Tenant lean methodology
- Overall (STATE)
- 87 Strongly Landlord-Friendly
- State Tennessee
- 87 Strongly Landlord-Friendly · R+13
- County
- — inherits STATE
- City
- — inherits STATE
ZIP-level market 37660
- Home prices YoY
- -24.2%
- Rents YoY
- 8.0%
- Active inventory
- 240
- Price-to-rent
- 3.7×
Monthly cashflow live
- Estimated rent
- $1,112 medium interval (Pro) →
- Mortgage (P&I)
- −$257
- Tax est. 1.5%
- −$61 /mo · $735/yr
- Insurance
- −$20
- HOA
- −$0
- Vacancy / Maint / Mgmt
- −$233
- Net cashflow
- $539
Break-even live
Sensitivity live
| Price | -10% $573 | -5% $556 | +0% $539 | +5% $523 | +10% $506 |
|---|---|---|---|---|---|
| Rent | -10% $452 | -5% $496 | +0% $539 | +5% $583 | +10% $627 |
| Rate | -1.0pp $564 | -0.5pp $552 | base $539 | +0.5pp $527 | +1.0pp $514 |
UW: 25.0% down · 7.5% · 30yr · 1.5% tax · 5.0% vac · 8.0% maint · 8.0% mgmt
Financing live
Cash to close
- Down payment
- $12,250
- Closing costs
- $1,470
- Reserves months
- —
- Total cash needed
- —
Loan-product check · same deal, 3 products live
Conventional
25% down · 7.5% · 30yr
- Down + closing
- —
- Monthly P&I
- —
- Monthly cashflow
- —
- DSCR
- —
- Eligible?
- —
Personal DTI + credit; lowest rate.
DSCR
20% down · 8.5% · 30yr
- Down + closing
- —
- Monthly P&I
- —
- Monthly cashflow
- —
- DSCR
- —
- Eligible?
- —
No personal income docs; deal must DSCR.
Hard money
10% down · 12.0% · 12mo
- Down + closing
- —
- Monthly P&I
- —
- Monthly cashflow
- —
- DSCR
- —
- Eligible?
- —
Short-term bridge; refi at stabilization.
Rent comps 1 comps
| Address | Beds | Baths | Sqft | Rent | $/sqft | DOM | Units | Dist |
|---|---|---|---|---|---|---|---|---|
| 1528 Lynn Garden Dr Unit 5 Kingsport, TN | 1.0 | 1.0 | 650 | $750 | $1.15 | 45d | 1 | 1.19mi |
Listing history 18 events
-
2026-06-21days on market $49,000 Active 170 DOM
-
2026-06-19days on market $49,000 Active 168 DOM
-
2026-06-18days on market $49,000 Active 167 DOM
-
2026-06-17days on market $49,000 Active 166 DOM
-
2026-06-16days on market $49,000 Active 165 DOM
-
2026-06-15days on market $49,000 Active 164 DOM
-
2026-06-14days on market $49,000 Active 162 DOM
-
2026-06-13days on market $49,000 Active 161 DOM
-
2026-06-10days on market $49,000 Active 159 DOM
-
2026-06-09days on market $49,000 Active 158 DOM
-
2026-06-08days on market $49,000 Active 157 DOM
-
2026-06-07days on market $49,000 Active 156 DOM
-
2026-06-02days on market $49,000 Active 151 DOM
-
2026-06-01days on market $49,000 Active 150 DOM
-
2026-05-31days on market $49,000 Active 149 DOM
-
2026-05-30days on market $49,000 Active 148 DOM
-
2026-03-06price $49,000 124-char remark
Show marketing remark (124 chars)
Investment opportunity on a quiet, dead-end street with 0.50 acres. This bungalow was recently surveyed. Loads of potential.
-
2026-01-02$59,900 Active 124-char remark
Show marketing remark (124 chars)
Investment opportunity on a quiet, dead-end street with 0.50 acres. This bungalow was recently surveyed. Loads of potential.
ⓘ Source: listings_history table (triggers on properties + properties_extension) + one-shot
backfill from property_details.listing_events for pre-trigger history.
Climate risk First Street
- Flood 1/10 Low FEMA zone X (unshaded) · 0% chance over 30 yrs
- Wildfire 5/10 Major
- Heat 3/10 Moderate 4 d/yr ≥100°F today · 11 d/yr by 30 yrs out
- Wind 2/10 Low
- Air quality 1/10 Low 0 unhealthy d/yr today · 0 by 30 yrs out
Nearby sold comps map
Loading sold comps map…
Walkable amenities ~0.75 mi
Loading nearby amenities…
Taxation est. · year 1
- Rental income
- $13,339
- − Mortgage interest
- −$2,745
- − Property taxes
- −$735
- − Insurance
- −$245
- − Repairs & maintenance
- −$1,067
- − Management
- −$1,067
- − Depreciation
- −$1,425
- Taxable income
- $6,054
- Est. tax owed @ 24.0%
- −$1,453
- After-tax cash flow
- $5,021/yr
For passive investors: Depreciation is non-cash, so a rental often shows a tax loss while cash-flowing — sheltering income. Rental losses are passive: they offset passive income freely, and up to $25,000/yr can offset ordinary (W-2) income if you actively participate and your MAGI is under $100k (phasing out to $0 by $150k); unused losses carry forward. On sale, claimed depreciation is recaptured at up to 25%, and gains may owe capital-gains tax (a 1031 exchange can defer both). Figures are a year-1 estimate at your 24.0% rate — not tax advice; consult a CPA.
Condition & rehab AI · 12 photos
This property requires extensive repairs and updates to bring it up to a livable condition. Significant investment is needed to address structural issues, improve the home's functionality, and increase its value.
Repairs flagged
- Major Kitchen cabinets — Severe damage and need for replacement.
- Major Bathroom fixtures — Outdated and in need of replacement.
- Major Roof — Moss and potential water damage.
- Major Exterior siding — Peeling and structural issues.
- Major Flooring — Worn and in need of replacement.
- Major Interior walls — Bare and in need of painting.
- Major Windows — Broken and need replacement.
- Major Foundation — Unstable and in need of repair.
- Major HVAC system — Old and in need of replacement.
- Major Landscaping — Overgrown and in need of maintenance.
Value-add opportunities
- Both Paint interior walls — Fresh paint can improve the home's appearance and increase its value.
- Both Replace broken windows — New windows will improve the home's curb appeal and increase its value.
- Both Replace HVAC system — A new HVAC system will improve the home's comfort and increase its value.
- Both Replace flooring — New flooring will improve the home's appearance and increase its value.
- Both Replace kitchen cabinets — New cabinets will improve the home's functionality and increase its value.
- Both Replace bathroom fixtures — New fixtures will improve the home's functionality and increase its value.
- Both Repair roof — A repaired roof will improve the home's functionality and increase its value.
- Both Repair exterior siding — A repaired exterior will improve the home's appearance and increase its value.
- Both Repair foundation — A repaired foundation will improve the home's functionality and increase its value.
- Both Maintain landscaping — A maintained landscape will improve the home's curb appeal and increase its value.
Renovation cost estimate screening
| Repair item | Severity | Est. cost |
|---|---|---|
| Kitchen cabinets · Severe damage and need for replacement. | Major | $15,000–50,000 |
| Bathroom fixtures · Outdated and in need of replacement. | Major | $15,000–50,000 |
| Roof · Moss and potential water damage. | Major | $15,000–50,000 |
| Exterior siding · Peeling and structural issues. | Major | $15,000–50,000 |
| Flooring · Worn and in need of replacement. | Major | $15,000–50,000 |
| Interior walls · Bare and in need of painting. | Major | $15,000–50,000 |
| Windows · Broken and need replacement. | Major | $15,000–50,000 |
| Foundation · Unstable and in need of repair. | Major | $15,000–50,000 |
| HVAC system · Old and in need of replacement. | Major | $15,000–50,000 |
| Landscaping · Overgrown and in need of maintenance. | Major | $15,000–50,000 |
| Total estimated repair cost · 10 items | $150,000–500,000 |
Value-add ROI direction
- Both Paint interior walls — Fresh paint can improve the home's appearance and increase its value. ↑
- Both Replace broken windows — New windows will improve the home's curb appeal and increase its value. ↑
- Both Replace HVAC system — A new HVAC system will improve the home's comfort and increase its value. ↑
- Both Replace flooring — New flooring will improve the home's appearance and increase its value. ↑
- Both Replace kitchen cabinets — New cabinets will improve the home's functionality and increase its value. ↑
- Both Replace bathroom fixtures — New fixtures will improve the home's functionality and increase its value. ↑
- Both Repair roof — A repaired roof will improve the home's functionality and increase its value. ↑
- Both Repair exterior siding — A repaired exterior will improve the home's appearance and increase its value. ↑
- Both Repair foundation — A repaired foundation will improve the home's functionality and increase its value. ↑
- Both Maintain landscaping — A maintained landscape will improve the home's curb appeal and increase its value. ↑
ⓘ Cost ranges are severity-bucket heuristics (US national rule-of-thumb). Get contractor quotes + a written scope before underwriting a rehab budget.
Schools (NCES district)
- District
- Sullivan County
- NCES district ID
- 4703990
- Math proficiency
- 17% ▼ -15.00%
- Reading proficiency
- 24% ▼ -10.00%
- Median HH income
- $43,263
- Composite
- 17.66/100
- National rank
- #9030
- State rank
- #109 of 139 in TN
Livability — Bloomingdale
- Score
- 56/100
- State rank
- #343
- US rank
- #22770
Category grades
Schools grade is shown separately in the Schools card above.
Census & demographics
- County
- Sullivan County · 121,987 people
- Metro
- Kingsport-Bristol, TN-VA
- Population (ZIP)
- 40,996
- Household income
- $49,191
- Rent vs Own
- Severe rent burden
- 1384.0
Population outlook (Sullivan County) Hauer SSP2
- Today (2025)
- 157,030 people
- By 2030
- 156,415 · -0.4%
- By 2040
- 153,778 · -2.1%
- By 2050
- 149,018 · -5.1%
- By 2075
- 138,068 · -12.1%
- By 2100
- 119,927 · -23.6%
Race, ethnicity, and origin ACS 2023
- Neighborhood character
- Predominantly White (88%)
- Race & ethnicity
- White 88% Two or more races 4% Black 4% Hispanic / Latino 3%
- Common ancestry
- Serbian 3% Slovak 3% Italian 1%
- Foreign-born
- 2% · Canada
- Languages at home
- 98% English-only · Spanish 2%
Political lean MEDSL · Sullivan
- 2024 margin
- Solid R (+55.0) · D 22.0% · R 77.0% · Other 1.0%
- 2008→2024 swing
- -13.6pp toward R · 2008: -41.3pp · 2024: -55.0pp
- All cycles
- 2024: R+55.0 2020: R+51.9 2016: R+56.2 2012: R+47.2 2008: R+41.3
Not yet ingested
- Civics
- —
Market trends
- HPI YoY
- ▼ -80.93%
- Current HPI
- 252.9821
- Rent YoY
- ▲ 7.95%
- Metro
- Kingsport-Bristol, TN-VA
- State GDP YoY
- ▲ 2.78%
- F500 in state
- 22
Industry mix (Fortune 500 HQ in TN)
| Industry | F500 HQs | Revenue |
|---|---|---|
| Healthcare | 3 | $91B |
|
||
| Retail | 3 | $72B |
|
||
| Transportation / Logistics | 1 | $88B |
|
||
| Paper / Packaging | 1 | $19B |
|
||
| Insurance | 1 | $13B |
|
||
| Energy | 1 | $12B |
|
||
Price history
-18.2% since first listed2 events — show timeline
- 2026-03-06 Price Changed $49,000 TVRMLS
- 2026-01-02 Listed $59,900 TVRMLS
Cash-flow waterfall
monthlySold comps — $/sqft
last 12 mo · ≤1 miLoading sold comps…