 🏗️ New Construction
900 North Point St #320 · San Francisco, CA
Flood risk 1/10 · Minimal
- FEMA flood zone
- X (unshaded)
- Chance of flooding over 30 yrs
- 0.0%
- Est. flood insurance / yr
- $507 – $1,088
Fire risk 1/10 · Minimal
- Est. fire insurance / yr
- $659 – $1,223
Heat risk 2/10 · Minimal
- Hot days now (above 79°F)
- 8 days/yr
- Hot days in 30 yrs
- 17 days/yr
Wind risk 1/10 · Minimal
- Chance of severe wind over 30 yrs
- —
Air-quality risk 8/10 · Major
- Unhealthy air days now
- 15 days/yr
- Unhealthy air days in 30 yrs
- 15 days/yr
Risk factors via First Street. Map © Google.
Why this score? — see what drove the F grade
The composite is a weighted blend of 9 inputs, each scored 0–100. Each bar is that input's sub-score; the figure is the points it added to the 100-point composite (weight × sub-score).
- ARV discount +7.5/15.0
- Appreciation +7.5/10.0
- Rent growth +5.0/5.0
- Schools +5.0/10.0
- Livability +3.8/5.0
- Condition / age +2.5/5.0
- Cash flow +0.3/30.0
- 1% rule +0.0/10.0
- DSCR +0.0/10.0
$60,000
🖨 Deal sheet 📄 Offer letter ✓ Due diligence
Listing remarks
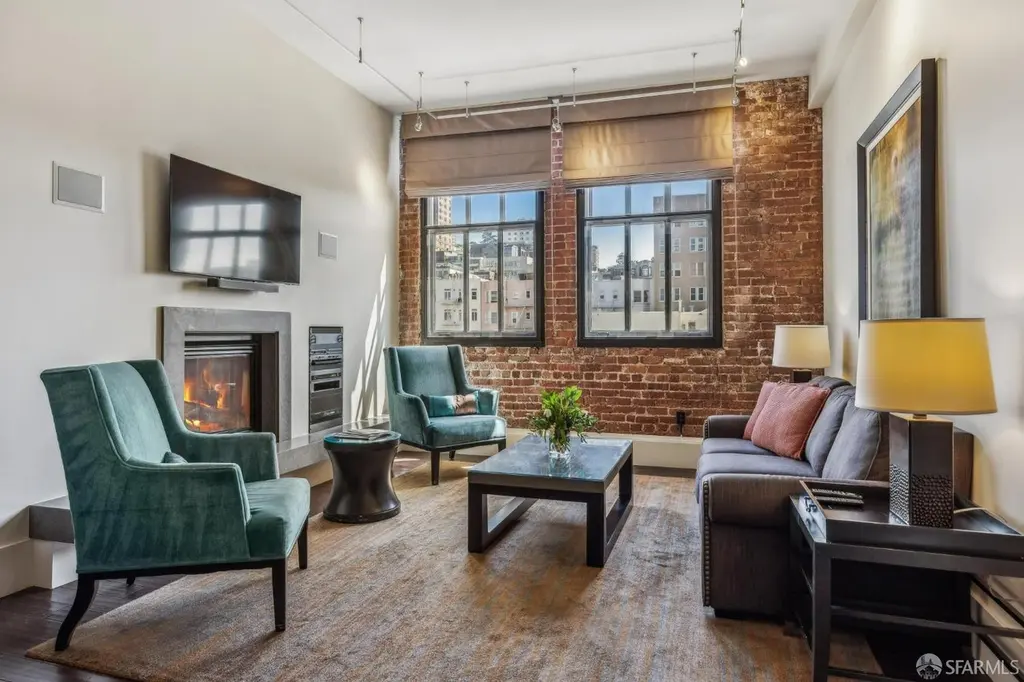
A rare opportunity to own a fraction/condo residence in one of San Francisco's most iconic and historically rich destinations, Ghirardelli Square. Residence 115, is a sophisticated, 2-bedroom, 2 bath residence in a building known primarily for it's luxury hotel use and fractional ownership. This means more flexibility, privacy and the ability to truly make this your pied-a-terre, worldwide travel opportunity or rental investment in the city. Residence 115 features exposed brick walls, oversized windows with abundant light, high-end finishes, and designer interiors. Enjoy seamless indoor-outdoor living with dramatic views, a chef's kitchen, spa-quality bathrooms and Fairmont approved, luxury
Key facts
- Exposed brick walls
- Luxury amenities
- Private lounge
Tags
Property features AI
Finance
- HOA & community: Association (CROA) with monthly fee; Association amenities include roof deck, gym/exercise room, clubhouse and other shared facilities; Association fee covers water, trash, sewer, security, grounds and exterior maintenance, internet, structure insurance, homeowners insurance, gas, electricity, earthquake insurance, door person, common areas and cable TV; Senior community: No
Exterior
- Parking: 2 total parking spaces; 2 enclosed garage spaces (side-by-side) with garage door opener; EV charging available; Unassigned parking option; Paved sidewalk at driveway
- Security: Video system; Security patrol; Door person (association amenity); Fire alarm and fire suppression system; Carbon monoxide detector; Smoke detectors
- Utilities: Natural gas connected; Internet available; DSL available; Cable available; Public sewer; 220 volts in laundry
- Home design: Residential co-ownership property; New construction; Property faces northeast
- Construction: New construction
- Exterior features: Uncovered and covered patios; Uncovered and covered decks; Uncovered and covered courtyards; Balcony; Fire pit; Metal fencing; Storage structure and gazebo on property
Interior
- Kitchen: Microwave; Range hood; Disposal; Dishwasher; Built-in refrigerator; Built-in gas oven; Built-in electric range and oven; Built-in freezer; Kitchen/family combo with island sink, granite counters and breakfast area
- Bedrooms: 2 bedrooms; Primary bedroom with walk-in closet (2+)
- Flooring: Wood; Tile; Carpet
- Bathrooms: 2 full bathrooms; Master bath with tub, shower stall and marble surfaces; Additional bathroom(s) with shower stall and marble surfaces
- Heating & cooling: Central heating; Fireplace heating; Central air conditioning
- Interior features: Storage areas; Elevator; Cathedral ceilings; Video security system; Smoke detectors; Security patrol; Fire suppression system; Fire alarm; Carbon monoxide detector; One fireplace with stone surround, raised hearth and gas log in the living room; Four-story residence; Six total rooms
- Laundry & utility: Stacked washer/dryer in laundry closet; 220V in laundry
Neighborhood map
What this means for you Summary
Snapshot
- This is a 2-bed/2.0-bath condo listed at $60k.
Deal economics
- At list price, monthly cash flow is $-7k ($-81k/yr) — negative.
- The deal already cash-flows at list — no discount required.
- Meets the 1% rule at list price ($7k rent vs $60k).
- Recommended offer: $58k (3.0% below list) — sets the bar for market timing.
- Cap rate 0.9% vs local median 2.1% in San Francisco — below-typical yield; the buyer is paying a premium for something (appreciation thesis, condition, location) that the cap rate doesn't capture.
Location & tenants
- Location reads 76/100 on livability (#90 in CA, #3,143 nationally) — a middle-class / working-renter tenant base. Strengths: amenities A+, commute A+, employment A+; Watch: crime F, cost of living F.
- San Francisco Unified (urban): math 50% / reading 56% proficiency, ranked #322 of 1,400 in CA (top 23%) — acceptable for families but not a draw, mixed tenant base, ~2y average lease.
- Market conditions: Rents rising fast (+15.6%/yr); 155 active listings in the ZIP; 40 comparable units currently listed for rent nearby; rentals at typical pace (median 17d on market — plan ~3-4 weeks tenant-placement turnaround); solid renter incomes; 750 units permitted in San Francisco County in 2024 (688 in 5+ unit buildings).
- At $6,518/mo this rent would consume 74% of the median local household income ($106k/yr) (locally 5272% of renters already pay >50% of income on rent) — very limited rent-growth headroom before tenants either downsize or default.
Forward outlook
- In year one you build about $86k of equity ($10k loan paydown + $76k appreciation (5.0% local appreciation)).
- San Francisco County population projected at +39% by 2050 — long-run rental-demand tailwind backs the buy-and-hold thesis.
- By year 2, paydown + projected appreciation supports a ~$138k cash-out refi (75% LTV) — recoverable capital for the next deal without selling this one.
Negotiation context
- It's been on market 56 days — a 3% lower offer ($58k) is reasonable based on typical stale-listing flexibility.
Risks & watch-outs
- Watch-outs: property tax is 37.8% of price; HOA is 22% of rent.
Questions for the listing agent
- What do current leases actually rent for vs. the listed asking? Can we see a recent rent roll and the last 12 months of T-12 income?
- It's been on market 56 days. Have you received any prior offers? Is the seller open to a 3% concession, seller financing, or rate buy-down credit?
- Built in 1964 — when were the roof, HVAC, electrical panel, plumbing, and water heater last replaced?
- Property tax is high relative to price — has the assessment been appealed recently, and will the sale trigger a re-assessment?
- What does the HOA fee cover, when was the last increase, and are there any pending special assessments or reserve-fund shortfalls?
- Any open or pending special assessments — roof, HVAC, plumbing, elevator, façade? What's the per-unit balance and payoff schedule, and is the seller paying it off at close or rolling it to the buyer?
- Is there a deadline driving the sale (1031 exchange, divorce, estate, relocation)? That informs how much negotiation room exists.
- Schools are B-rated — typically a magnet for longer-tenancy family renters. What's the average tenant stay here, and is there a school-zone premium baked into asking?
- Crime grade is F in this area — have there been break-ins, vandalism, or insurance claims at this property in the last 3 years? What carrier currently insures it and at what premium?
- The area grade is low — what's the realistic commute time and amenity access for the typical tenant pool here? Any planned neighborhood developments (good or bad) we should know about?
- What's the average days-on-market for RENTAL listings here right now (not sales)? A rising rental-DOM trend means longer vacancies and softer asking-rent achievability than the comps imply.
- What's the recent tenant-quality profile in this submarket — average credit score on applications, eviction rate, late-payment / NSF rate, and stable-employment percentage? A property-management company in the area should have these aggregated.
- How much new apartment / multifamily construction is in the pipeline within 1–3 miles? Heavy new supply (>2% of stock underway) typically softens rents 12–24 months out; light construction supports rent growth.
Investment metrics
- 1% rule
- 0.43% ✗
- Cap rate
- 0.94%
- Cash-on-cash
- -19.12%
- DSCR
- 0.15
- GRM
- 19.3
CMA / ARV
- ARV (median comp)
- $1,510,416
- List price
- $60,000
- Delta
- -96.03%
- Verdict
- UNDERPRICED
- Comps
- 20 within 1.0 mi
Projected returns pro-forma
5.02% appreciation · 8.0% rent growth · sell at horizon
- IRR
- -1.6%
- Equity multiple
- 0.90×
- Total profit
- $-43,826
- Equity at exit
- $857,890
- IRR
- 3.8%
- Equity multiple
- 1.76×
- Total profit
- $322,583
- Equity at exit
- $1,482,221
Cash invested: $422,917 (down + closing). Projections, not guarantees.
Landlord ↔ Tenant lean methodology
- Overall (CITY)
- 0 Strongly Tenant-Friendly
- State California
- 18 Strongly Tenant-Friendly · D+13
- County
- — inherits STATE
- City San Francisco
- 0 Strongly Tenant-Friendly · D+57
ZIP-level market 94109
- Home prices YoY
- 2.9%
- Rents YoY
- 15.6%
- Active inventory
- 155
- Price-to-rent
- 0.8×
Monthly cashflow live
- Estimated rent
- $6,518 high interval (Pro) →
- Mortgage (P&I)
- −$7,921
- Tax est. 1.5%
- −$1,888 /mo · $22,656/yr
- Insurance
- −$629
- HOA
- −$1,450
- Vacancy / Maint / Mgmt
- −$1,369
- Net cashflow
- $-6,739
Break-even live
UW: 25.0% down · 7.5% · 30yr · 1.5% tax · 5.0% vac · 8.0% maint · 8.0% mgmt
Financing live
Cash to close
- Down payment
- $377,604
- Closing costs
- $45,312
- Reserves months
- —
- Total cash needed
- —
Loan-product check · same deal, 3 products live
Conventional
25% down · 7.5% · 30yr
- Down + closing
- —
- Monthly P&I
- —
- Monthly cashflow
- —
- DSCR
- —
- Eligible?
- —
Personal DTI + credit; lowest rate.
DSCR
20% down · 8.5% · 30yr
- Down + closing
- —
- Monthly P&I
- —
- Monthly cashflow
- —
- DSCR
- —
- Eligible?
- —
No personal income docs; deal must DSCR.
Hard money
10% down · 12.0% · 12mo
- Down + closing
- —
- Monthly P&I
- —
- Monthly cashflow
- —
- DSCR
- —
- Eligible?
- —
Short-term bridge; refi at stabilization.
Rent comps 40 comps
| Address | Beds | Baths | Sqft | Rent | $/sqft | DOM | Units | Dist |
|---|---|---|---|---|---|---|---|---|
| 990 Bay St San Francisco, CA | 2.0 | 1.0 | 1035 | $5,995 | $5.79 | 24d | 1 | 0.09mi |
| 1255 Columbus Ave Unit 402 San Francisco, CA | 3.0 | 2.0 | 1505 | $7,250 | $4.82 | 1d | 1 | 0.27mi |
| 1305 Lombard St San Francisco, CA | 2.0 | 2.0 | 1050 | $8,995 | $8.57 | 12d | 1 | 0.32mi |
| 1140 Greenwich St Unit 301 San Francisco, CA | 1.0 | 1.0 | 1100 | $3,500 | $3.18 | 43d | 1 | 0.40mi |
| 1472 Filbert St San Francisco, CA | 2.0 | 1.0 | 941 | $7,895 | $8.39 | 11d | 1 | 0.43mi |
| 1535 Chestnut St Unit 203 San Francisco, CA | 2.0 | 2.0 | 1200 | $6,195 | $5.16 | 43d | 1 | 0.44mi |
| 1127 Filbert St Apt 3 San Francisco, CA | 3.0 | 2.5 | 1700 | $11,900 | $7.00 | 43d | 1 | 0.49mi |
| 650 Chestnut St #104 San Francisco, CA | 2.0 | 2.0 | 1080 | $6,500 | $6.02 | 7d | 1 | 0.50mi |
| 600 Chestnut St #301 San Francisco, CA | 2.0 | 2.0 | 1098 | $5,600 | $5.10 | 43d | 1 | 0.53mi |
| 2233 Larkin St San Francisco, CA | 2.0 | 1.0 | 1100 | $6,200 | $5.64 | 2d | 1 | 0.53mi |
| 1142 Green St Unit 1146 San Francisco, CA | 2.0 | 1.0 | 1200 | $4,795 | $4.00 | 43d | 1 | 0.57mi |
| 33 Vandewater St #103 San Francisco, CA | 2.0 | 2.0 | 950 | $6,900 | $7.26 | 18d | 1 | 0.57mi |
| 3322 Buchanan St San Francisco, CA | 2.0 | 2.0 | 1030 | $7,995 | $7.76 | 3d | 2 | 0.64mi |
| 3322 Buchanan St San Francisco, CA | 2.0 | 2.0 | 1271 | $8,395 | $6.61 | 21d | 1 | 0.64mi |
| 1808 Leavenworth St San Francisco, CA | 3.0 | 1.0 | 1100 | $6,475 | $5.89 | 43d | 1 | 0.65mi |
| 2550 Gough St #6 San Francisco, CA | 1.0 | 1.0 | 1009 | $3,269 | $3.24 | 43d | 1 | 0.66mi |
| 1750 Vallejo St Unit 402 San Francisco, CA | 1.0 | 1.0 | 1000 | $7,950 | $7.95 | 16d | 1 | 0.67mi |
| 770 Filbert St Unit 3 San Francisco, CA | 2.0 | 1.0 | 1050 | $5,190 | $4.94 | 43d | 1 | 0.67mi |
| 1690 Broadway San Francisco, CA | 1.0–2.0 | 1.0 | 761 | $6,995 | $9.19 | 7d | 2 | 0.71mi |
| 1888 Green St San Francisco, CA | 3.0 | 2.0 | 1455 | $9,875 | $6.79 | 43d | 1 | 0.74mi |
| 1212 Pacific Ave Unit 3 San Francisco, CA | 3.0 | 2.0 | 1000 | $5,100 | $5.10 | 5d | 1 | 0.81mi |
| 1860 Jackson St San Francisco, CA | 1.0 | 1.0 | 1000 | $5,495 | $5.50 | 3d | 1 | 0.85mi |
| 90 Alhambra St San Francisco, CA | 3.0 | 2.0 | 900 | $8,695 | $9.66 | 7d | 1 | 0.85mi |
| 2007 Pacific Ave Apt 6 San Francisco, CA | 3.0 | 2.0 | 1131 | $8,000 | $7.07 | 16d | 1 | 0.89mi |
| 1369 Hyde St San Francisco, CA | 3.0 | 1.0–2.0 | 1435 | $6,695 | $4.67 | 21d | 1 | 0.91mi |
| 2140 Pacific Ave San Francisco, CA | 2.0 | 2.0 | 1600 | $11,500 | $7.19 | 21d | 1 | 0.92mi |
| 2080 Gough St San Francisco, CA | 2.0 | 2.0 | 1000 | $7,495 | $7.50 | 24d | 1 | 0.94mi |
| 2200 Pacific Ave San Francisco, CA | 2.0 | 2.0 | 1850 | $9,995 | $5.40 | 2d | 1 | 0.96mi |
| 1755 Van Ness Ave San Francisco, CA | 1.0 | 1.0 | 947 | $5,195 | $5.49 | 13d | 1 | 0.97mi |
| 1755 Van Ness Ave San Francisco, CA | 1.0 | 1.0 | 884 | $5,095 | $5.76 | 3d | 1 | 0.97mi |
| 1735 Van Ness Ave San Francisco, CA | 2.0 | 1.0 | 1064 | $12,225 | $11.49 | 7d | 2 | 0.98mi |
| 2190 Washington St San Francisco, CA | 1.0 | 1.0 | 950 | $12,000 | $12.63 | 1d | 1 | 0.98mi |
| 2360 Greenwich St San Francisco, CA | 2.0 | 2.0 | 1354 | $8,995 | $6.64 | 16d | 1 | 0.99mi |
| 1310 Jones St San Francisco, CA | 2.0 | 2.0 | 1367 | $10,250 | $7.50 | 3d | 4 | 0.99mi |
| 2280 Pacific Ave San Francisco, CA | 2.0 | 1.0 | 1600 | $10,500 | $6.56 | 23d | 1 | 0.99mi |
| 150 Lombard St San Francisco, CA | 1.0 | 1.0 | 1150 | $7,800 | $6.78 | 43d | 1 | 1.04mi |
| 1501-1519 Polk St San Francisco, CA | 2.0 | 1.0 | 1171 | $5,295 | $4.52 | 5d | 2 | 1.05mi |
| 1600 California St San Francisco, CA | 2.0 | 1.0 | 1171 | $5,295 | $4.52 | 5d | 1 | 1.06mi |
| 2398 Pacific Ave San Francisco, CA | 1.0 | 1.0 | 1000 | $8,950 | $8.95 | 21d | 1 | 1.06mi |
| 2900 Pierce St Unit 2900 San Francisco, CA | 2.0 | 2.0 | 1153 | $6,200 | $5.38 | 7d | 1 | 1.06mi |
HOA detail condo
- Monthly dues
- $1,450 · $17,400/yr
- Assessments
- None detected in remarks — confirm with the listing agent.
Listing history 15 events
-
2026-06-18days on market $60,000 Active 56 DOM
-
2026-06-17days on market $60,000 Active 55 DOM
-
2026-06-16days on market $60,000 Active 54 DOM
-
2026-06-15days on market $60,000 Active 53 DOM
-
2026-06-13days on market $60,000 Active 51 DOM
-
2026-06-13days on market $60,000 Active 50 DOM
-
2026-06-09days on market $60,000 Active 47 DOM
-
2026-06-08days on market $60,000 Active 46 DOM
-
2026-06-07days on market $60,000 Active 45 DOM
-
2026-06-04days on market $60,000 Active 42 DOM
-
2026-06-03days on market $60,000 Active 41 DOM
-
2026-06-02days on market $60,000 Active 40 DOM
-
2026-06-01days on market $60,000 Active 39 DOM
-
2026-05-31days on market $60,000 Active 38 DOM
-
2026-04-23$60,000 Active 1251-char remark
ⓘ Source: listings_history table (triggers on properties + properties_extension) + one-shot
backfill from property_details.listing_events for pre-trigger history.
Climate risk First Street
- Flood 1/10 Low FEMA zone X (unshaded) · 0% chance over 30 yrs
- Wildfire 1/10 Low
- Heat 2/10 Low 8 d/yr ≥79°F today · 17 d/yr by 30 yrs out
- Wind 1/10 Low
- Air quality 8/10 Severe 15 unhealthy d/yr today · 15 by 30 yrs out
Nearby sold comps map
Loading sold comps map…
Walkable amenities ~0.75 mi
Loading nearby amenities…
Taxation est. · year 1
- Rental income
- $78,211
- − Mortgage interest
- −$84,607
- − Property taxes
- −$22,656
- − Insurance
- −$7,552
- − Repairs & maintenance
- −$6,257
- − Management
- −$6,257
- − HOA
- −$17,400
- − Depreciation
- −$43,939
- Taxable loss
- −$110,458
- Est. tax savings @ 24.0%
- +$26,510
- After-tax cash flow
- $-54,362/yr
For passive investors: Depreciation is non-cash, so a rental often shows a tax loss while cash-flowing — sheltering income. Rental losses are passive: they offset passive income freely, and up to $25,000/yr can offset ordinary (W-2) income if you actively participate and your MAGI is under $100k (phasing out to $0 by $150k); unused losses carry forward. On sale, claimed depreciation is recaptured at up to 25%, and gains may owe capital-gains tax (a 1031 exchange can defer both). Figures are a year-1 estimate at your 24.0% rate — not tax advice; consult a CPA.
Schools (NCES district)
- District
- San Francisco Unified
- NCES district ID
- 0634410
- Math proficiency
- 50% ▬ 0.00%
- Reading proficiency
- 56% ▲ 1.00%
- Median HH income
- $81,249
- Composite
- 50.14/100
- National rank
- #4088
- State rank
- #322 of 1400 in CA
Livability — San Francisco
- Score
- 76/100
- State rank
- #90
- US rank
- #3143
Category grades
Schools grade is shown separately in the Schools card above.
Census & demographics
- Census place
- San Francisco, CA
- County
- San Francisco County · 827,552 people
- City population
- 827,552
- Metro
- San Francisco-Oakland-Berkeley, CA
- Population (ZIP)
- 54,553
- Household income
- $106,018
- Rent vs Own
- Severe rent burden
- 5272.0
Population outlook (San Francisco County) Hauer SSP2
- Today (2025)
- 1,030,936 people
- By 2030
- 1,110,409 · +7.7%
- By 2040
- 1,270,010 · +23.2%
- By 2050
- 1,435,001 · +39.2%
- By 2075
- 1,779,074 · +72.6%
- By 2100
- 1,966,767 · +90.8%
Race, ethnicity, and origin ACS 2023
- Neighborhood character
- Diverse neighborhood (Simpson 0.66)
- Race & ethnicity
- White 50% Asian 27% Hispanic / Latino 13% Two or more races 10% Black 4%
- Hispanic origin (detail)
- Mexican 7% Puerto Rican 1%
- Common ancestry
- Lithuanian 3% Italian 3% Romanian 2%
- Foreign-born
- 31% · China, Canada, Vietnam
- Languages at home
- 64% English-only · Chinese 10% Spanish 7% Other Asian/Pacific 4%
Political lean MEDSL · San Francisco
- 2024 margin
- Solid D (+64.8) · D 80.3% · R 15.5% · Other 4.1%
- 2008→2024 swing
- -5.7pp toward R · 2008: 70.5pp · 2024: 64.8pp
- All cycles
- 2024: D+64.8 2020: D+72.5 2016: D+76.1 2012: D+70.2 2008: D+70.5
Not yet ingested
- Civics
- —
Market trends
- HPI YoY
- ▲ 5.02%
- Current HPI
- 175.8886
- Rent YoY
- ▲ 15.60%
- Metro
- San Francisco-Oakland-Berkeley, CA
- State GDP YoY
- ▲ 3.21%
- F500 in state
- 116
Industry mix (Fortune 500 HQ in CA)
| Industry | F500 HQs | Revenue |
|---|---|---|
| Technology | 27 | $1,492B |
|
||
| Financial Services | 3 | $174B |
|
||
| Retail | 3 | $44B |
|
||
| Insurance | 3 | $26B |
|
||
| Media / Entertainment | 2 | $115B |
|
||
| Pharmaceuticals / Biotech | 2 | $62B |
|
||
Price history
1 event — show timeline
- 2026-04-23 Listed $60,000 BAREIS
Cash-flow waterfall
monthlySold comps — $/sqft
last 12 mo · ≤1 miLoading sold comps…