420 Island Branch Rd · Hailesboro, NY
Flood risk 9/10 · Severe
- FEMA flood zone
- X
- Chance of flooding over 30 yrs
- 0.99%
- Est. flood insurance / yr
- $507 – $1,088
Fire risk 2/10 · Minimal
- Est. fire insurance / yr
- $691 – $1,283
Heat risk 2/10 · Minimal
- Hot days now (above 93°F)
- 7 days/yr
- Hot days in 30 yrs
- 15 days/yr
Wind risk 1/10 · Minimal
- Chance of severe wind over 30 yrs
- —
Air-quality risk 2/10 · Minimal
- Unhealthy air days now
- 0 days/yr
- Unhealthy air days in 30 yrs
- 1 days/yr
Risk factors via First Street. Map © Google.
Why this score? — see what drove the D+ grade
The composite is a weighted blend of 9 inputs, each scored 0–100. Each bar is that input's sub-score; the figure is the points it added to the 100-point composite (weight × sub-score).
- Cash flow +12.7/30.0
- Appreciation +8.1/10.0
- ARV discount +7.5/15.0
- DSCR +3.8/10.0
- 1% rule +3.3/10.0
- Livability +2.6/5.0
- Rent growth +2.5/5.0
- Condition / age +2.5/5.0
- Schools +2.4/10.0
$149,900
🖨 Deal sheet (PDF) 📄 Offer letter ✓ Due diligence
Listing remarks MLS
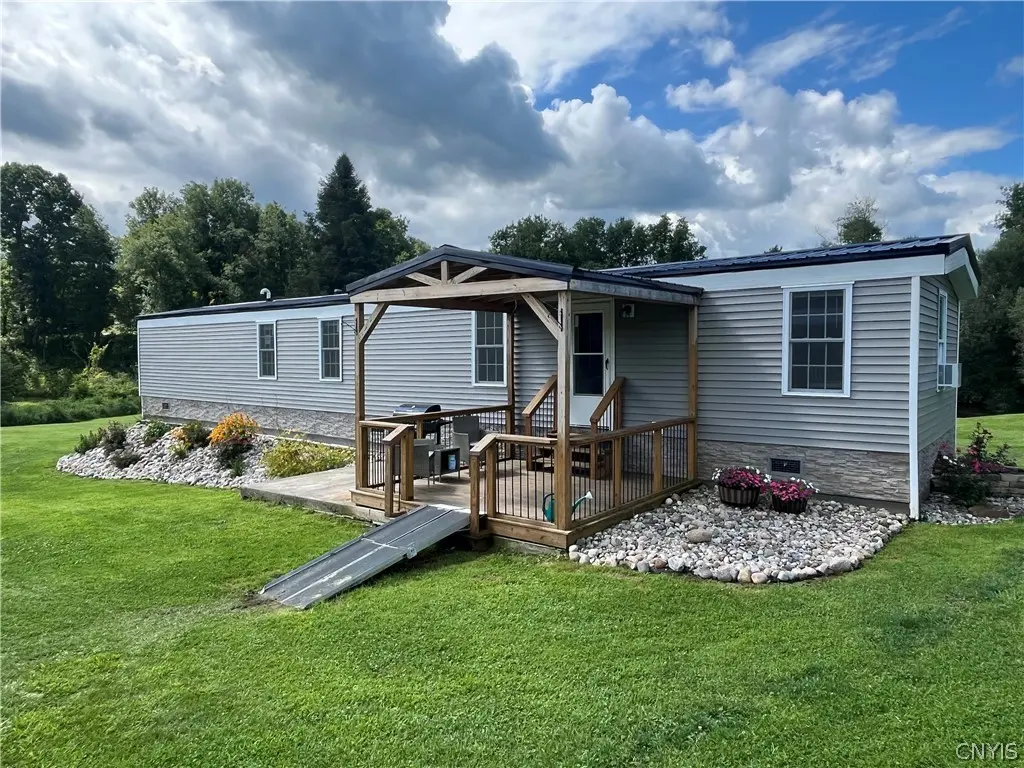
Nestled in a peaceful valley, with 365 feet on the Oswegatchie River, this completely remodeled and updated property is not to be missed. Currently used as a summer cottage, but previously a year round home. With a covered porch at the front and open deck at the rear there is plenty of space to sit and enjoy listening to the river babbling over the rocks. Inside is spotless, with many new upgrades new roof, siding, electric, propane heat, new bathroom, flooring and insulation, to name a few, ask your realtor for details. Sitting on 1.6 acres this property offers so much, with a detached garage, large shed which would make a great spot to hang out closer to the river and share this spot with friends and family. Current owners had extensive landscaping done over the past few years. Spend long summer days swimming and fishing off the manicured lawn, or hop in a boat and enjoy exploring upstream surrounded by tranquil countryside, this property is not to be missed it makes a wonderful year round or summer retreat.
Key facts
- Covered porch
- Open deck
- Large shed
Tags
Neighborhood map
What this means for you Summary
Snapshot
- This is a 3-bed/1.0-bath manufactured listed at $150k.
Deal economics
- At list price, monthly cash flow is $-83 ($-993/yr) — negative.
- To cash-flow at today's rent, offer at most $135k (9.7% below list).
- To meet the 1% rule (rent ≥ 1% of price), the offer needs to be $125k (16.7% below list).
- Recommended offer: $125k (16.7% below list) — sets the bar for 1% rule.
Location & tenants
- Location reads 52/100 on livability (#1,162 in NY) — a working-class tenant base; expect higher turnover. Strengths: cost of living A+; Watch: employment D, health & safety D, crime F.
- Gouverneur Central School District (town): math 23% / reading 34% proficiency, ranked #582 of 590 in NY (top 99%) — low school quality limits family demand, transient renter base, plan for 1-2y turnover.
- Zoned schools: Gouverneur Elementary School (math 12% / reading 32%, grade F, #1,923 of 2,108 statewide, top 92%, 506 students, 62% FRL); Gouverneur Middle School (math 12% / reading 34%, grade F, #646 of 729 statewide, top 89%, 472 students, 68% FRL); Gouverneur High School (math 92% / reading 75%, grade A, #409 of 1,100 statewide, top 39%, 467 students, 63% FRL) — zoned schools average 64% FRL vs 46% district-wide (19 pts higher); higher-poverty schools than district average — tighter screening recommended.
- Zoned-school proficiency averages 43% at this address vs 28% district-wide (+14 pts) — the actual schools serving this property are materially stronger than the Gouverneur Central School District average implies; a family-tenant draw the district grade alone would hide.
- Market conditions: 63 active listings in the ZIP; 215 units permitted in St. Lawrence County in 2024 (0 in 5+ unit buildings).
Forward outlook
- In year one you build about $10k of equity ($1k loan paydown + $9k appreciation (6.2% local appreciation)).
- St. Lawrence County population projected at -14% by 2050 — secular population decline; favor cash flow + early exit over multi-decade hold.
- At projected returns (6.2% appreciation + 3.0% rent growth), your $42k cash investment doubles in ~4 years — after that, you're playing with house money.
- By year 4, paydown + projected appreciation supports a ~$36k cash-out refi (75% LTV) — recoverable capital for the next deal without selling this one.
Negotiation context
- It's been on market 48 days — a 3% lower offer ($145k) is reasonable based on typical stale-listing flexibility.
- 7 sale attempts since 8y ago with the ask held roughly flat each time — persistent listings suggest the price (not the market) is what's stuck; bring a comps-based counter.
- Current owner paid $54k; list at $150k implies a 178% gain — meaningful room to come down on a strong offer.
Risks & watch-outs
- Watch-outs: flood insurance adds $66/mo.
Questions for the listing agent
- What do current leases actually rent for vs. the listed asking? Can we see a recent rent roll and the last 12 months of T-12 income?
- It's been on market 48 days. Have you received any prior offers? Is the seller open to a 17% concession, seller financing, or rate buy-down credit?
- What's the actual annual flood-insurance premium (NFIP or private), and is the property in a SFHA with mandatory coverage?
- Is there a deadline driving the sale (1031 exchange, divorce, estate, relocation)? That informs how much negotiation room exists.
- Schools are F-rated, which usually means shorter tenancies and higher turnover. Who's the typical renter profile here, and what's been the actual vacancy rate?
- Crime grade is F in this area — have there been break-ins, vandalism, or insurance claims at this property in the last 3 years? What carrier currently insures it and at what premium?
- The area grade is low — what's the realistic commute time and amenity access for the typical tenant pool here? Any planned neighborhood developments (good or bad) we should know about?
- What's the average days-on-market for RENTAL listings here right now (not sales)? A rising rental-DOM trend means longer vacancies and softer asking-rent achievability than the comps imply.
- What's the recent tenant-quality profile in this submarket — average credit score on applications, eviction rate, late-payment / NSF rate, and stable-employment percentage? A property-management company in the area should have these aggregated.
- How much new for-sale + rental construction is in the pipeline within 1–3 miles? Heavy new supply typically softens prices + rents 12–24 months out; constrained supply supports both.
Investment metrics
- 1% rule
- 0.83% ✗
- Cap rate
- 6.16%
- Cash-on-cash
- -0.47%
- DSCR
- 0.98
- GRM
- 10.0
CMA / ARV
No comps found within radius.
Projected returns pro-forma
6.25% appreciation · 3.0% rent growth · sell at horizon
- IRR
- 14.1%
- Equity multiple
- 1.96×
- Total profit
- $40,294
- Equity at exit
- $96,621
- IRR
- 14.4%
- Equity multiple
- 3.91×
- Total profit
- $122,165
- Equity at exit
- $177,317
Cash invested: $41,972 (down + closing). Projections, not guarantees.
Landlord ↔ Tenant lean methodology
- Overall (STATE)
- 15 Strongly Tenant-Friendly
- State New York
- 15 Strongly Tenant-Friendly · D+10
- County
- — inherits STATE
- City
- — inherits STATE
ZIP-level market 13642
- Home prices YoY
- 1.8%
- Active inventory
- 63
- Price-to-rent
- 10.0×
Monthly cashflow live
- Estimated rent
- $1,249 medium interval (Pro) →
- Mortgage (P&I)
- −$786
- Tax from tax record
- −$154 /mo · $1,854/yr
- Insurance
- −$62
- Flood insurance flood zone
- −$66 /mo · $798/yr
- HOA
- −$0
- Vacancy / Maint / Mgmt
- −$262
- Net cashflow
- $-83
Break-even live
Sensitivity live
| Price | -10% $2 | -5% $-40 | +0% $-83 | +5% $-125 | +10% $-168 |
|---|---|---|---|---|---|
| Rent | -10% $-181 | -5% $-132 | +0% $-83 | +5% $-33 | +10% $16 |
| Rate | -1.0pp $-7 | -0.5pp $-45 | base $-83 | +0.5pp $-122 | +1.0pp $-161 |
UW: 25.0% down · 7.5% · 30yr · 1.5% tax · 5.0% vac · 8.0% maint · 8.0% mgmt
Financing live
Cash to close
- Down payment
- $37,475
- Closing costs
- $4,497
- Reserves months
- —
- Total cash needed
- —
Loan-product check · same deal, 3 products live
Conventional
25% down · 7.5% · 30yr
- Down + closing
- —
- Monthly P&I
- —
- Monthly cashflow
- —
- DSCR
- —
- Eligible?
- —
Personal DTI + credit; lowest rate.
DSCR
20% down · 8.5% · 30yr
- Down + closing
- —
- Monthly P&I
- —
- Monthly cashflow
- —
- DSCR
- —
- Eligible?
- —
No personal income docs; deal must DSCR.
Hard money
10% down · 12.0% · 12mo
- Down + closing
- —
- Monthly P&I
- —
- Monthly cashflow
- —
- DSCR
- —
- Eligible?
- —
Short-term bridge; refi at stabilization.
Listing history 16 events
-
2026-04-03$149,900 Active 1025-char remark
Show marketing remark (963 chars)
Nestled in a peaceful valley, with 365 foot on the Oswegatchie River, this completely remodeled and updated year round home is not to be missed. With a covered porch at the front and open deck at the rear there is plenty of space to sit and enjoy listening to the river babbling over the rocks. Inside is spotless, with many new upgrades new roof, siding, electric, propane heat, new bathroom, flooring and insulation, to name a few, ask your realtor for details. Sitting on 1.6 acres this property offers so much, with a detached garage, large shed which would make a great spot to hang out closer to the river, and share this spot with friends and family. Current owners had extensive landscaping done over the past few years. Spend long summer days swimming and fishing off the manicured lawn, or hop in a boat and enjoy exploring upstream surrounded by tranquil countryside, this property is not to be missed it makes a wonderful year round or summer retreat.
-
2026-04-03$149,900 Active 963-char remark
Show marketing remark (963 chars)
Nestled in a peaceful valley, with 365 foot on the Oswegatchie River, this completely remodeled and updated year round home is not to be missed. With a covered porch at the front and open deck at the rear there is plenty of space to sit and enjoy listening to the river babbling over the rocks. Inside is spotless, with many new upgrades new roof, siding, electric, propane heat, new bathroom, flooring and insulation, to name a few, ask your realtor for details. Sitting on 1.6 acres this property offers so much, with a detached garage, large shed which would make a great spot to hang out closer to the river, and share this spot with friends and family. Current owners had extensive landscaping done over the past few years. Spend long summer days swimming and fishing off the manicured lawn, or hop in a boat and enjoy exploring upstream surrounded by tranquil countryside, this property is not to be missed it makes a wonderful year round or summer retreat.
-
2025-10-31historical
-
2025-10-07price $149,900
-
2025-10-07price $149,900
-
2025-06-13price $159,900
-
2025-06-13price $159,900
-
2025-04-12$169,900 Active
-
2025-04-12$169,900 Active
-
2021-09-22soldstatus $54,000
-
2021-09-21soldstatus $54,000
-
2021-09-21soldstatus $54,000
-
2021-04-28$49,000
-
2018-12-06historical
-
2018-06-06$55,000
-
2018-06-05$49,000
ⓘ Source: listings_history table (triggers on properties + properties_extension) + one-shot
backfill from property_details.listing_events for pre-trigger history.
Tax reassessment forecast NY · Partial reset (capped growth)
- Current annual tax
- $1,854 · $154/mo
- Projected year-2 tax
- $2,194 · $183/mo
- Expected delta
- +$340/yr (+$28/mo · 18.3%)
ⓘ Screening estimate from a state-policy table — verify with the county assessor before closing.
Climate risk First Street
- Flood 9/10 Extreme FEMA zone X · 99% chance over 30 yrs
- Wildfire 2/10 Low
- Heat 2/10 Low 7 d/yr ≥93°F today · 15 d/yr by 30 yrs out
- Wind 1/10 Low
- Air quality 2/10 Low 0 unhealthy d/yr today · 1 by 30 yrs out
Nearby sold comps map
Loading sold comps map…
Walkable amenities ~0.75 mi
Loading nearby amenities…
Taxation est. · year 1
- Rental income
- $14,989
- − Mortgage interest
- −$8,397
- − Property taxes
- −$1,854
- − Insurance
- −$1,547
- − Repairs & maintenance
- −$1,199
- − Management
- −$1,199
- − Depreciation
- −$4,361
- Taxable loss
- −$3,568
- Est. tax savings @ 24.0%
- +$856
- After-tax cash flow
- $-137/yr
For passive investors: Depreciation is non-cash, so a rental often shows a tax loss while cash-flowing — sheltering income. Rental losses are passive: they offset passive income freely, and up to $25,000/yr can offset ordinary (W-2) income if you actively participate and your MAGI is under $100k (phasing out to $0 by $150k); unused losses carry forward. On sale, claimed depreciation is recaptured at up to 25%, and gains may owe capital-gains tax (a 1031 exchange can defer both). Figures are a year-1 estimate at your 24.0% rate — not tax advice; consult a CPA.
Schools (NCES district)
- District
- Gouverneur Central School District
- NCES district ID
- 3612360
- Math proficiency
- 23% ▼ -8.00%
- Reading proficiency
- 34% ▲ 8.00%
- Median HH income
- $41,217
- Composite
- 24.08/100
- National rank
- #7757
- State rank
- #582 of 590 in NY
Livability — Hailesboro
- Score
- 52/100
- State rank
- #1162
- US rank
- #24781
Category grades
Schools grade is shown separately in the Schools card above.
Census & demographics
- Population (ZIP)
- 9,018
Population outlook (St. Lawrence County) Hauer SSP2
- Today (2025)
- 110,027 people
- By 2030
- 107,455 · -2.3%
- By 2040
- 100,492 · -8.7%
- By 2050
- 94,254 · -14.3%
- By 2075
- 80,175 · -27.1%
- By 2100
- 63,140 · -42.6%
Race, ethnicity, and origin ACS 2023
- Neighborhood character
- Predominantly White (86%)
- Race & ethnicity
- White 86% Hispanic / Latino 6% Two or more races 6% Black 4%
- Hispanic origin (detail)
- Puerto Rican 2% Dominican 1%
- Common ancestry
- Lithuanian 8% Slovak 4% Serbian 2%
- Foreign-born
- 3% · Canada
- Languages at home
- 94% English-only · Spanish 3% Other Indo-European 2%
Political lean MEDSL · St. Lawrence
- 2024 margin
- R (+18.0) · D 41.0% · R 59.0%
- 2008→2024 swing
- -34.3pp toward R · 2008: 16.3pp · 2024: -18.0pp
- All cycles
- 2024: R+18.0 2020: R+11.7 2016: R+10.8 2012: D+16.6 2008: D+16.3
Not yet ingested
- Civics
- —
Market trends
- HPI YoY
- ▲ 6.25%
- Current HPI
- 349.6603
- Rent YoY
- —
- Metro
- —
- State GDP YoY
- ▲ 2.60%
- F500 in state
- 92
Industry mix (Fortune 500 HQ in NY)
| Industry | F500 HQs | Revenue |
|---|---|---|
| Financial Services | 10 | $950B |
|
||
| Consumer Goods | 9 | $162B |
|
||
| Insurance | 4 | $225B |
|
||
| Telecommunications | 2 | $144B |
|
||
| Pharmaceuticals | 2 | $112B |
|
||
| Media / Entertainment | 2 | $69B |
|
||
Price history
+205.9% since first listed16 events — show timeline
- 2026-04-03 Listed $149,900 SLCMLS
- 2026-04-03 Listed $149,900 CNYIS
- 2025-10-31 Listing Removed — CNYIS
- 2025-10-07 Price Changed $149,900 CNYIS
- 2025-10-07 Price Changed $149,900 SLCMLS
- 2025-06-13 Price Changed $159,900 SLCMLS
- 2025-06-13 Price Changed $159,900 CNYIS
- 2025-04-12 Listed $169,900 CNYIS
- 2025-04-12 Listed $169,900 SLCMLS
- 2021-09-22 Sold (Public Records) $54,000 Public Records
- 2021-09-21 Sold (MLS) $54,000 SLCMLS
- 2021-09-21 Sold (MLS) $54,000 CNYIS
- 2021-04-28 Listed $49,000 CNYIS
- 2018-12-06 Listing Removed — CNYIS
- 2018-06-06 Listed $55,000 CNYIS
- 2018-06-05 Listed $49,000 SLCMLS
Property tax history
+3.1%/yrLatest (2025): $1,854 · -1.2% YoY. Source: county tax records.
Cash-flow waterfall
monthlySold comps — $/sqft
last 12 mo · ≤1 miLoading sold comps…