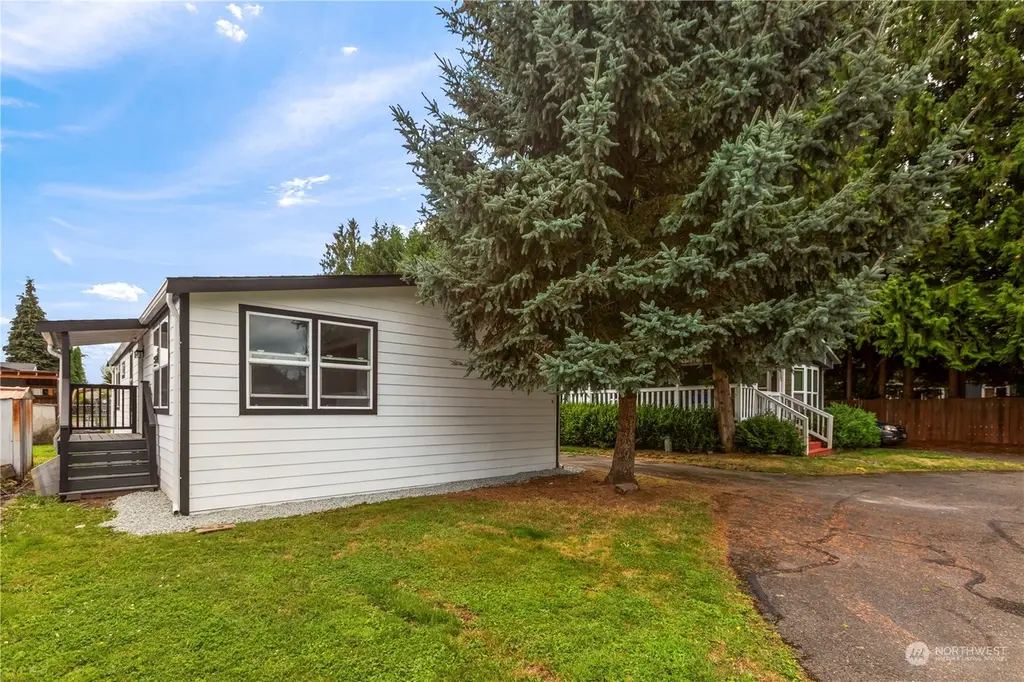
15806 54th Street Ct E #59 · Sumner, WA
Flood risk 7/10 · Major
- FEMA flood zone
- X (unshaded)
- Chance of flooding over 30 yrs
- 0.96%
- Est. flood insurance / yr
- $507 – $1,088
Fire risk 3/10 · Minor
- Est. fire insurance / yr
- $604 – $1,122
Heat risk 3/10 · Minor
- Hot days now (above 87°F)
- 7 days/yr
- Hot days in 30 yrs
- 15 days/yr
Wind risk 1/10 · Minimal
- Chance of severe wind over 30 yrs
- —
Air-quality risk 7/10 · Major
- Unhealthy air days now
- 9 days/yr
- Unhealthy air days in 30 yrs
- 11 days/yr
Risk factors via First Street. Map © Google.
Why this score? — see what drove the B grade
The composite is a weighted blend of 9 inputs, each scored 0–100. Each bar is that input's sub-score; the figure is the points it added to the 100-point composite (weight × sub-score).
- Cash flow +30.0/30.0
- 1% rule +10.0/10.0
- DSCR +10.0/10.0
- ARV discount +7.5/15.0
- Schools +6.2/10.0
- Condition / age +4.0/5.0
- Rent growth +3.6/5.0
- Livability +3.4/5.0
- Appreciation +0.0/10.0
$149,000
🖨 Deal sheet 📄 Offer letter ✓ Due diligence
Listing remarks
SPRING PRICE CHANGE! ALL-AGES PARK! This is the one you’ve been waiting for! Welcome to a fully refreshed, move-in ready home in Summerville Estates where style, comfort, and convenience come together seamlessly. From the moment you arrive, the upgrades shine—new roof, new windows, and fresh interior and exterior paint deliver a crisp, modern look that feels brand new. Inside, the bright, open layout draws you in, leading to a show-stopping kitchen featuring quartz countertops, sleek white cabinetry, and brand-new appliances—perfect for hosting, gathering, and everyday living. Every detail has been dialed in with stylish new flooring, upgraded lighting, and plush, comforta
Key facts
- Quartz countertops
- New roof
- 2 parking spots
Tags
Neighborhood map
What this means for you Summary
Snapshot
- This is a 3-bed/2.0-bath manufactured listed at $149k. Condition is rated good.
Deal economics
- At list price, monthly cash flow is $704 ($8k/yr) — positive.
- The deal already cash-flows at list — no discount required.
- Meets the 1% rule at list price ($2k rent vs $149k).
- Recommended offer: $131k (12.0% below list) — sets the bar for market timing.
- Cap rate 12.5% vs local median 2.3% in Sumner — top-decile yield for the area; either an underpriced asset or a hidden risk that comps aren't pricing in. Stress-test before assuming the spread holds.
Location & tenants
- Location reads 68/100 on livability (#265 in WA) — a middle-class / working-renter tenant base. Strengths: housing A+, employment B+; Watch: crime D+, amenities F, commute F.
- Sumner School District (suburban): math 64% / reading 73% proficiency, ranked #18 of 291 in WA (top 6%) — acceptable for families but not a draw, mixed tenant base, ~2y average lease.
- Market conditions: Rents rising fast (+4.3%/yr); 60 active listings in the ZIP; 21 comparable units currently listed for rent nearby; rentals leasing fast (median 12d on market — plan ~1-2 weeks tenant-placement turnaround); solid renter incomes; 3,209 units permitted in Pierce County in 2024 (1,269 in 5+ unit buildings).
Forward outlook
- Local home prices are declining (-3.0%/yr); year-one equity from $1k of loan paydown is wiped out by about $4k of value loss. Plan a longer hold.
- Pierce County population projected at +26% by 2050 — long-run rental-demand tailwind backs the buy-and-hold thesis.
- At projected returns (-3.0% appreciation + 4.3% rent growth), your $42k cash investment doubles in ~6 years — after that, you're playing with house money.
Negotiation context
- It's been on market 647 days — a 12% lower offer ($131k) is reasonable based on typical stale-listing flexibility.
- 6 sale attempts since 2y ago; this cycle's ask has dropped $20k (12%) from the opening price — seller is motivated, your offer sets the floor, not the list.
Risks & watch-outs
- Watch-outs: flood insurance adds $66/mo.
- Climate carrying-cost: major flood risk — expect insurance premiums to compound above CPI over the hold.
Questions for the listing agent
- It's been on market 647 days. Have you received any prior offers? Is the seller open to a 12% concession, seller financing, or rate buy-down credit?
- What's the actual annual flood-insurance premium (NFIP or private), and is the property in a SFHA with mandatory coverage?
- Why hasn't it sold? Are there any deal-killer items the seller is aware of (foundation, flood, title, zoning, code violations)?
- Is there a deadline driving the sale (1031 exchange, divorce, estate, relocation)? That informs how much negotiation room exists.
- Schools are B-rated — typically a magnet for longer-tenancy family renters. What's the average tenant stay here, and is there a school-zone premium baked into asking?
- Crime grade is D in this area — have there been break-ins, vandalism, or insurance claims at this property in the last 3 years? What carrier currently insures it and at what premium?
- What's the average days-on-market for RENTAL listings here right now (not sales)? A rising rental-DOM trend means longer vacancies and softer asking-rent achievability than the comps imply.
- What's the recent tenant-quality profile in this submarket — average credit score on applications, eviction rate, late-payment / NSF rate, and stable-employment percentage? A property-management company in the area should have these aggregated.
- How much new for-sale + rental construction is in the pipeline within 1–3 miles? Heavy new supply typically softens prices + rents 12–24 months out; constrained supply supports both.
Investment metrics
- 1% rule
- 1.53% ✓
- Cap rate
- 12.50%
- Cash-on-cash
- 22.16%
- DSCR
- 1.99
- GRM
- 5.4
CMA / ARV
- ARV (median comp)
- $89,999
- List price
- $149,000
- Delta
- 65.56%
- Verdict
- OVERPRICED
- Comps
- 3 within 1.0 mi
Show comp detail 4 sales within ~0.75 mi
| Address | Dist | Beds/Ba | Sqft | Sold | Price | $/sf | Match |
|---|---|---|---|---|---|---|---|
| 15708 E 52nd St E | 0.14mi | 3/2.0 | 1,296 (+4%) | 23mo | $132,500 | $102 | 68 |
| 19120 1st St E | 0.18mi | 3/2.0 | 1,200 (-4%) | 22mo | $165,000 | $138 | 67 |
| 5210 158th Ave E #44 | 0.17mi | 3/2.0 | 1,404 (+12%) | 18mo | $117,000 | $83 | 57 |
| 15220 49th Street Ct E #18 | 0.45mi | 2/2.0 (-1) | 1,148 (-8%) | 14mo | $140,000 | $122 | 49 |
Match score weights: distance 35% · size 25% · config 20% · recency 20%. Top-matched comps best support the ARV.
Projected returns pro-forma
-3.0% appreciation · 4.3% rent growth · sell at horizon
- IRR
- 14.0%
- Equity multiple
- 1.57×
- Total profit
- $23,785
- Equity at exit
- $22,216
- IRR
- 23.8%
- Equity multiple
- 3.19×
- Total profit
- $91,471
- Equity at exit
- $12,883
Cash invested: $41,720 (down + closing). Projections, not guarantees.
Landlord ↔ Tenant lean methodology
- Overall (STATE)
- 28 Tenant-Leaning
- State Washington
- 28 Tenant-Leaning · D+8
- County
- — inherits STATE
- City
- — inherits STATE
ZIP-level market 98390
- Rents YoY
- 4.3%
- Active inventory
- 60
- Price-to-rent
- 5.4×
Monthly cashflow live
- Estimated rent
- $2,279 high interval (Pro) →
- Mortgage (P&I)
- −$781
- Tax est. 1.5%
- −$186 /mo · $2,235/yr
- Insurance
- −$62
- Flood insurance flood zone
- −$66 /mo · $798/yr
- HOA
- −$0
- Vacancy / Maint / Mgmt
- −$479
- Net cashflow
- $704
Break-even live
UW: 25.0% down · 7.5% · 30yr · 1.5% tax · 5.0% vac · 8.0% maint · 8.0% mgmt
Financing live
Cash to close
- Down payment
- $37,250
- Closing costs
- $4,470
- Reserves months
- —
- Total cash needed
- —
Loan-product check · same deal, 3 products live
Conventional
25% down · 7.5% · 30yr
- Down + closing
- —
- Monthly P&I
- —
- Monthly cashflow
- —
- DSCR
- —
- Eligible?
- —
Personal DTI + credit; lowest rate.
DSCR
20% down · 8.5% · 30yr
- Down + closing
- —
- Monthly P&I
- —
- Monthly cashflow
- —
- DSCR
- —
- Eligible?
- —
No personal income docs; deal must DSCR.
Hard money
10% down · 12.0% · 12mo
- Down + closing
- —
- Monthly P&I
- —
- Monthly cashflow
- —
- DSCR
- —
- Eligible?
- —
Short-term bridge; refi at stabilization.
Rent comps 21 comps
| Address | Beds | Baths | Sqft | Rent | $/sqft | DOM | Units | Dist |
|---|---|---|---|---|---|---|---|---|
| 5606 Parker Rd E Unit C Sumner, WA | 2.0 | 1.0 | 820 | $1,595 | $1.95 | 43d | 1 | 0.14mi |
| 15906 Elm St E Unit 3 Sumner, WA | 3.0 | 2.5 | 1500 | $2,350 | $1.57 | 3d | 1 | 0.24mi |
| 15318 Washington St Sumner, WA | 3.0 | 2.0–2.5 | 1288 | $3,193 | $2.48 | 1d | 3 | 0.28mi |
| 5919 158th Avenue Ct E Sumner, WA | 1.0–2.0 | 1.0 | 790 | $1,885 | $2.39 | 1d | 3 | 0.28mi |
| 5816 162nd Ave E Sumner, WA | 1.0–2.0 | 1.0–2.0 | 766 | $2,695 | $3.52 | 1d | 12 | 0.32mi |
| 15367 Main St E Sumner, WA | 1.0–2.0 | 1.0–2.0 | 851 | $2,543 | $2.99 | 1d | 12 | 0.39mi |
| 15213 Elm St E Sumner, WA | 2.0 | 1.0–1.5 | 1100 | $2,172 | $1.98 | 1d | 2 | 0.41mi |
| 15106 Elm St E Unit 15118-06 Sumner, WA | 2.0 | 1.0 | 1100 | $1,995 | $1.81 | 12d | 1 | 0.44mi |
| 15106 Elm St E Unit 15118-04 Sumner, WA | 2.0 | 2.0 | 1200 | $2,199 | $1.83 | 12d | 1 | 0.44mi |
| 15106 Elm St E Unit 15106-01 Sumner, WA | 2.0 | 2.0 | 1200 | $2,250 | $1.88 | 12d | 1 | 0.44mi |
| 15716 63rd Street Ct E Unit B Sumner, WA | 2.0 | 1.5 | 896 | $1,700 | $1.90 | 24d | 1 | 0.49mi |
| 1710 Valley Ave Unit 1720-B4 Sumner, WA | 2.0 | 1.0 | 900 | $1,950 | $2.17 | 21d | 1 | 0.53mi |
| 15881 64th St E Sumner, WA | 1.0–2.0 | 1.0 | 725 | $2,145 | $2.96 | 1d | 3 | 0.53mi |
| 1612 Valley Ave E Sumner, WA | 2.0 | 1.0 | 775 | $1,495 | $1.93 | 4d | 1 | 0.54mi |
| 1801 16th St Unit 16 Sumner, WA | 2.0 | 1.0 | 725 | $1,445 | $1.99 | 12d | 1 | 0.61mi |
| 16120 64th St E Sumner, WA | 2.0 | 2.5 | 1224 | $2,774 | $2.27 | 1d | 5 | 0.64mi |
| 1416 McMillan Ave Unit B4 Sumner, WA | 2.0 | 2.5 | 1260 | $2,400 | $1.90 | 24d | 1 | 0.83mi |
| 1228 Fryar Ave Sumner, WA | 1.0–3.0 | 1.0–2.0 | 906 | $3,005 | $3.31 | 1d | 23 | 1.18mi |
| 728 Cherry Ave Apt 5 Sumner, WA | 2.0 | 1.0 | 780 | $1,350 | $1.73 | 24d | 1 | 1.26mi |
| 728 Cherry Ave Sumner, WA | 2.0 | 1.0 | 780 | $1,350 | $1.73 | 43d | 1 | 1.26mi |
| 7105 142nd Ave E Unit A Sumner, WA | 2.0 | 1.0 | 1150 | $1,925 | $1.67 | 24d | 1 | 1.40mi |
Listing history 24 events
-
2026-06-18days on market $149,000 Active 647 DOM
-
2026-06-17days on market $149,000 Active 646 DOM
-
2026-06-16days on market $149,000 Active 645 DOM
-
2026-06-15days on market $149,000 Active 644 DOM
-
2026-06-13days on market $149,000 Active 642 DOM
-
2026-06-09days on market $149,000 Active 638 DOM
-
2026-06-08days on market $149,000 Active 637 DOM
-
2026-06-07days on market $149,000 Active 636 DOM
-
2026-06-04days on market $149,000 Active 633 DOM
-
2026-06-03days on market $149,000 Active 632 DOM
-
2026-06-02days on market $149,000 Active 631 DOM
-
2026-06-01days on market $149,000 Active 630 DOM
-
2026-05-31days on market $149,000 Active 629 DOM
-
2026-04-03status Active
-
2026-03-16price $149,000
-
2025-10-24status Active
-
2025-10-21status Pending
-
2025-10-02status Active
-
2025-06-22status Active
-
2025-06-14status Pending
-
2025-03-04price $159,000
-
2024-11-07price $164,000
-
2024-11-02status Active
-
2024-08-24$169,000 Active
ⓘ Source: listings_history table (triggers on properties + properties_extension) + one-shot
backfill from property_details.listing_events for pre-trigger history.
Climate risk First Street
- Flood 7/10 Severe FEMA zone X (unshaded) · 96% chance over 30 yrs
- Wildfire 3/10 Moderate
- Heat 3/10 Moderate 7 d/yr ≥87°F today · 15 d/yr by 30 yrs out
- Wind 1/10 Low
- Air quality 7/10 Severe 9 unhealthy d/yr today · 11 by 30 yrs out
Nearby sold comps map
Loading sold comps map…
Walkable amenities ~0.75 mi
Loading nearby amenities…
Taxation est. · year 1
- Rental income
- $27,344
- − Mortgage interest
- −$8,346
- − Property taxes
- −$2,235
- − Insurance
- −$1,542
- − Repairs & maintenance
- −$2,187
- − Management
- −$2,187
- − Depreciation
- −$4,335
- Taxable income
- $6,510
- Est. tax owed @ 24.0%
- −$1,562
- After-tax cash flow
- $6,885/yr
For passive investors: Depreciation is non-cash, so a rental often shows a tax loss while cash-flowing — sheltering income. Rental losses are passive: they offset passive income freely, and up to $25,000/yr can offset ordinary (W-2) income if you actively participate and your MAGI is under $100k (phasing out to $0 by $150k); unused losses carry forward. On sale, claimed depreciation is recaptured at up to 25%, and gains may owe capital-gains tax (a 1031 exchange can defer both). Figures are a year-1 estimate at your 24.0% rate — not tax advice; consult a CPA.
Condition & rehab AI · 12 photos
This fully refreshed, move-in ready home in Summerville Estates offers a modern and stylish living space with new updates throughout, making it an attractive option for both buyers and renters.
Value-add opportunities
- Both Landscaping and curb appeal improvements — Enhances curb appeal and can attract more buyers.
- Both Add smart home features — Improves convenience and can be a selling point for buyers.
- Both Install smart thermostat — Saves energy and can be a selling point for buyers.
- Both Add smart lighting — Saves energy and can be a selling point for buyers.
Renovation cost estimate screening
Value-add ROI direction
- Both Landscaping and curb appeal improvements — Enhances curb appeal and can attract more buyers. ↑
- Both Add smart home features — Improves convenience and can be a selling point for buyers. ↑
- Both Install smart thermostat — Saves energy and can be a selling point for buyers. ↑
- Both Add smart lighting — Saves energy and can be a selling point for buyers. ↑
ⓘ Cost ranges are severity-bucket heuristics (US national rule-of-thumb). Get contractor quotes + a written scope before underwriting a rehab budget.
Schools (NCES district)
- District
- Sumner School District
- NCES district ID
- 5308610
- Math proficiency
- 64% ▲ 1.00%
- Reading proficiency
- 73% ▬ 0.00%
- Median HH income
- $76,138
- Composite
- 61.86/100
- National rank
- #1497
- State rank
- #18 of 291 in WA
Livability — Sumner
- Score
- 68/100
- State rank
- #265
- US rank
- #9164
Category grades
Schools grade is shown separately in the Schools card above.
Census & demographics
- Census place
- Sumner, WA
- County
- Pierce County · 788,257 people
- City population
- 11,546
- Metro
- Seattle-Tacoma-Bellevue, WA
- Population (ZIP)
- 11,546
- Household income
- $97,795
- Rent vs Own
- Severe rent burden
- 304.0
Population outlook (Pierce County) Hauer SSP2
- Today (2025)
- 956,648 people
- By 2030
- 1,010,862 · +5.7%
- By 2040
- 1,113,170 · +16.4%
- By 2050
- 1,206,524 · +26.1%
- By 2075
- 1,436,425 · +50.2%
- By 2100
- 1,563,654 · +63.5%
Race, ethnicity, and origin ACS 2023
- Neighborhood character
- Predominantly White (73%)
- Race & ethnicity
- White 73% Hispanic / Latino 18% Two or more races 12% Native American 2% Asian 1%
- Hispanic origin (detail)
- Mexican 13%
- Common ancestry
- Portuguese 5% Italian 3% Slovak 3%
- Foreign-born
- 9% · Canada, Guatemala
- Languages at home
- 87% English-only · Spanish 10% Russian/Polish/Slavic 2%
Political lean MEDSL · Pierce
- 2024 margin
- D (+10.8) · D 53.9% · R 43.1% · Other 3.0%
- 2008→2024 swing
- -1.4pp toward R · 2008: 12.2pp · 2024: 10.8pp
- All cycles
- 2024: D+10.8 2020: D+11.2 2016: D+7.5 2012: D+11.0 2008: D+12.2
Not yet ingested
- Civics
- —
Market trends
- HPI YoY
- ▼ -235.16%
- Current HPI
- 302.9378
- Rent YoY
- ▲ 4.30%
- Metro
- Seattle-Tacoma-Bellevue, WA
- State GDP YoY
- ▲ 4.65%
- F500 in state
- 22
Industry mix (Fortune 500 HQ in WA)
| Industry | F500 HQs | Revenue |
|---|---|---|
| Retail | 2 | $269B |
|
||
| Technology / Retail | 1 | $638B |
|
||
| Technology | 1 | $245B |
|
||
| Telecommunications | 1 | $38B |
|
||
| Food / Beverage | 1 | $36B |
|
||
| Automotive / Trucks | 1 | $34B |
|
||
Price history
-11.8% since first listed11 events — show timeline
- 2026-04-03 Relisted — NWMLS as Distributed by MLS Grid
- 2026-03-16 Price Changed $149,000 NWMLS as Distributed by MLS Grid
- 2025-10-24 Relisted — NWMLS as Distributed by MLS Grid
- 2025-10-21 Pending — NWMLS as Distributed by MLS Grid
- 2025-10-02 Relisted — NWMLS as Distributed by MLS Grid
- 2025-06-22 Relisted — NWMLS as Distributed by MLS Grid
- 2025-06-14 Pending — NWMLS as Distributed by MLS Grid
- 2025-03-04 Price Changed $159,000 NWMLS as Distributed by MLS Grid
- 2024-11-07 Price Changed $164,000 NWMLS as Distributed by MLS Grid
- 2024-11-02 Relisted — NWMLS as Distributed by MLS Grid
- 2024-08-24 Listed $169,000 NWMLS as Distributed by MLS Grid
Cash-flow waterfall
monthlySold comps — $/sqft
last 12 mo · ≤1 miLoading sold comps…