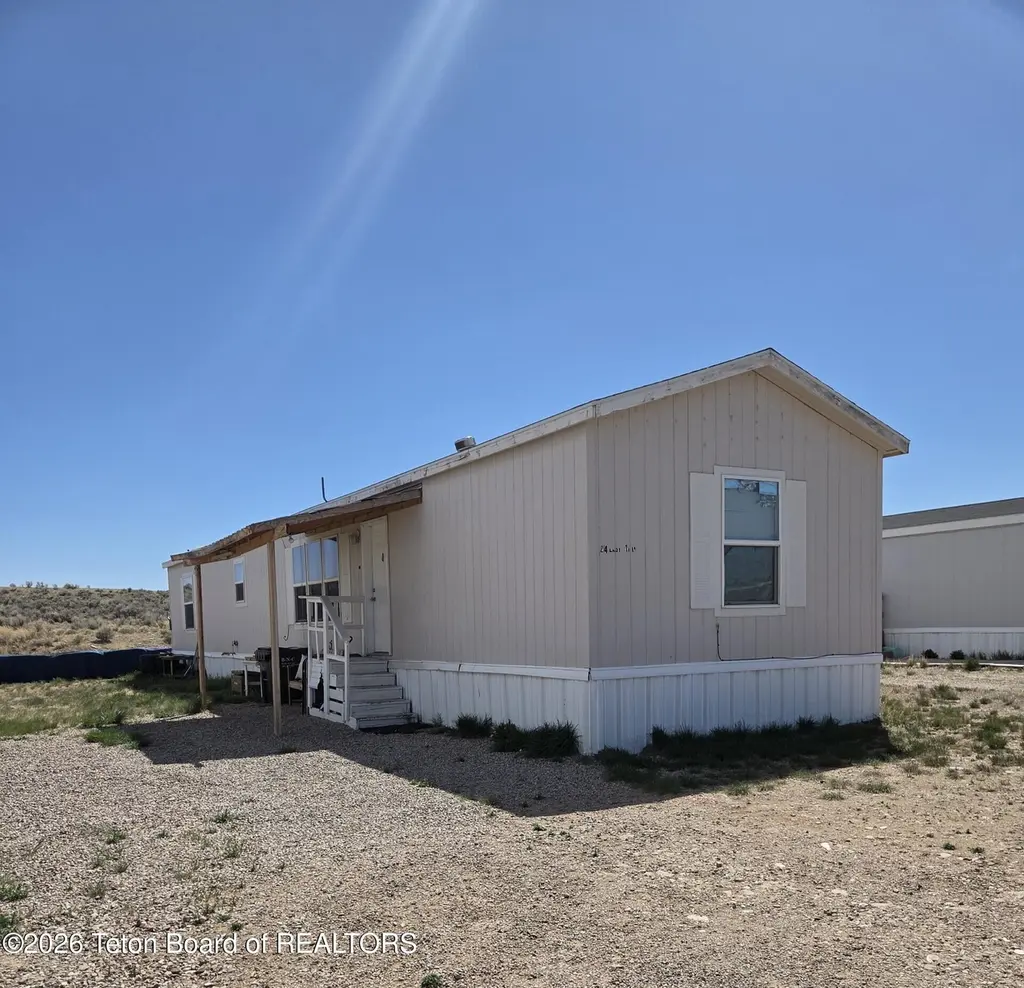
24 Eleventh Street St · Marbleton, WY
Flood risk No data
- FEMA flood zone
- —
- Chance of flooding over 30 yrs
- —
- Est. flood insurance / yr
- —
Fire risk No data
- Est. fire insurance / yr
- —
Heat risk No data
- Hot days now (above threshold)
- —
- Hot days in 30 yrs
- —
Wind risk No data
- Chance of severe wind over 30 yrs
- —
Air-quality risk No data
- Unhealthy air days now
- —
- Unhealthy air days in 30 yrs
- —
Risk factors via First Street. Map © Google.
Why this score? — see what drove the B+ grade
The composite is a weighted blend of 9 inputs, each scored 0–100. Each bar is that input's sub-score; the figure is the points it added to the 100-point composite (weight × sub-score).
- Cash flow +30.0/30.0
- 1% rule +10.0/10.0
- DSCR +10.0/10.0
- ARV discount +7.5/15.0
- Appreciation +6.3/10.0
- Schools +4.5/10.0
- Livability +3.7/5.0
- Rent growth +2.5/5.0
- Condition / age +2.2/5.0
$40,000
🖨 Deal sheet 📄 Offer letter ✓ Due diligence
Key facts
- Built 2006
- Listed 31 days
Property features AI
Exterior
- Parking: Gravel parking
- Utilities: Public water; Public sewer
- Home design: Manufactured home; Residential property; Located in a mobile home park
- Construction: Composition/shingle roof
- Exterior features: Porch; Satellite dish
Interior
- Bathrooms: 2 full bathrooms
- Heating & cooling: Forced air heating; No cooling
- Interior features: Unfurnished; No basement
Neighborhood map
What this means for you Summary
Snapshot
- This is a 2-bed/2.0-bath manufactured listed at $40k. Condition is rated fair.
Deal economics
- At list price, monthly cash flow is $443 ($5k/yr) — positive.
- The deal already cash-flows at list — no discount required.
- Meets the 1% rule at list price ($911 rent vs $40k).
- Recommended offer: $39k (3.0% below list) — sets the bar for market timing.
Location & tenants
- Location reads 74/100 on livability (#17 in WY, #4,584 nationally) — a middle-class / working-renter tenant base. Strengths: crime A+, cost of living A+, housing A+; Watch: schools F, amenities F, commute F.
- Sublette County School District #9 (rural): math 50% / reading 51% proficiency, ranked #22 of 41 in WY (top 54%) — acceptable for families but not a draw, mixed tenant base, ~2y average lease; only 20% free/reduced lunch — higher-income household profile.
- Market conditions: 31 active listings in the ZIP; 97 units permitted in Sublette County in 2024 (0 in 5+ unit buildings).
Forward outlook
- In year one you build about $1k of equity ($277 loan paydown + $1k appreciation (2.6% local appreciation)).
- Sublette County population projected at -20% by 2050 — secular population decline; favor cash flow + early exit over multi-decade hold.
- At projected returns (2.6% appreciation + 3.0% rent growth), your $11k cash investment doubles in ~2 years — after that, you're playing with house money.
Negotiation context
- It's been on market 31 days — a 3% lower offer ($39k) is reasonable based on typical stale-listing flexibility.
Questions for the listing agent
- It's been on market 31 days. Have you received any prior offers? Is the seller open to a 3% concession, seller financing, or rate buy-down credit?
- Have any recent inspections been done? Can we get a copy of the seller's disclosures and any deferred-maintenance estimates?
- Is there a deadline driving the sale (1031 exchange, divorce, estate, relocation)? That informs how much negotiation room exists.
- Schools are F-rated, which usually means shorter tenancies and higher turnover. Who's the typical renter profile here, and what's been the actual vacancy rate?
- What's the average days-on-market for RENTAL listings here right now (not sales)? A rising rental-DOM trend means longer vacancies and softer asking-rent achievability than the comps imply.
- What's the recent tenant-quality profile in this submarket — average credit score on applications, eviction rate, late-payment / NSF rate, and stable-employment percentage? A property-management company in the area should have these aggregated.
- How much new for-sale + rental construction is in the pipeline within 1–3 miles? Heavy new supply typically softens prices + rents 12–24 months out; constrained supply supports both.
Investment metrics
- 1% rule
- 2.28% ✓
- Cap rate
- 19.59%
- Cash-on-cash
- 47.47%
- DSCR
- 3.11
- GRM
- 3.7
CMA / ARV
- ARV (on-the-fly)
- $151,470
- Comps found
- 2
Show comp detail 2 sales within ~0.75 mi
| Address | Dist | Beds/Ba | Sqft | Sold | Price | $/sf | Match |
|---|---|---|---|---|---|---|---|
| 527 E Sixth St | 0.31mi | 3/1.0 (+1) | 918 (-7%) | 8mo | $15,000 | $16 | 57 |
| 404 E Fifth St | 0.49mi | 3/1.0 (+1) | 924 (-7%) | 24mo | $141,500 | $153 | 37 |
Match score weights: distance 35% · size 25% · config 20% · recency 20%. Top-matched comps best support the ARV.
Projected returns pro-forma
2.57% appreciation · 3.0% rent growth · sell at horizon
- IRR
- 52.2%
- Equity multiple
- 3.87×
- Total profit
- $32,150
- Equity at exit
- $17,026
- IRR
- 52.2%
- Equity multiple
- 7.79×
- Total profit
- $76,068
- Equity at exit
- $25,516
Cash invested: $11,200 (down + closing). Projections, not guarantees.
Landlord ↔ Tenant lean methodology
- Overall (STATE)
- 90 Strongly Landlord-Friendly
- State Wyoming
- 90 Strongly Landlord-Friendly · R+25
- County
- — inherits STATE
- City
- — inherits STATE
ZIP-level market 83113
- Home prices YoY
- 0.9%
- Active inventory
- 31
- Price-to-rent
- 3.7×
Monthly cashflow live
- Estimated rent
- $911 medium interval (Pro) →
- Mortgage (P&I)
- −$210
- Tax est. 1.5%
- −$50 /mo · $600/yr
- Insurance
- −$17
- HOA
- −$0
- Vacancy / Maint / Mgmt
- −$191
- Net cashflow
- $443
Break-even live
UW: 25.0% down · 7.5% · 30yr · 1.5% tax · 5.0% vac · 8.0% maint · 8.0% mgmt
Financing live
Cash to close
- Down payment
- $10,000
- Closing costs
- $1,200
- Reserves months
- —
- Total cash needed
- —
Loan-product check · same deal, 3 products live
Conventional
25% down · 7.5% · 30yr
- Down + closing
- —
- Monthly P&I
- —
- Monthly cashflow
- —
- DSCR
- —
- Eligible?
- —
Personal DTI + credit; lowest rate.
DSCR
20% down · 8.5% · 30yr
- Down + closing
- —
- Monthly P&I
- —
- Monthly cashflow
- —
- DSCR
- —
- Eligible?
- —
No personal income docs; deal must DSCR.
Hard money
10% down · 12.0% · 12mo
- Down + closing
- —
- Monthly P&I
- —
- Monthly cashflow
- —
- DSCR
- —
- Eligible?
- —
Short-term bridge; refi at stabilization.
Listing history 17 events
-
2026-06-18days on market $40,000 Active 31 DOM
-
2026-06-17days on market $40,000 Active 30 DOM
-
2026-06-16days on market $40,000 Active 29 DOM
-
2026-06-15days on market $40,000 Active 28 DOM
-
2026-06-15days on market $40,000 Active 27 DOM
-
2026-06-13days on market $40,000 Active 26 DOM
-
2026-06-12days on market $40,000 Active 25 DOM
-
2026-06-09days on market $40,000 Active 22 DOM
-
2026-06-08days on market $40,000 Active 21 DOM
-
2026-06-08days on market $40,000 Active 20 DOM
-
2026-06-05days on market $40,000 Active 18 DOM
-
2026-06-04days on market $40,000 Active 17 DOM
-
2026-06-03days on market $40,000 Active 16 DOM
-
2026-06-02days on market $40,000 Active 15 DOM
-
2026-06-01days on market $40,000 Active 14 DOM
-
2026-05-31days on market $40,000 Active 13 DOM
-
2026-05-16$40,000 Active
ⓘ Source: listings_history table (triggers on properties + properties_extension) + one-shot
backfill from property_details.listing_events for pre-trigger history.
Nearby sold comps map
Loading sold comps map…
Walkable amenities ~0.75 mi
Loading nearby amenities…
Taxation est. · year 1
- Rental income
- $10,929
- − Mortgage interest
- −$2,241
- − Property taxes
- −$600
- − Insurance
- −$200
- − Repairs & maintenance
- −$874
- − Management
- −$874
- − Depreciation
- −$1,164
- Taxable income
- $4,976
- Est. tax owed @ 24.0%
- −$1,194
- After-tax cash flow
- $4,123/yr
For passive investors: Depreciation is non-cash, so a rental often shows a tax loss while cash-flowing — sheltering income. Rental losses are passive: they offset passive income freely, and up to $25,000/yr can offset ordinary (W-2) income if you actively participate and your MAGI is under $100k (phasing out to $0 by $150k); unused losses carry forward. On sale, claimed depreciation is recaptured at up to 25%, and gains may owe capital-gains tax (a 1031 exchange can defer both). Figures are a year-1 estimate at your 24.0% rate — not tax advice; consult a CPA.
Condition & rehab AI · 13 photos
The property is in fair condition with cosmetic updates needed to enhance its curb appeal and interior aesthetics.
Repairs flagged
- Minor Exterior siding — Weathered appearance
- Minor Roof — May have minor wear
Value-add opportunities
- Both Paint interior walls — Enhances curb appeal and interior aesthetics
- Both Replace carpet — Improves comfort and reduces maintenance costs
- Both Landscaping — Enhances curb appeal and adds value
Renovation cost estimate screening
| Repair item | Severity | Est. cost |
|---|---|---|
| Exterior siding · Weathered appearance | Minor | $500–3,000 |
| Roof · May have minor wear | Minor | $500–3,000 |
| Total estimated repair cost · 2 items | $1,000–6,000 |
Value-add ROI direction
- Both Paint interior walls — Enhances curb appeal and interior aesthetics ↑
- Both Replace carpet — Improves comfort and reduces maintenance costs ↑
- Both Landscaping — Enhances curb appeal and adds value ↑
ⓘ Cost ranges are severity-bucket heuristics (US national rule-of-thumb). Get contractor quotes + a written scope before underwriting a rehab budget.
Schools (NCES district)
- District
- Sublette County School District #9
- NCES district ID
- 5601260
- Math proficiency
- 50% ▼ -9.00%
- Reading proficiency
- 51% ▼ -4.00%
- Median HH income
- $66,891
- Composite
- 44.82/100
- National rank
- #2738
- State rank
- #22 of 41 in WY
Livability — Marbleton
- Score
- 74/100
- State rank
- #17
- US rank
- #4584
Category grades
Schools grade is shown separately in the Schools card above.
Census & demographics
- Census place
- Marbleton, WY
- Population (ZIP)
- 2,693
Population outlook (Sublette County) Hauer SSP2
- Today (2025)
- 9,166 people
- By 2030
- 8,722 · -4.8%
- By 2040
- 7,886 · -14.0%
- By 2050
- 7,292 · -20.4%
- By 2075
- 6,700 · -26.9%
- By 2100
- 6,934 · -24.4%
Race, ethnicity, and origin ACS 2023
- Neighborhood character
- Predominantly White (88%)
- Race & ethnicity
- White 88% Hispanic / Latino 10% Two or more races 4%
- Hispanic origin (detail)
- Mexican 8%
- Common ancestry
- Italian 5% Portuguese 5% Scottish 3%
- Foreign-born
- 6% · Canada
- Languages at home
- 92% English-only · Spanish 7% Other Asian/Pacific 1%
Political lean MEDSL · Sublette
- 2024 margin
- Solid R (+61.1) · D 18.8% · R 79.9% · Other 1.2%
- 2008→2024 swing
- -6.5pp toward R · 2008: -54.6pp · 2024: -61.1pp
- All cycles
- 2024: R+61.1 2020: R+61.9 2016: R+64.3 2012: R+62.4 2008: R+54.6
Not yet ingested
- Civics
- —
Market trends
- HPI YoY
- ▲ 2.57%
- Current HPI
- 289.7
- Rent YoY
- —
- Metro
- —
- State GDP YoY
- —
- F500 in state
- 0
Price history
1 event — show timeline
- 2026-05-16 Listed $40,000 TBOR
Cash-flow waterfall
monthlySold comps — $/sqft
last 12 mo · ≤1 miLoading sold comps…