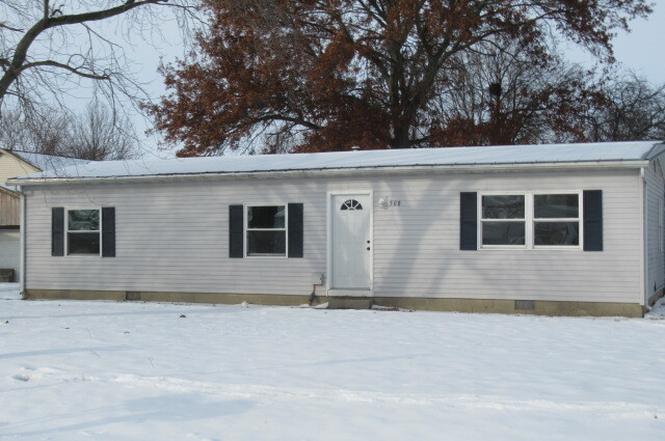
508 W Clark St · Thomasboro, IL
Flood risk 1/10 · Minimal
- FEMA flood zone
- X (unshaded)
- Chance of flooding over 30 yrs
- 0.0%
- Est. flood insurance / yr
- $507 – $1,088
Fire risk 1/10 · Minimal
- Est. fire insurance / yr
- $804 – $1,492
Heat risk 3/10 · Minor
- Hot days now (above 105°F)
- 7 days/yr
- Hot days in 30 yrs
- 18 days/yr
Wind risk 2/10 · Minimal
- Chance of severe wind over 30 yrs
- 1.0%
Air-quality risk 2/10 · Minimal
- Unhealthy air days now
- 1 days/yr
- Unhealthy air days in 30 yrs
- 2 days/yr
Risk factors via First Street. Map © Google.
Why this score? — see what drove the C- grade
The composite is a weighted blend of 9 inputs, each scored 0–100. Each bar is that input's sub-score; the figure is the points it added to the 100-point composite (weight × sub-score).
- Cash flow +16.5/30.0
- Appreciation +9.4/10.0
- ARV discount +7.5/15.0
- 1% rule +6.4/10.0
- DSCR +5.1/10.0
- Livability +3.4/5.0
- Rent growth +2.5/5.0
- Condition / age +2.5/5.0
- Schools +1.2/10.0
$79,450
🖨 Deal sheet 📄 Offer letter ✓ Due diligence
Listing remarks
Property was remodeled by prior owner. The L-shaped kitchen has oak cabinets and a stainless sink. Laminate flooring has been installed in the kitchen and dining room. New carpet was laid in the bedrooms and living room. Neutral colors were used when painting the rooms. Some windows were replaced at an earlier time. Unlock the front door and move right in!
Key facts
- Laminate flooring
- Oak cabinets
- New carpet
Tags
Neighborhood map
What this means for you Summary
Snapshot
- This is a 3-bed/1.0-bath other listed at $79k.
Deal economics
- At list price, monthly cash flow is $46 ($558/yr) — positive.
- The deal already cash-flows at list — no discount required.
- Meets the 1% rule at list price ($904 rent vs $79k).
- Recommended offer: $72k (9.0% below list) — sets the bar for market timing.
Location & tenants
- Location reads 67/100 on livability (#514 in IL) — a middle-class / working-renter tenant base. Strengths: crime A+, cost of living A+, housing A+; Watch: schools C-, employment D+, amenities F.
- Rantoul Township Hsd 193 (town): math 10% / reading 10% proficiency, ranked #824 of 919 in IL (top 90%) — low school quality limits family demand, transient renter base, plan for 1-2y turnover.
- Market conditions: 4 active listings in the ZIP; 573 units permitted in Champaign County in 2024 (359 in 5+ unit buildings).
Forward outlook
- In year one you build about $8k of equity ($550 loan paydown + $7k appreciation (8.9% local appreciation)).
- Champaign County population projected at +15% by 2050 — modest demand growth; plan on rents tracking national, not racing it.
- At projected returns (8.9% appreciation + 3.0% rent growth), your $22k cash investment doubles in ~3 years — after that, you're playing with house money.
- By year 5, paydown + projected appreciation supports a ~$35k cash-out refi (75% LTV) — recoverable capital for the next deal without selling this one.
Negotiation context
- It's been on market 104 days — a 9% lower offer ($72k) is reasonable based on typical stale-listing flexibility.
- 10 sale attempts since 3y ago; this cycle's ask has dropped $16k (16%) from the opening price — seller is motivated, your offer sets the floor, not the list.
Risks & watch-outs
- Watch-outs: property tax is 3.3% of price.
Questions for the listing agent
- It's been on market 104 days. Have you received any prior offers? Is the seller open to a 9% concession, seller financing, or rate buy-down credit?
- Property tax is high relative to price — has the assessment been appealed recently, and will the sale trigger a re-assessment?
- Why hasn't it sold? Are there any deal-killer items the seller is aware of (foundation, flood, title, zoning, code violations)?
- Is there a deadline driving the sale (1031 exchange, divorce, estate, relocation)? That informs how much negotiation room exists.
- What's the average days-on-market for RENTAL listings here right now (not sales)? A rising rental-DOM trend means longer vacancies and softer asking-rent achievability than the comps imply.
- What's the recent tenant-quality profile in this submarket — average credit score on applications, eviction rate, late-payment / NSF rate, and stable-employment percentage? A property-management company in the area should have these aggregated.
- How much new for-sale + rental construction is in the pipeline within 1–3 miles? Heavy new supply typically softens prices + rents 12–24 months out; constrained supply supports both.
Investment metrics
- 1% rule
- 1.14% ✓
- Cap rate
- 7.00%
- Cash-on-cash
- 2.51%
- DSCR
- 1.11
- GRM
- 7.3
CMA / ARV
No comps found within radius.
Projected returns pro-forma
8.88% appreciation · 3.0% rent growth · sell at horizon
- IRR
- 23.8%
- Equity multiple
- 2.81×
- Total profit
- $40,307
- Equity at exit
- $65,180
- IRR
- 21.4%
- Equity multiple
- 6.19×
- Total profit
- $115,365
- Equity at exit
- $134,270
Cash invested: $22,246 (down + closing). Projections, not guarantees.
Landlord ↔ Tenant lean methodology
- Overall (STATE)
- 43 Moderately Tenant-Leaning
- State Illinois
- 43 Moderately Tenant-Leaning · D+7
- County
- — inherits STATE
- City
- — inherits STATE
ZIP-level market 61878
- Home prices YoY
- 5.0%
- Active inventory
- 4
- Price-to-rent
- 7.3×
Monthly cashflow live
- Estimated rent
- $904 medium interval (Pro) →
- Mortgage (P&I)
- −$417
- Tax from tax record
- −$218 /mo · $2,618/yr
- Insurance
- −$33
- HOA
- −$0
- Vacancy / Maint / Mgmt
- −$190
- Net cashflow
- $46
Break-even live
UW: 25.0% down · 7.5% · 30yr · 1.5% tax · 5.0% vac · 8.0% maint · 8.0% mgmt
Financing live
Cash to close
- Down payment
- $19,862
- Closing costs
- $2,384
- Reserves months
- —
- Total cash needed
- —
Loan-product check · same deal, 3 products live
Conventional
25% down · 7.5% · 30yr
- Down + closing
- —
- Monthly P&I
- —
- Monthly cashflow
- —
- DSCR
- —
- Eligible?
- —
Personal DTI + credit; lowest rate.
DSCR
20% down · 8.5% · 30yr
- Down + closing
- —
- Monthly P&I
- —
- Monthly cashflow
- —
- DSCR
- —
- Eligible?
- —
No personal income docs; deal must DSCR.
Hard money
10% down · 12.0% · 12mo
- Down + closing
- —
- Monthly P&I
- —
- Monthly cashflow
- —
- DSCR
- —
- Eligible?
- —
Short-term bridge; refi at stabilization.
Listing history 32 events
-
2026-04-19status Pending
-
2026-02-07price $79,450
-
2026-01-05$95,000 Active
-
2025-12-08historical
-
2025-09-24price
-
2025-08-01price
-
2025-07-27price
-
2025-07-14price
-
2025-07-10Active
-
2025-06-14price
-
2025-06-14historical
-
2025-05-31price
-
2025-05-08price
-
2025-05-08status Active
-
2025-05-03historical
-
2025-05-03status Temporarily No Showings
-
2025-04-22historical
-
2025-04-22status Temporarily No Showings
-
2024-10-23historical $1,650
-
2024-10-18price $1,650
-
2024-10-15$1,595
-
2024-09-30historical
-
2024-09-12price
-
2024-06-23Active
-
2024-03-22soldstatus $106,000
-
2024-03-21soldstatus $106,000 Closed
-
2024-02-05status Pending
-
2024-02-01$97,900 Active
-
2023-12-15historical
-
2023-10-23status Active
-
2023-10-10historical Contingent - No Showings
-
2023-09-29Active
ⓘ Source: listings_history table (triggers on properties + properties_extension) + one-shot
backfill from property_details.listing_events for pre-trigger history.
Tax reassessment forecast IL · Partial reset (capped growth)
- Current annual tax
- $2,618 · $218/mo
- Projected year-2 tax
- $2,618 · $218/mo
- Expected delta
- $0/yr ($0/mo · 0.0%)
ⓘ Screening estimate from a state-policy table — verify with the county assessor before closing.
Climate risk First Street
- Flood 1/10 Low FEMA zone X (unshaded) · 0% chance over 30 yrs
- Wildfire 1/10 Low
- Heat 3/10 Moderate 7 d/yr ≥105°F today · 18 d/yr by 30 yrs out
- Wind 2/10 Low 100% chance of damaging wind over 30 yrs
- Air quality 2/10 Low 1 unhealthy d/yr today · 2 by 30 yrs out
Nearby sold comps map
Loading sold comps map…
Walkable amenities ~0.75 mi
Loading nearby amenities…
Taxation est. · year 1
- Rental income
- $10,852
- − Mortgage interest
- −$4,450
- − Property taxes
- −$2,618
- − Insurance
- −$397
- − Repairs & maintenance
- −$868
- − Management
- −$868
- − Depreciation
- −$2,311
- Taxable loss
- −$661
- Est. tax savings @ 24.0%
- +$159
- After-tax cash flow
- $717/yr
For passive investors: Depreciation is non-cash, so a rental often shows a tax loss while cash-flowing — sheltering income. Rental losses are passive: they offset passive income freely, and up to $25,000/yr can offset ordinary (W-2) income if you actively participate and your MAGI is under $100k (phasing out to $0 by $150k); unused losses carry forward. On sale, claimed depreciation is recaptured at up to 25%, and gains may owe capital-gains tax (a 1031 exchange can defer both). Figures are a year-1 estimate at your 24.0% rate — not tax advice; consult a CPA.
Schools (NCES district)
- District
- Rantoul Township Hsd 193
- NCES district ID
- 1733240
- Math proficiency
- 10% ▼ -5.00%
- Reading proficiency
- 10% ▬ 0.00%
- Median HH income
- $38,128
- Composite
- 12.14/100
- National rank
- #14582
- State rank
- #824 of 919 in IL
Livability — Thomasboro
- Score
- 67/100
- State rank
- #514
- US rank
- #10638
Category grades
Schools grade is shown separately in the Schools card above.
Census & demographics
- Census place
- Thomasboro, IL
- Population (ZIP)
- 1,179
Population outlook (Champaign County) Hauer SSP2
- Today (2025)
- 223,848 people
- By 2030
- 231,416 · +3.4%
- By 2040
- 244,321 · +9.1%
- By 2050
- 256,432 · +14.6%
- By 2075
- 285,823 · +27.7%
- By 2100
- 296,406 · +32.4%
Race, ethnicity, and origin ACS 2023
- Neighborhood character
- Predominantly White (88%)
- Race & ethnicity
- White 88% Hispanic / Latino 6% Two or more races 5% Black 2%
- Hispanic origin (detail)
- Mexican 6%
- Common ancestry
- Romanian 3% Portuguese 1% Slovak 1%
- Foreign-born
- 7% · Canada
- Languages at home
- 95% English-only · Spanish 3% Other Indo-European 1% Arabic 1%
Political lean MEDSL · Champaign
- 2024 margin
- Strong D (+24.1) · D 61.3% · R 37.2% · Other 1.5%
- 2008→2024 swing
- +6.6pp toward D · 2008: 17.5pp · 2024: 24.1pp
- All cycles
- 2024: D+24.1 2020: D+22.8 2016: D+18.4 2012: D+6.8 2008: D+17.5
Not yet ingested
- Civics
- —
Market trends
- HPI YoY
- ▲ 8.88%
- Current HPI
- 186.6187
- Rent YoY
- —
- Metro
- —
- State GDP YoY
- ▲ 1.59%
- F500 in state
- 60
Industry mix (Fortune 500 HQ in IL)
| Industry | F500 HQs | Revenue |
|---|---|---|
| Insurance | 4 | $201B |
|
||
| Consumer Goods | 4 | $87B |
|
||
| Industrial Machinery | 3 | $64B |
|
||
| Healthcare | 2 | $55B |
|
||
| Retail / Pharmacy | 1 | $148B |
|
||
| Agriculture / Food | 1 | $86B |
|
||
Price history
-18.8% since first listed32 events — show timeline
- 2026-04-19 Pending — MRED as Distributed by MLS Grid
- 2026-02-07 Price Changed $79,450 MRED as Distributed by MLS Grid
- 2026-01-05 Listed $95,000 MRED as Distributed by MLS Grid
- 2025-12-08 Listing Removed — MRED as Distributed by MLS Grid
- 2025-09-24 Price Changed — MRED as Distributed by MLS Grid
- 2025-08-01 Price Changed — MRED as Distributed by MLS Grid
- 2025-07-27 Price Changed — MRED as Distributed by MLS Grid
- 2025-07-14 Price Changed — MRED as Distributed by MLS Grid
- 2025-07-10 Listed — MRED as Distributed by MLS Grid
- 2025-06-14 Price Changed — MRED as Distributed by MLS Grid
- 2025-06-14 Listing Removed — MRED as Distributed by MLS Grid
- 2025-05-31 Price Changed — MRED as Distributed by MLS Grid
- 2025-05-08 Price Changed — MRED as Distributed by MLS Grid
- 2025-05-08 Relisted — MRED as Distributed by MLS Grid
- 2025-05-03 Listing Removed — MRED as Distributed by MLS Grid
- 2025-05-03 Relisted — MRED as Distributed by MLS Grid
- 2025-04-22 Listing Removed — MRED as Distributed by MLS Grid
- 2025-04-22 Relisted — MRED as Distributed by MLS Grid
- 2024-10-23 Rental Removed $1,650 TURBOTENANT
- 2024-10-18 Price Changed $1,650 TURBOTENANT
- 2024-10-15 Listed for Rent $1,595 TURBOTENANT
- 2024-09-30 Listing Removed — MRED as Distributed by MLS Grid
- 2024-09-12 Price Changed — MRED as Distributed by MLS Grid
- 2024-06-23 Listed — MRED as Distributed by MLS Grid
- 2024-03-22 Sold (Public Records) $106,000 Public Records
- 2024-03-21 Sold (MLS) $106,000 MRED as Distributed by MLS Grid
- 2024-02-05 Pending — MRED as Distributed by MLS Grid
- 2024-02-01 Listed $97,900 MRED as Distributed by MLS Grid
- 2023-12-15 Listing Removed — MRED as Distributed by MLS Grid
- 2023-10-23 Relisted — MRED as Distributed by MLS Grid
- 2023-10-10 Contingent — MRED as Distributed by MLS Grid
- 2023-09-29 Listed — MRED as Distributed by MLS Grid
Property tax history
+2.3%/yrLatest (2024): $2,618 · +6.1% YoY. Source: county tax records.
Cash-flow waterfall
monthlySold comps — $/sqft
last 12 mo · ≤1 miLoading sold comps…