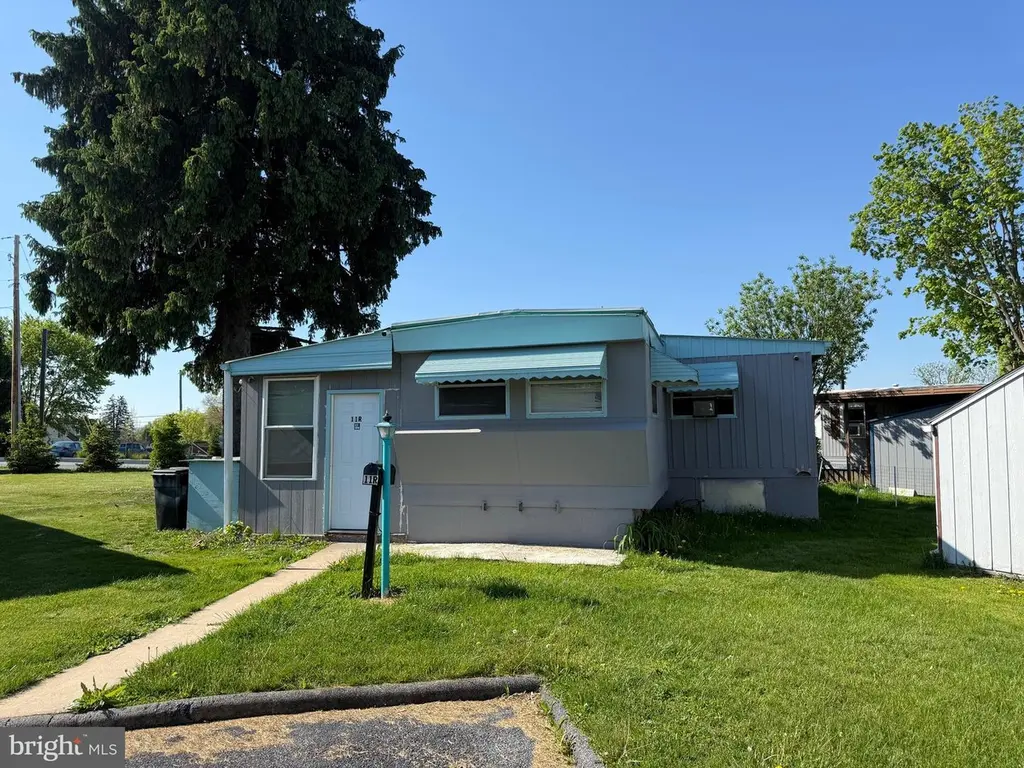
11-R David Dr · Lebanon, PA
Flood risk 8/10 · Major
- FEMA flood zone
- X (unshaded)
- Chance of flooding over 30 yrs
- 0.99%
- Est. flood insurance / yr
- $507 – $1,088
Fire risk 1/10 · Minimal
- Est. fire insurance / yr
- $511 – $949
Heat risk 5/10 · Moderate
- Hot days now (above 99°F)
- 7 days/yr
- Hot days in 30 yrs
- 15 days/yr
Wind risk 4/10 · Minor
- Chance of severe wind over 30 yrs
- 10.0%
Air-quality risk 3/10 · Minor
- Unhealthy air days now
- 2 days/yr
- Unhealthy air days in 30 yrs
- 3 days/yr
Risk factors via First Street. Map © Google.
Why this score? — see what drove the C+ grade
The composite is a weighted blend of 9 inputs, each scored 0–100. Each bar is that input's sub-score; the figure is the points it added to the 100-point composite (weight × sub-score).
- Cash flow +30.0/30.0
- 1% rule +10.0/10.0
- DSCR +10.0/10.0
- Rent growth +4.3/5.0
- Schools +4.1/10.0
- Livability +3.8/5.0
- Condition / age +2.5/5.0
- ARV discount +0.0/15.0
- Appreciation +0.0/10.0
$39,999
🖨 Deal sheet (PDF) 📄 Offer letter ✓ Due diligence
Listing remarks MLS
Clean 2018 mobile home located in Lincoln Village Mobile Home Park. Rent $310 per month unless you have a pet - then the rent is $335 ($25.00 for the pet monthly). Public water and sewer. All buyers need to be park approved.
Key facts
- Built 1966
- Listed 43 days
Property features AI
Finance
- Other: Property condition noted as below average
- Financial info: Ownership interest: ground rent; Improvement assessed value listed (agent-estimated data)
- HOA & community: Located in Lincoln Village Mobile Home Park; Ground rent of $350 per month
Exterior
- Parking: Paved parking; On-street parking
- Utilities: Public water; Public sewer; 100 amp electric service; Electric hot water
- Home design: Single-wide mobile home (pre-1976); Frame construction
- Construction: Frame construction; Mobile home structure
- Exterior features: Not in a federal flood zone; Ground rent exists (monthly payment)
Interior
- Bedrooms: 3 bedrooms on the main level
- Flooring: Carpet; Hardwood; Luxury vinyl plank
- Bathrooms: 1 full bathroom on the main level
- Heating & cooling: Forced air heating (electric); Window air conditioning units (electric)
- Interior features: Paneled walls and drywall; Carpet, hardwood, and luxury vinyl plank flooring
- Laundry & utility: Washer and dryer in unit
Neighborhood map
What this means for you Summary
Snapshot
- This is a 3-bed/2.0-bath manufactured listed at $40k.
Deal economics
- At list price, monthly cash flow is $797 ($10k/yr) — positive.
- The deal already cash-flows at list — no discount required.
- Meets the 1% rule at list price ($1k rent vs $40k).
- Recommended offer: $39k (3.0% below list) — sets the bar for market timing.
- Cap rate 32.2% vs local median 1.9% in Lebanon — top-decile yield for the area; either an underpriced asset or a hidden risk that comps aren't pricing in. Stress-test before assuming the spread holds.
Location & tenants
- Location reads 75/100 on livability (#453 in PA, #4,145 nationally) — a middle-class / working-renter tenant base. Strengths: cost of living A+, housing A+, health & safety A+; Watch: amenities C-, schools D+, commute F.
- Cornwall-Lebanon SD (suburban): math 37% / reading 56% proficiency, ranked #219 of 539 in PA (top 41%) — families likely to look elsewhere, expect single-tenant / working-renter base with shorter leases.
- Market conditions: Rents rising fast (+7.4%/yr); 121 active listings in the ZIP; 315 units permitted in Lebanon County in 2024 (36 in 5+ unit buildings).
Forward outlook
- Local home prices are declining (-3.0%/yr); year-one equity from $276 of loan paydown is wiped out by about $1k of value loss. Plan a longer hold.
- Lebanon County population projected at +10% by 2050 — modest demand growth; plan on rents tracking national, not racing it.
- At projected returns (-3.0% appreciation + 7.4% rent growth), your $11k cash investment doubles in ~2 years — after that, you're playing with house money.
Negotiation context
- It's been on market 44 days — a 3% lower offer ($39k) is reasonable based on typical stale-listing flexibility.
- 2 sale attempts since 3y ago; this cycle's ask has dropped $5k (11%) from the opening price — seller is motivated, your offer sets the floor, not the list.
Risks & watch-outs
- Watch-outs: flood insurance adds $66/mo.
- Climate carrying-cost: severe flood risk; extreme-heat days projected 7→15/yr by 2055 (HVAC capex compounding) — expect insurance premiums to compound above CPI over the hold.
Questions for the listing agent
- It's been on market 44 days. Have you received any prior offers? Is the seller open to a 3% concession, seller financing, or rate buy-down credit?
- Built in 1966 — when were the roof, HVAC, electrical panel, plumbing, and water heater last replaced?
- What's the actual annual flood-insurance premium (NFIP or private), and is the property in a SFHA with mandatory coverage?
- Is there a deadline driving the sale (1031 exchange, divorce, estate, relocation)? That informs how much negotiation room exists.
- Schools are D-rated, which usually means shorter tenancies and higher turnover. Who's the typical renter profile here, and what's been the actual vacancy rate?
- What's the average days-on-market for RENTAL listings here right now (not sales)? A rising rental-DOM trend means longer vacancies and softer asking-rent achievability than the comps imply.
- What's the recent tenant-quality profile in this submarket — average credit score on applications, eviction rate, late-payment / NSF rate, and stable-employment percentage? A property-management company in the area should have these aggregated.
- How much new for-sale + rental construction is in the pipeline within 1–3 miles? Heavy new supply typically softens prices + rents 12–24 months out; constrained supply supports both.
Investment metrics
- 1% rule
- 3.64% ✓
- Cap rate
- 32.19%
- Cash-on-cash
- 92.48%
- DSCR
- 5.11
- GRM
- 2.3
CMA / ARV
- ARV (on-the-fly)
- $30,720
- Comps found
- 1
Show comp detail 1 sale within ~0.75 mi
| Address | Dist | Beds/Ba | Sqft | Sold | Price | $/sf | Match |
|---|---|---|---|---|---|---|---|
| 15 David Dr | 0.02mi | 2/1.0 (-1) | 624 (-2%) | 24mo | $30,000 | $48 | 66 |
Match score weights: distance 35% · size 25% · config 20% · recency 20%. Top-matched comps best support the ARV.
Projected returns pro-forma
-3.0% appreciation · 7.36% rent growth · sell at horizon
- IRR
- 91.1%
- Equity multiple
- 5.55×
- Total profit
- $51,005
- Equity at exit
- $5,964
- IRR
- 95.0%
- Equity multiple
- 13.50×
- Total profit
- $140,005
- Equity at exit
- $3,458
Cash invested: $11,200 (down + closing). Projections, not guarantees.
Landlord ↔ Tenant lean methodology
- Overall (STATE)
- 62 Landlord-Friendly
- State Pennsylvania
- 62 Landlord-Friendly · EVEN
- County
- — inherits STATE
- City
- — inherits STATE
ZIP-level market 17046
- Rents YoY
- 7.4%
- Active inventory
- 121
- Price-to-rent
- 2.3×
Monthly cashflow live
- Estimated rent
- $1,457 medium interval (Pro) →
- Mortgage (P&I)
- −$210
- Tax from tax record
- −$62 /mo · $741/yr
- Insurance
- −$17
- Flood insurance flood zone
- −$66 /mo · $798/yr
- HOA
- −$0
- Vacancy / Maint / Mgmt
- −$306
- Net cashflow
- $797
Break-even live
Sensitivity live
| Price | -10% $819 | -5% $808 | +0% $797 | +5% $785 | +10% $774 |
|---|---|---|---|---|---|
| Rent | -10% $682 | -5% $739 | +0% $797 | +5% $854 | +10% $912 |
| Rate | -1.0pp $817 | -0.5pp $807 | base $797 | +0.5pp $786 | +1.0pp $776 |
UW: 25.0% down · 7.5% · 30yr · 1.5% tax · 5.0% vac · 8.0% maint · 8.0% mgmt
Financing live
Cash to close
- Down payment
- $10,000
- Closing costs
- $1,200
- Reserves months
- —
- Total cash needed
- —
Loan-product check · same deal, 3 products live
Conventional
25% down · 7.5% · 30yr
- Down + closing
- —
- Monthly P&I
- —
- Monthly cashflow
- —
- DSCR
- —
- Eligible?
- —
Personal DTI + credit; lowest rate.
DSCR
20% down · 8.5% · 30yr
- Down + closing
- —
- Monthly P&I
- —
- Monthly cashflow
- —
- DSCR
- —
- Eligible?
- —
No personal income docs; deal must DSCR.
Hard money
10% down · 12.0% · 12mo
- Down + closing
- —
- Monthly P&I
- —
- Monthly cashflow
- —
- DSCR
- —
- Eligible?
- —
Short-term bridge; refi at stabilization.
Listing history 21 events
-
2026-06-19days on market $39,999 Active 44 DOM
-
2026-06-18days on market $39,999 Active 43 DOM
-
2026-06-17days on market $39,999 Active 42 DOM
-
2026-06-16days on market $39,999 Active 41 DOM
-
2026-06-15days on market $39,999 Active 40 DOM
-
2026-06-14days on market $39,999 Active 38 DOM
-
2026-06-13days on market $39,999 Active 37 DOM
-
2026-06-10pricedays on market $39,999 Active 35 DOM
-
2026-06-09days on market $42,500 Active 34 DOM
-
2026-06-08days on market $42,500 Active 33 DOM
-
2026-06-07days on market $42,500 Active 32 DOM
-
2026-06-03pricedays on market $42,500 Active 28 DOM
-
2026-06-02days on market $45,000 Active 27 DOM
-
2026-06-01days on market $45,000 Active 26 DOM
-
2026-05-31days on market $45,000 Active 25 DOM
-
2026-05-30days on market $45,000 Active 24 DOM
-
2026-05-06$45,000 Active 782-char remark
-
2023-06-09soldstatus $49,900 Closed 225-char remark
Show marketing remark (225 chars)
Clean 2018 mobile home located in Lincoln Village Mobile Home Park. Rent $310 per month unless you have a pet - then the rent is $335 ($25.00 for the pet monthly). Public water and sewer. All buyers need to be park approved.
-
2023-05-27status Pending 225-char remark
Show marketing remark (225 chars)
Clean 2018 mobile home located in Lincoln Village Mobile Home Park. Rent $310 per month unless you have a pet - then the rent is $335 ($25.00 for the pet monthly). Public water and sewer. All buyers need to be park approved.
-
2023-05-01$49,900 Active 225-char remark
Show marketing remark (225 chars)
Clean 2018 mobile home located in Lincoln Village Mobile Home Park. Rent $310 per month unless you have a pet - then the rent is $335 ($25.00 for the pet monthly). Public water and sewer. All buyers need to be park approved.
-
2023-04-28historical $49,900 225-char remark
Show marketing remark (225 chars)
Clean 2018 mobile home located in Lincoln Village Mobile Home Park. Rent $310 per month unless you have a pet - then the rent is $335 ($25.00 for the pet monthly). Public water and sewer. All buyers need to be park approved.
ⓘ Source: listings_history table (triggers on properties + properties_extension) + one-shot
backfill from property_details.listing_events for pre-trigger history.
Tax reassessment forecast PA · Partial reset (capped growth)
- Current annual tax
- $741 · $62/mo
- Projected year-2 tax
- $741 · $62/mo
- Expected delta
- $0/yr ($0/mo · 0.0%)
ⓘ Screening estimate from a state-policy table — verify with the county assessor before closing.
Climate risk First Street
- Flood 8/10 Severe FEMA zone X (unshaded) · 99% chance over 30 yrs
- Wildfire 1/10 Low
- Heat 5/10 Major 7 d/yr ≥99°F today · 15 d/yr by 30 yrs out
- Wind 4/10 Moderate 10% chance of damaging wind over 30 yrs
- Air quality 3/10 Moderate 2 unhealthy d/yr today · 3 by 30 yrs out
Nearby sold comps map
Loading sold comps map…
Walkable amenities ~0.75 mi
Loading nearby amenities…
Taxation est. · year 1
- Rental income
- $17,488
- − Mortgage interest
- −$2,241
- − Property taxes
- −$741
- − Insurance
- −$997
- − Repairs & maintenance
- −$1,399
- − Management
- −$1,399
- − Depreciation
- −$1,164
- Taxable income
- $9,548
- Est. tax owed @ 24.0%
- −$2,291
- After-tax cash flow
- $7,269/yr
For passive investors: Depreciation is non-cash, so a rental often shows a tax loss while cash-flowing — sheltering income. Rental losses are passive: they offset passive income freely, and up to $25,000/yr can offset ordinary (W-2) income if you actively participate and your MAGI is under $100k (phasing out to $0 by $150k); unused losses carry forward. On sale, claimed depreciation is recaptured at up to 25%, and gains may owe capital-gains tax (a 1031 exchange can defer both). Figures are a year-1 estimate at your 24.0% rate — not tax advice; consult a CPA.
Schools (NCES district)
- District
- Cornwall-Lebanon SD
- NCES district ID
- 4206840
- Math proficiency
- 37% ▼ -15.00%
- Reading proficiency
- 56% ▼ -15.00%
- Median HH income
- $62,483
- Composite
- 41.0/100
- National rank
- #3589
- State rank
- #219 of 539 in PA
Livability — Lebanon
- Score
- 75/100
- State rank
- #453
- US rank
- #4145
Category grades
Schools grade is shown separately in the Schools card above.
Census & demographics
- County
- Lebanon County · 95,836 people
- City population
- 71,996
- Metro
- Lebanon, PA
- Population (ZIP)
- 31,835
- Household income
- $62,221
- Rent vs Own
- Severe rent burden
- 905.0
Population outlook (Lebanon County) Hauer SSP2
- Today (2025)
- 144,806 people
- By 2030
- 147,534 · +1.9%
- By 2040
- 152,952 · +5.6%
- By 2050
- 159,406 · +10.1%
- By 2075
- 181,736 · +25.5%
- By 2100
- 198,402 · +37.0%
Race, ethnicity, and origin ACS 2023
- Neighborhood character
- Majority White (60%)
- Race & ethnicity
- White 60% Hispanic / Latino 34% Two or more races 12% Black 2% Asian 1%
- Hispanic origin (detail)
- Mexican 3% Puerto Rican 20% Dominican 9%
- Common ancestry
- Romanian 2% Polish 1% Lithuanian 1%
- Foreign-born
- 8% · Canada
- Languages at home
- 75% English-only · Spanish 23%
Political lean MEDSL · Lebanon
- 2024 margin
- Solid R (+32.0) · D 33.6% · R 65.5%
- 2008→2024 swing
- -13.1pp toward R · 2008: -18.9pp · 2024: -32.0pp
- All cycles
- 2024: R+32.0 2020: R+31.7 2016: R+35.5 2012: R+28.0 2008: R+18.9
Not yet ingested
- Civics
- —
Market trends
- HPI YoY
- ▼ -124.36%
- Current HPI
- 217.3106
- Rent YoY
- ▲ 7.36%
- Metro
- Lebanon, PA
- State GDP YoY
- ▲ 1.68%
- F500 in state
- 34
Industry mix (Fortune 500 HQ in PA)
| Industry | F500 HQs | Revenue |
|---|---|---|
| Healthcare | 2 | $309B |
|
||
| Insurance | 2 | $27B |
|
||
| Telecommunications / Media | 1 | $124B |
|
||
| Industrial Distribution | 1 | $22B |
|
||
| Financial Services | 1 | $20B |
|
||
| Chemicals / Materials | 1 | $18B |
|
||
Price history
-19.8% since first listed7 events — show timeline
- 2026-06-09 Price Changed $39,999 BRIGHT MLS
- 2026-06-03 Price Changed $42,500 BRIGHT MLS
- 2026-05-06 Listed $45,000 BRIGHT MLS
- 2023-06-09 Sold (MLS) $49,900 BRIGHT MLS
- 2023-05-27 Pending — BRIGHT MLS
- 2023-05-01 Listed $49,900 BRIGHT MLS
- 2023-04-28 Coming Soon $49,900 BRIGHT MLS
Property tax history
+3.7%/yrLatest (2026): $741 · +4.1% YoY. Source: county tax records.
Cash-flow waterfall
monthlySold comps — $/sqft
last 12 mo · ≤1 miLoading sold comps…