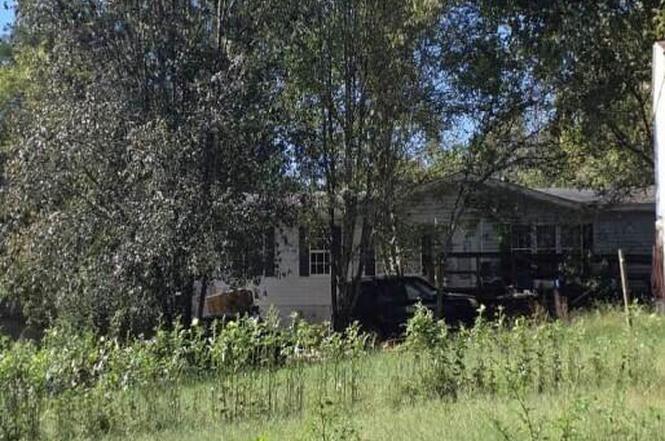
145 Old Sweetwater Rd · Sweetwater, TN
Flood risk 1/10 · Minimal
- FEMA flood zone
- X (unshaded)
- Chance of flooding over 30 yrs
- 0.0%
- Est. flood insurance / yr
- $473 – $860
Fire risk 5/10 · Moderate
- Est. fire insurance / yr
- $949 – $1,763
Heat risk 5/10 · Moderate
- Hot days now (above 103°F)
- 7 days/yr
- Hot days in 30 yrs
- 20 days/yr
Wind risk 2/10 · Minimal
- Chance of severe wind over 30 yrs
- 1.0%
Air-quality risk 3/10 · Minor
- Unhealthy air days now
- 2 days/yr
- Unhealthy air days in 30 yrs
- 2 days/yr
Risk factors via First Street. Map © Google.
Why this score? — see what drove the B- grade
The composite is a weighted blend of 9 inputs, each scored 0–100. Each bar is that input's sub-score; the figure is the points it added to the 100-point composite (weight × sub-score).
- Cash flow +30.0/30.0
- DSCR +10.0/10.0
- 1% rule +9.6/10.0
- ARV discount +7.5/15.0
- Livability +3.3/5.0
- Rent growth +2.5/5.0
- Condition / age +2.5/5.0
- Schools +2.0/10.0
- Appreciation +0.0/10.0
$97,200
🖨 Deal sheet (PDF) 📄 Offer letter ✓ Due diligence
Listing remarks
Have you been itching to live the country life? Here is your opportunity to buy a 3 bedroom, 2 bathroom home on an acre of land. Home may need some repairs upon gaining access. Occupied Reserve Auction - NO ACCESS OR VIEWINGS of this property. Please DO NOT DISTURB the occupant. ''As is'' sale with no contingencies or inspections. Buyer will be responsible for obtaining possession of the property upon closing. Buyer responsible to ensure this Mobile Home/Manufactured Housing Unit has had the wheels, axles, and towing hitch removed, is on a permanent foundation or piers, and has been deemed permanently affixed to the subject property and a real property improvement, according to the requirem
Key facts
- 1.14 acre lot
- Built 2005
- Listed 248 days
Property features AI
Finance
- Other: Property type: Residential, manufactured home; Lot size: 1.14 acres; Additional structure: Mobile home; Subdivision: Tanglewood
Exterior
- Parking: On-street parking
- Utilities: Well water; Septic tank; Sewer and water available
- Home design: Manufactured home (single story); Entry level: One level
- Construction: Composition/shingle roof; Built with other construction materials; Slab foundation
- Exterior features: Paved road access; No notable exterior features listed
Interior
- Bathrooms: Two full bathrooms
- Heating & cooling: Central heating; Central air conditioning
- Interior features: Seven total rooms
Neighborhood map
What this means for you Summary
Snapshot
- This is a 3-bed/2.0-bath manufactured listed at $97k.
Deal economics
- At list price, monthly cash flow is $515 ($6k/yr) — positive.
- The deal already cash-flows at list — no discount required.
- Meets the 1% rule at list price ($1k rent vs $97k).
- Recommended offer: $86k (12.0% below list) — sets the bar for market timing.
- Cap rate 12.6% vs local median 4.1% in Sweetwater — top-decile yield for the area; either an underpriced asset or a hidden risk that comps aren't pricing in. Stress-test before assuming the spread holds.
Location & tenants
- Location reads 66/100 on livability (#134 in TN) — a middle-class / working-renter tenant base. Strengths: cost of living A+, housing A+; Watch: health & safety C-, amenities F, commute F.
- Sweetwater (rural): math 25% / reading 24% proficiency, ranked #94 of 139 in TN (top 68%) — low school quality limits family demand, transient renter base, plan for 1-2y turnover; 61% free/reduced lunch — lower-income household profile, screen leases tightly.
- Zoned schools: Sweetwater Elementary (math 40% / reading 35%, grade F, #269 of 952 statewide, top 28%, 299 students, 0% FRL); Sweetwater Jr High School (math 11% / reading 18%, grade F, #231 of 333 statewide, top 70%, 322 students, 0% FRL) — zoned schools average 0% FRL vs 61% district-wide (61 pts lower); this property's tenant base skews higher-income than the district average.
- Market conditions: 142 active listings in the ZIP; 157 units permitted in Monroe County in 2024 (0 in 5+ unit buildings).
Forward outlook
- Local home prices are declining (-3.0%/yr); year-one equity from $672 of loan paydown is wiped out by about $3k of value loss. Plan a longer hold.
- At projected returns (-3.0% appreciation + 3.0% rent growth), your $27k cash investment doubles in ~6 years — after that, you're playing with house money.
Negotiation context
- It's been on market 248 days — a 12% lower offer ($86k) is reasonable based on typical stale-listing flexibility.
Risks & watch-outs
- Climate carrying-cost: moderate wildfire risk; extreme-heat days projected 7→20/yr by 2055 (HVAC capex compounding) — expect insurance premiums to compound above CPI over the hold.
Questions for the listing agent
- It's been on market 248 days. Have you received any prior offers? Is the seller open to a 12% concession, seller financing, or rate buy-down credit?
- Why hasn't it sold? Are there any deal-killer items the seller is aware of (foundation, flood, title, zoning, code violations)?
- Is there a deadline driving the sale (1031 exchange, divorce, estate, relocation)? That informs how much negotiation room exists.
- Schools are F-rated, which usually means shorter tenancies and higher turnover. Who's the typical renter profile here, and what's been the actual vacancy rate?
- What's the average days-on-market for RENTAL listings here right now (not sales)? A rising rental-DOM trend means longer vacancies and softer asking-rent achievability than the comps imply.
- What's the recent tenant-quality profile in this submarket — average credit score on applications, eviction rate, late-payment / NSF rate, and stable-employment percentage? A property-management company in the area should have these aggregated.
- How much new for-sale + rental construction is in the pipeline within 1–3 miles? Heavy new supply typically softens prices + rents 12–24 months out; constrained supply supports both.
Investment metrics
- 1% rule
- 1.46% ✓
- Cap rate
- 12.65%
- Cash-on-cash
- 22.70%
- DSCR
- 2.01
- GRM
- 5.7
CMA / ARV
No comps found within radius.
Projected returns pro-forma
-3.0% appreciation · 3.0% rent growth · sell at horizon
- IRR
- 15.6%
- Equity multiple
- 1.63×
- Total profit
- $17,020
- Equity at exit
- $14,493
- IRR
- 24.2%
- Equity multiple
- 3.09×
- Total profit
- $56,964
- Equity at exit
- $8,404
Cash invested: $27,216 (down + closing). Projections, not guarantees.
Landlord ↔ Tenant lean methodology
- Overall (STATE)
- 87 Strongly Landlord-Friendly
- State Tennessee
- 87 Strongly Landlord-Friendly · R+13
- County
- — inherits STATE
- City
- — inherits STATE
ZIP-level market 37874
- Home prices YoY
- -5.4%
- Active inventory
- 142
- Price-to-rent
- 5.7×
Monthly cashflow live
- Estimated rent
- $1,417 medium interval (Pro) →
- Mortgage (P&I)
- −$510
- Tax from tax record
- −$55 /mo · $657/yr
- Insurance
- −$40
- HOA
- −$0
- Vacancy / Maint / Mgmt
- −$298
- Net cashflow
- $515
Break-even live
Sensitivity live
| Price | -10% $570 | -5% $542 | +0% $515 | +5% $487 | +10% $460 |
|---|---|---|---|---|---|
| Rent | -10% $403 | -5% $459 | +0% $515 | +5% $571 | +10% $627 |
| Rate | -1.0pp $564 | -0.5pp $540 | base $515 | +0.5pp $490 | +1.0pp $464 |
UW: 25.0% down · 7.5% · 30yr · 1.5% tax · 5.0% vac · 8.0% maint · 8.0% mgmt
Financing live
Cash to close
- Down payment
- $24,300
- Closing costs
- $2,916
- Reserves months
- —
- Total cash needed
- —
Loan-product check · same deal, 3 products live
Conventional
25% down · 7.5% · 30yr
- Down + closing
- —
- Monthly P&I
- —
- Monthly cashflow
- —
- DSCR
- —
- Eligible?
- —
Personal DTI + credit; lowest rate.
DSCR
20% down · 8.5% · 30yr
- Down + closing
- —
- Monthly P&I
- —
- Monthly cashflow
- —
- DSCR
- —
- Eligible?
- —
No personal income docs; deal must DSCR.
Hard money
10% down · 12.0% · 12mo
- Down + closing
- —
- Monthly P&I
- —
- Monthly cashflow
- —
- DSCR
- —
- Eligible?
- —
Short-term bridge; refi at stabilization.
Listing history 26 events
-
2026-06-21days on market $97,200 Active 248 DOM
-
2026-06-21days on market $97,200 Active 247 DOM
-
2026-06-18days on market $97,200 Active 245 DOM
-
2026-06-17days on market $97,200 Active 244 DOM
-
2026-06-16days on market $97,200 Active 243 DOM
-
2026-06-15days on market $97,200 Active 242 DOM
-
2026-06-13days on market $97,200 Active 240 DOM
-
2026-06-12days on market $97,200 Active 239 DOM
-
2026-06-09days on market $97,200 Active 236 DOM
-
2026-06-08days on market $97,200 Active 235 DOM
-
2026-06-08days on market $97,200 Active 234 DOM
-
2026-06-07days on market $97,200 Active 233 DOM
-
2026-06-03days on market $97,200 Active 230 DOM
-
2026-06-02days on market $97,200 Active 229 DOM
-
2026-06-01days on market $97,200 Active 228 DOM
-
2026-05-31days on market $97,200 Active 227 DOM
-
2026-04-16price $97,200
-
2026-03-02price $99,500
-
2026-02-12price $101,900
-
2026-01-26price $104,700
-
2026-01-07price $115,100
-
2025-12-22price $141,300
-
2025-12-05price $164,100
-
2025-11-19price $188,500
-
2025-11-03price $219,000
-
2025-10-16$243,800 Active
ⓘ Source: listings_history table (triggers on properties + properties_extension) + one-shot
backfill from property_details.listing_events for pre-trigger history.
Tax reassessment forecast TN · Resets to sale price
- Current annual tax
- $657 · $55/mo
- Projected year-2 tax
- $690 · $58/mo
- Expected delta
- +$33/yr (+$3/mo · 5.0%)
ⓘ Screening estimate from a state-policy table — verify with the county assessor before closing.
Climate risk First Street
- Flood 1/10 Low FEMA zone X (unshaded) · 0% chance over 30 yrs
- Wildfire 5/10 Major
- Heat 5/10 Major 7 d/yr ≥103°F today · 20 d/yr by 30 yrs out
- Wind 2/10 Low 100% chance of damaging wind over 30 yrs
- Air quality 3/10 Moderate 2 unhealthy d/yr today · 2 by 30 yrs out
Nearby sold comps map
Loading sold comps map…
Walkable amenities ~0.75 mi
Loading nearby amenities…
Taxation est. · year 1
- Rental income
- $17,010
- − Mortgage interest
- −$5,445
- − Property taxes
- −$657
- − Insurance
- −$486
- − Repairs & maintenance
- −$1,361
- − Management
- −$1,361
- − Depreciation
- −$2,828
- Taxable income
- $4,873
- Est. tax owed @ 24.0%
- −$1,170
- After-tax cash flow
- $5,009/yr
For passive investors: Depreciation is non-cash, so a rental often shows a tax loss while cash-flowing — sheltering income. Rental losses are passive: they offset passive income freely, and up to $25,000/yr can offset ordinary (W-2) income if you actively participate and your MAGI is under $100k (phasing out to $0 by $150k); unused losses carry forward. On sale, claimed depreciation is recaptured at up to 25%, and gains may owe capital-gains tax (a 1031 exchange can defer both). Figures are a year-1 estimate at your 24.0% rate — not tax advice; consult a CPA.
Schools (NCES district)
- District
- Sweetwater
- NCES district ID
- 4704050
- Math proficiency
- 25% ▼ -9.00%
- Reading proficiency
- 24% ▼ -4.00%
- Median HH income
- $36,993
- Composite
- 20.41/100
- National rank
- #8586
- State rank
- #94 of 139 in TN
Livability — Sweetwater
- Score
- 66/100
- State rank
- #134
- US rank
- #12256
Category grades
Schools grade is shown separately in the Schools card above.
Census & demographics
- City population
- 16,640
- Population (ZIP)
- 16,640
Population outlook (Monroe County) Hauer SSP2
- Today (2025)
- 47,571 people
- By 2030
- 48,155 · +1.2%
- By 2040
- 48,772 · +2.5%
- By 2050
- 48,698 · +2.4%
- By 2075
- 48,558 · +2.1%
- By 2100
- 47,543 · -0.1%
Race, ethnicity, and origin ACS 2023
- Neighborhood character
- Predominantly White (84%)
- Race & ethnicity
- White 84% Hispanic / Latino 7% Two or more races 7% Black 2%
- Hispanic origin (detail)
- Mexican 6%
- Common ancestry
- Italian 3% Iranian 2% Lithuanian 2%
- Foreign-born
- 3% · Canada, Jamaica, China
- Languages at home
- 94% English-only · Spanish 5%
Political lean MEDSL · Monroe
- 2024 margin
- Solid R (+66.8) · D 16.2% · R 83.0%
- 2008→2024 swing
- -28.5pp toward R · 2008: -38.3pp · 2024: -66.8pp
- All cycles
- 2024: R+66.8 2020: R+62.6 2016: R+59.7 2012: R+45.0 2008: R+38.3
Not yet ingested
- Civics
- —
Market trends
- HPI YoY
- ▼ -19.36%
- Current HPI
- 336.2084
- Rent YoY
- —
- Metro
- —
- State GDP YoY
- ▲ 2.78%
- F500 in state
- 22
Industry mix (Fortune 500 HQ in TN)
| Industry | F500 HQs | Revenue |
|---|---|---|
| Healthcare | 3 | $91B |
|
||
| Retail | 3 | $72B |
|
||
| Transportation / Logistics | 1 | $88B |
|
||
| Paper / Packaging | 1 | $19B |
|
||
| Insurance | 1 | $13B |
|
||
| Energy | 1 | $12B |
|
||
Price history
-60.1% since first listed10 events — show timeline
- 2026-04-16 Price Changed $97,200 GCAR
- 2026-03-02 Price Changed $99,500 GCAR
- 2026-02-12 Price Changed $101,900 GCAR
- 2026-01-26 Price Changed $104,700 GCAR
- 2026-01-07 Price Changed $115,100 GCAR
- 2025-12-22 Price Changed $141,300 GCAR
- 2025-12-05 Price Changed $164,100 GCAR
- 2025-11-19 Price Changed $188,500 GCAR
- 2025-11-03 Price Changed $219,000 GCAR
- 2025-10-16 Listed $243,800 GCAR
Property tax history
+5.1%/yrLatest (2025): $657 · +0.0% YoY. Source: county tax records.
Cash-flow waterfall
monthlySold comps — $/sqft
last 12 mo · ≤1 miLoading sold comps…