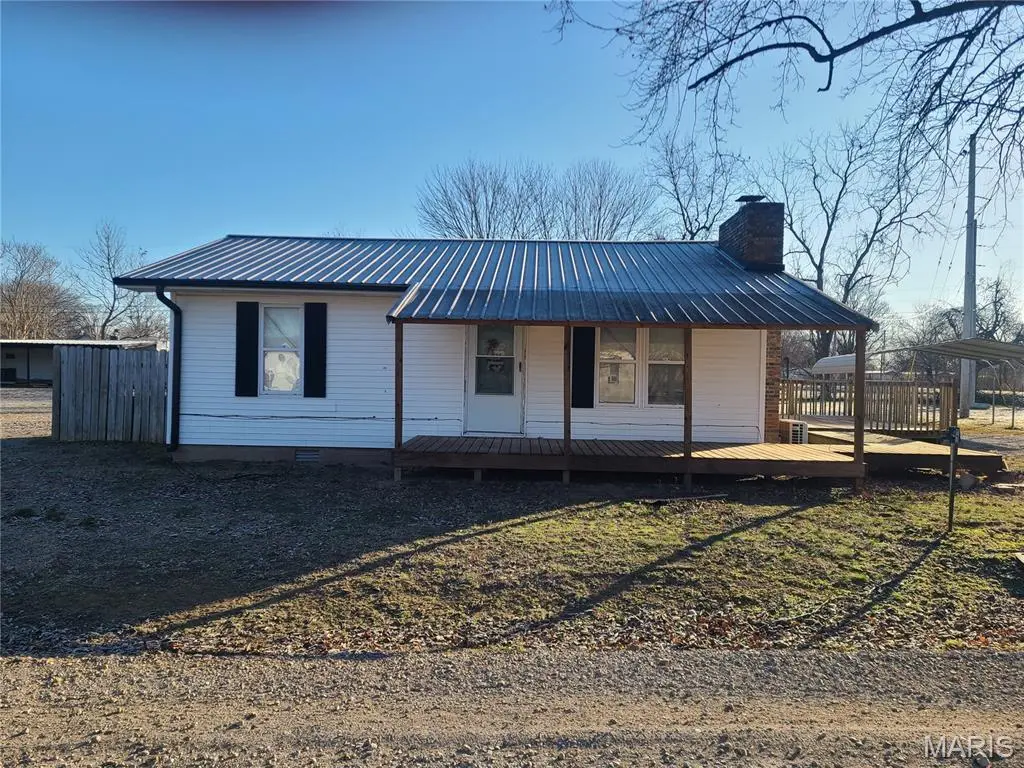
304 Terry St · Anniston, MO
Flood risk 1/10 · Minimal
- FEMA flood zone
- X (shaded)
- Chance of flooding over 30 yrs
- 0.0%
- Est. flood insurance / yr
- $507 – $1,088
Fire risk 1/10 · Minimal
- Est. fire insurance / yr
- $1,054 – $1,958
Heat risk 6/10 · Moderate
- Hot days now (above 109°F)
- 7 days/yr
- Hot days in 30 yrs
- 21 days/yr
Wind risk 3/10 · Minor
- Chance of severe wind over 30 yrs
- 6.0%
Air-quality risk 2/10 · Minimal
- Unhealthy air days now
- 1 days/yr
- Unhealthy air days in 30 yrs
- 1 days/yr
Risk factors via First Street. Map © Google.
Why this score? — see what drove the C+ grade
The composite is a weighted blend of 9 inputs, each scored 0–100. Each bar is that input's sub-score; the figure is the points it added to the 100-point composite (weight × sub-score).
- Cash flow +23.7/30.0
- ARV discount +13.7/15.0
- DSCR +7.6/10.0
- 1% rule +5.0/10.0
- Appreciation +5.0/10.0
- Livability +2.7/5.0
- Rent growth +2.5/5.0
- Condition / age +2.5/5.0
- Schools +1.3/10.0
$90,000
🖨 Deal sheet (PDF) 📄 Offer letter ✓ Due diligence
Listing remarks MLS
2 bedroom, 1 bath home offering 832 sq. feet of living space featuring an open floor plan, kitchen with island, mini-split heating cooling system, and wood burning fireplace. This property offers a large deck and a spacious lot for outdoor use and privacy. Home has been partially remodeled and needs finishing touches to make it your own. New kitchen sink and water heater are being installed. 2-car detached metal carport awning and 53 ft. storage trailer included.
Key facts
- Large deck
- Open floor plan
- Spacious lot
Tags
Neighborhood map
What this means for you Summary
Snapshot
- This is a 3-bed/1.0-bath other listed at $90k.
Deal economics
- At list price, monthly cash flow is $171 ($2k/yr) — positive.
- The deal already cash-flows at list — no discount required.
- To meet the 1% rule (rent ≥ 1% of price), the offer needs to be $90k (0.1% below list).
- Recommended offer: $79k (12.0% below list) — sets the bar for market timing.
Location & tenants
- Location reads 54/100 on livability (#783 in MO) — a working-class tenant base; expect higher turnover. Strengths: cost of living A+, housing A+; Watch: crime F, amenities F, commute F.
- Charleston R-I (town): math 11% / reading 23% proficiency, ranked #310 of 324 in MO (top 96%) — low school quality limits family demand, transient renter base, plan for 1-2y turnover; 78% free/reduced lunch — lower-income household profile, screen leases tightly.
- Zoned schools: Warren E. Hearnes Elem. (math 8% / reading 17%, grade F, #1,007 of 1,115 statewide, top 91%, 262 students, 98% FRL); Charleston Upper Elementary (math 12% / reading 17%, grade F, #362 of 391 statewide, top 93%, 179 students, 92% FRL); Charleston High (math 15% / reading 37%, grade F, #430 of 521 statewide, top 83%, 331 students, 97% FRL) — zoned schools average 96% FRL vs 78% district-wide (18 pts higher); higher-poverty schools than district average — tighter screening recommended.
- Market conditions: 1 active listings in the ZIP; 7 units permitted in Mississippi County in 2024 (0 in 5+ unit buildings).
Forward outlook
- In year one you build about $3k of equity ($622 loan paydown + $3k appreciation (3.0% local appreciation)).
- Mississippi County population projected to shrink 9% by 2050 — rents likely to lag national; underwrite the cash flow, not the appreciation.
- At projected returns (3.0% appreciation + 3.0% rent growth), your $25k cash investment doubles in ~5 years — after that, you're playing with house money.
- By year 10, paydown + projected appreciation supports a ~$32k cash-out refi (75% LTV) — recoverable capital for the next deal without selling this one.
Negotiation context
- It's been on market 149 days — a 12% lower offer ($79k) is reasonable based on typical stale-listing flexibility.
- 2 sale attempts with the ask held roughly flat each time — persistent listings suggest the price (not the market) is what's stuck; bring a comps-based counter.
Risks & watch-outs
- Climate carrying-cost: extreme-heat days projected 7→21/yr by 2055 (HVAC capex compounding) — expect insurance premiums to compound above CPI over the hold.
Questions for the listing agent
- It's been on market 149 days. Have you received any prior offers? Is the seller open to a 12% concession, seller financing, or rate buy-down credit?
- Built in 1970 — when were the roof, HVAC, electrical panel, plumbing, and water heater last replaced?
- Why hasn't it sold? Are there any deal-killer items the seller is aware of (foundation, flood, title, zoning, code violations)?
- Is there a deadline driving the sale (1031 exchange, divorce, estate, relocation)? That informs how much negotiation room exists.
- Schools are F-rated, which usually means shorter tenancies and higher turnover. Who's the typical renter profile here, and what's been the actual vacancy rate?
- Crime grade is F in this area — have there been break-ins, vandalism, or insurance claims at this property in the last 3 years? What carrier currently insures it and at what premium?
- What's the average days-on-market for RENTAL listings here right now (not sales)? A rising rental-DOM trend means longer vacancies and softer asking-rent achievability than the comps imply.
- What's the recent tenant-quality profile in this submarket — average credit score on applications, eviction rate, late-payment / NSF rate, and stable-employment percentage? A property-management company in the area should have these aggregated.
- How much new for-sale + rental construction is in the pipeline within 1–3 miles? Heavy new supply typically softens prices + rents 12–24 months out; constrained supply supports both.
Investment metrics
- 1% rule
- 1.00% ✗
- Cap rate
- 8.58%
- Cash-on-cash
- 8.15%
- DSCR
- 1.36
- GRM
- 8.3
CMA / ARV
- ARV (median comp)
- $104,428
- List price
- $90,000
- Delta
- -13.82%
- Verdict
- UNDERPRICED
- Comps
- 1 within 2.0 mi
Projected returns pro-forma
3.0% appreciation · 3.0% rent growth · sell at horizon
- IRR
- 15.1%
- Equity multiple
- 1.86×
- Total profit
- $21,706
- Equity at exit
- $40,468
- IRR
- 16.8%
- Equity multiple
- 3.46×
- Total profit
- $61,956
- Equity at exit
- $62,366
Cash invested: $25,200 (down + closing). Projections, not guarantees.
Landlord ↔ Tenant lean methodology
- Overall (STATE)
- 81 Strongly Landlord-Friendly
- State Missouri
- 81 Strongly Landlord-Friendly · R+10
- County
- — inherits STATE
- City
- — inherits STATE
ZIP-level market 63820
- Active inventory
- 1
- Price-to-rent
- 8.3×
Monthly cashflow live
- Estimated rent
- $899 medium interval (Pro) →
- Mortgage (P&I)
- −$472
- Tax from tax record
- −$30 /mo · $357/yr
- Insurance
- −$38
- HOA
- −$0
- Vacancy / Maint / Mgmt
- −$189
- Net cashflow
- $171
Break-even live
Sensitivity live
| Price | -10% $222 | -5% $197 | +0% $171 | +5% $146 | +10% $120 |
|---|---|---|---|---|---|
| Rent | -10% $100 | -5% $136 | +0% $171 | +5% $207 | +10% $242 |
| Rate | -1.0pp $216 | -0.5pp $194 | base $171 | +0.5pp $148 | +1.0pp $124 |
UW: 25.0% down · 7.5% · 30yr · 1.5% tax · 5.0% vac · 8.0% maint · 8.0% mgmt
Financing live
Cash to close
- Down payment
- $22,500
- Closing costs
- $2,700
- Reserves months
- —
- Total cash needed
- —
Loan-product check · same deal, 3 products live
Conventional
25% down · 7.5% · 30yr
- Down + closing
- —
- Monthly P&I
- —
- Monthly cashflow
- —
- DSCR
- —
- Eligible?
- —
Personal DTI + credit; lowest rate.
DSCR
20% down · 8.5% · 30yr
- Down + closing
- —
- Monthly P&I
- —
- Monthly cashflow
- —
- DSCR
- —
- Eligible?
- —
No personal income docs; deal must DSCR.
Hard money
10% down · 12.0% · 12mo
- Down + closing
- —
- Monthly P&I
- —
- Monthly cashflow
- —
- DSCR
- —
- Eligible?
- —
Short-term bridge; refi at stabilization.
Listing history 17 events
-
2026-06-18days on market $90,000 Active 149 DOM
-
2026-06-17days on market $90,000 Active 148 DOM
-
2026-06-16days on market $90,000 Active 147 DOM
-
2026-06-15days on market $90,000 Active 146 DOM
-
2026-06-13days on market $90,000 Active 144 DOM
-
2026-06-12days on market $90,000 Active 143 DOM
-
2026-06-09days on market $90,000 Active 140 DOM
-
2026-06-08days on market $90,000 Active 139 DOM
-
2026-06-07days on market $90,000 Active 138 DOM
-
2026-06-05days on market $90,000 Active 136 DOM
-
2026-06-04days on market $90,000 Active 134 DOM
-
2026-06-02days on market $90,000 Active 133 DOM
-
2026-06-01days on market $90,000 Active 132 DOM
-
2026-05-31days on market $90,000 Active 131 DOM
-
2026-03-19status Active 468-char remark
Show marketing remark (468 chars)
2 bedroom, 1 bath home offering 832 sq. feet of living space featuring an open floor plan, kitchen with island, mini-split heating cooling system, and wood burning fireplace. This property offers a large deck and a spacious lot for outdoor use and privacy. Home has been partially remodeled and needs finishing touches to make it your own. New kitchen sink and water heater are being installed. 2-car detached metal carport awning and 53 ft. storage trailer included.
-
2026-01-23historical Active Under Contract 468-char remark
Show marketing remark (468 chars)
2 bedroom, 1 bath home offering 832 sq. feet of living space featuring an open floor plan, kitchen with island, mini-split heating cooling system, and wood burning fireplace. This property offers a large deck and a spacious lot for outdoor use and privacy. Home has been partially remodeled and needs finishing touches to make it your own. New kitchen sink and water heater are being installed. 2-car detached metal carport awning and 53 ft. storage trailer included.
-
2026-01-20$90,000 Active 468-char remark
Show marketing remark (468 chars)
2 bedroom, 1 bath home offering 832 sq. feet of living space featuring an open floor plan, kitchen with island, mini-split heating cooling system, and wood burning fireplace. This property offers a large deck and a spacious lot for outdoor use and privacy. Home has been partially remodeled and needs finishing touches to make it your own. New kitchen sink and water heater are being installed. 2-car detached metal carport awning and 53 ft. storage trailer included.
ⓘ Source: listings_history table (triggers on properties + properties_extension) + one-shot
backfill from property_details.listing_events for pre-trigger history.
Tax reassessment forecast MO · Resets to sale price
- Current annual tax
- $357 · $30/mo
- Projected year-2 tax
- $873 · $73/mo
- Expected delta
- +$516/yr (+$43/mo · 144.5%)
ⓘ Screening estimate from a state-policy table — verify with the county assessor before closing.
Climate risk First Street
- Flood 1/10 Low FEMA zone X (shaded) · 0% chance over 30 yrs
- Wildfire 1/10 Low
- Heat 6/10 Major 7 d/yr ≥109°F today · 21 d/yr by 30 yrs out
- Wind 3/10 Moderate 6% chance of damaging wind over 30 yrs
- Air quality 2/10 Low 1 unhealthy d/yr today · 1 by 30 yrs out
Nearby sold comps map
Loading sold comps map…
Walkable amenities ~0.75 mi
Loading nearby amenities…
Taxation est. · year 1
- Rental income
- $10,791
- − Mortgage interest
- −$5,041
- − Property taxes
- −$357
- − Insurance
- −$450
- − Repairs & maintenance
- −$863
- − Management
- −$863
- − Depreciation
- −$2,618
- Taxable income
- $598
- Est. tax owed @ 24.0%
- −$143
- After-tax cash flow
- $1,911/yr
For passive investors: Depreciation is non-cash, so a rental often shows a tax loss while cash-flowing — sheltering income. Rental losses are passive: they offset passive income freely, and up to $25,000/yr can offset ordinary (W-2) income if you actively participate and your MAGI is under $100k (phasing out to $0 by $150k); unused losses carry forward. On sale, claimed depreciation is recaptured at up to 25%, and gains may owe capital-gains tax (a 1031 exchange can defer both). Figures are a year-1 estimate at your 24.0% rate — not tax advice; consult a CPA.
Schools (NCES district)
- District
- Charleston R-I
- NCES district ID
- 2908670
- Math proficiency
- 11% ▲ 2.00%
- Reading proficiency
- 23% ▼ -1.00%
- Median HH income
- $29,019
- Composite
- 13.37/100
- National rank
- #9531
- State rank
- #310 of 324 in MO
Livability — Anniston
- Score
- 54/100
- State rank
- #783
- US rank
- #23947
Category grades
Schools grade is shown separately in the Schools card above.
Census & demographics
- Census place
- Anniston, MO
- City population
- 269
- Population (ZIP)
- 269
Population outlook (Mississippi County) Hauer SSP2
- Today (2025)
- 13,403 people
- By 2030
- 13,101 · -2.3%
- By 2040
- 12,626 · -5.8%
- By 2050
- 12,233 · -8.7%
- By 2075
- 10,704 · -20.1%
- By 2100
- 8,345 · -37.7%
Race, ethnicity, and origin ACS 2023
- Neighborhood character
- Predominantly White (100%)
- Race & ethnicity
- White 100%
- Common ancestry
- Serbian 1%
Political lean MEDSL · Mississippi
- 2024 margin
- Solid R (+53.7) · D 22.8% · R 76.5%
- 2008→2024 swing
- -39.0pp toward R · 2008: -14.7pp · 2024: -53.7pp
- All cycles
- 2024: R+53.7 2020: R+49.6 2016: R+41.5 2012: R+23.2 2008: R+14.7
Not yet ingested
- Civics
- —
Market trends
- HPI YoY
- —
- Current HPI
- —
- Rent YoY
- —
- Metro
- —
- State GDP YoY
- ▲ 1.84%
- F500 in state
- 20
Industry mix (Fortune 500 HQ in MO)
| Industry | F500 HQs | Revenue |
|---|---|---|
| Healthcare | 1 | $163B |
|
||
| Insurance | 1 | $21B |
|
||
| Industrial Technology | 1 | $17B |
|
||
| Retail | 1 | $16B |
|
||
| Industrial Distribution | 1 | $10B |
|
||
| Utilities | 1 | $9B |
|
||
Price history
3 events — show timeline
- 2026-03-19 Relisted — MARIS as Distributed by MLS Grid
- 2026-01-23 Contingent — MARIS as Distributed by MLS Grid
- 2026-01-20 Listed $90,000 MARIS as Distributed by MLS Grid
Property tax history
+1.6%/yrLatest (2025): $357 · +4.0% YoY. Source: county tax records.
Cash-flow waterfall
monthlySold comps — $/sqft
last 12 mo · ≤1 miLoading sold comps…